EFFICIENT DETECTION IN DDOS ATTACK FOR
TOPOLOGY GRAPH DEPENDENT PERFORMANCE
IN PPM LARGE SCALE IPTRACEBACK
S.Abarna
1, R.Padmapriya
2 1Mphil Scholar,
2Assistant Professor
,
Department of Computer Science,
NadarSaraswathi College (India)
ABSTRACT
A variety of schemes based on the technique of Probabilistic Packet Marking (PPM) have been proposed to
identify Distributed Denial of Service (DDoS) attack traffic sources by IP trace back. These PPM-based
schemes provide a way to reconstruct the attack graph - the network path taken by the attack traffic - hence
identifying its sources. Despite the large amount of research in this area, the influence of the underlying
topology on the performance of PPM-based schemes remains an open issue. Distributed Denial-of-Service
(DDoS) attacks are a critical threat to the Internet. However, the memory less feature of the Internet routing
mechanisms makes it extremely hard to trace back to the source of these attacks. In this paper, we propose a
novel trace back method for DDoS attacks that is based on entropy variations between normal and DDoS attack
traffic, which is fundamentally different from commonly used packet marking techniques.we identify five
network-dependent factors that affect different PPM-based schemes uniquely giving rise to a variation in and
discrepancy between scheme performances from one network to another. Using simulation, we also show the
collective effect of these factors on the performance of selected schemes in an extensive set of 60 Internet-like
networks. We find that scheme performance is dependent on the network on which it is implemented. We show
how each of these factors contributes to a discrepancy in scheme performance in large scale networks. This
discrepancy is exhibited independent of similarities or differences in the underlying models of the networks.
I. INTRODUCTION
Internet Protocol (IP) trace back is a technique for identi- fying the sources of Distributed Denial of Service
(DDoS) attacks from its traffic . One approach to implementing IP trace back ensures that the routers embed
their identity in packets randomly selected from all the packets they process . In the event of an attack, the
victim uses the packets that contain router identities to construct an attack graph. The attack graph is a
representation of the routers and links that the attack packets traversed from the attacker(s) to the victim. This IP
trace back type is called probabilistic packet marking (PPM) and is implemented by PPM-based schemes. A lot
of intensive research has gone into designing PPM- based schemes that are computationally more efficient and
robust than the original PPM. However, little work has gone into identifying network-dependent factors that
affect the performance of PPM-based schemes in large-scale networks. In fact, most simulations are carried out
on disparate tree- structured topologies and the analytical models derived from these topologies are used to
predict the performance of the schemes when deployed in a large-scale network such as the Internet . However,
different schemes. Furthermore, because typical underlying topologies are tree-structured, it is difficult to make
appropriate projections about scheme performance in a large-scale network without implementing the scheme
on that network. In this work, we show the influence of network topology on PPM-based scheme performance.
We identify three network- dependent factors that affect scheme performance in large- scale networks. These
factors include average shortest path length, overlapping of attack paths, and the occurrence of network motifs
in attack graphs. Using specific attack graphs, we show the influence of each factor on selected PPM- based
schemes. We then use 60 Internet-like networks to show how all the identified factors collectively contribute to
the performance of PPM-based schemes in more realistic scenarios. The networks are selected to encompass the
variety of mathematical models used by researchers to create networks that adequately describe the structure of
the Internet. Results show that PPM-based scheme performance is de- pendent on the network on which it is
implemented. In fact, even the order of performance changes from one network to another, i.e. the best
performing scheme in one network is not necessarily the best performing scheme in another network. Our
results show how the identified factors contribute, both individually and collectively, to the PPM-based schemes’ performance in large scale networks.
II.UNDERLYING TOPOLOGIES
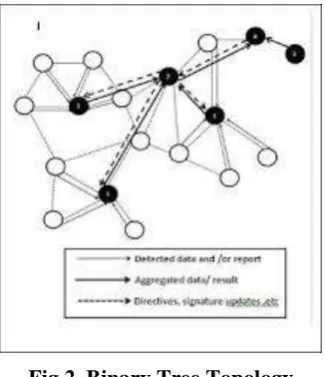
A variety of underlying topologies have been used to evaluate the performance of PPM-based schemes. Some
schemes use a single path single attacker (SP/SA) topology to simulate a Denial of Service (DoS) attack [2], [3],
[5], [6], [8]. In these cases, the length of the attack path is different ranging from 3 hops to 32 hops. Other
schemes utilize trees as their underlying topologies for simulation. These include binary trees in [4], [3], [10]
ranging from 6 hops to 10 hops. Other tree structures such as random tree networks are used in [3], [8]. Yet
other schemes utilize internet topology datasets such as traceroute datasets and skitter maps [9]. While these
topologies are significantly larger than other topologies (up to 174,409 nodes), they do not easily lend
themselves to simulations and, consequently, comparisons with other schemes.
Fig 2. Binary Tree Topology
III. SIMULATION STUDY
The 60 networks that are considered in this study and some of their properties. These properties include the
Additionally, network specific properties, e.g. average shortest path length, and network motif IDs are shown.
Each of the networks consists of 1000 nodes representing routers in a network, all of which employ the marking
schemes. One of the nodes is selected to be the victim and 50 other nodes are randomly selected to be the
attackers. Constant Bit Rate (CBR) sources of traffic are implemented at the attackers, and the convergence time
for the entire attack graph is measured in packets. This simulation is executed 200 times for each network and
each marking scheme.
Fig 3. (a) Number of Network Attack Notes
Fig 3. (b) Constant Bit Rate
IV. OVERLAPPING OF ATTACK PATHS
In this subsection, we show how the level of overlap between two attack paths affects the schemes’ convergence
times. We consider a Y-shaped attack graph linking attackers A1 and A2 to victim V (cf. Fig. 2). While keeping
each attack path equal and constant, we vary the amount of overlap between the attack paths and observe how
the convergence times of PPM, TMS, and PBS are affected. Fig. 6 shows the observed results from this
investigation. The results show that there is a general reduction in con- vergence times for all considered
schemes as the percentage overlap is increased. Despite the general reduction for all 3 considered schemes, the
level of overlap affects each scheme uniquely. For example, the results show that PPM and TMS are relatively
unaffected by low amounts of overlap, i.e. 0-20% while PBS exhibits a reduction in convergence times in the
same overlap range. However, further increase in percentage overlap causes a drastic decrease in the
convergence time of TMS such that by 60%-70% TMS has lower conver- gence times than both PBS and PPM.
These results show three things: Firstly, larger amounts of overlapping attack paths translates to reduced
convergence times; Secondly, low amounts of overlapping attack paths affects PBS more than PPM and TMS;
and thirdly, medium amounts of overlapping cause a drastic reduction in TMS convergence times. In the context
of a larger network, these results mean that even for long path lengths, the existence of common and therefore
Fig 4. (a) TMS convergence times
Fig 4.(b) PBS
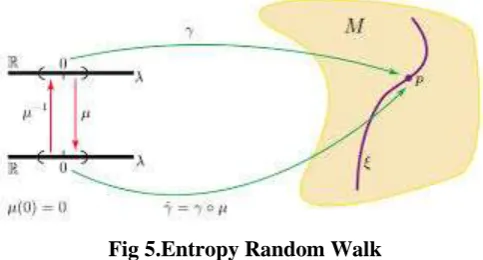
V. MAXIMUM ENTROPY RANDOM WALK
Instead of using GRW, Burda et al. [15] introduce the construction of Maximum Entropy Random Walk
(MERW), where the transition matrix is defined by the entries pi,j as follows. pi,j =ai,j λ ψjψi
Fig 5.Entropy Random Walk
The term λ is the largest eigenvalue of A and ψ its corresponding normalized eigenvector withi ψ2 i =1. Thus,
the transition probabilities of the random walk process are similar to the eigenvector centrality of the nodes,
which is regarded as one way of describing the influence of a node within the topology. The same way of defining entropy within a network and setting the transition probabilities accordingly to maximize entropy were
also discussed by Demetrius and Manke in [17]. They further establish a relationship between entropy and the
robustness of the average shortest path length since networks that have a higher entropy are also more robust
toward removal of nodes. The stationary distribution of finding a query packet at node i with MERW and its
entropy rate are then according to [15] as shown in Eqns. (6) and (7).π∗ i = ψ2 i (6) SMERW = logλ
(7)Unfortunately, the definition of the transition probabilities in Eqn. (5) requires knowledge of the largest
eigenvalue of the adjacency matrix and its corresponding eigenvector. This can only be determined if the
topology is fully known and is usually not very practical, especially in large networks. However, it was shown
by Sinatra et al. [16] that the maximum entropy random walk can be constructed only with limited and local
5.1 Average Number of Hops
The average number of hops for a query packet indicates the speed of search within the network. Figure 3 shows
the average hop count until finding one of the destinations for the three different methods with R = 50destination
nodes and the network size N varying from 200 to 1000. The results for the scale-free topology are shown in
Fig. 3(a) and for the small-world topology in Fig. 3(b).
Fig 5.(a) Scale-Free Topoloy
Fig5(b) Smal –world topology
VI. CONCLUSION AND FUTURE WORK
In this paper we studied the feasibility of applying a random walk query search in a data-centric network under
random and complex topologies. For suitable topologies, random walk does not necessarily perform much
worse than the commonly used flooding mechanism. On the contrary, since only a single path is followed during
the query search, fewer nodes are involved in the dissemination process, which leads to a lower consumption of
energy. We have seen that a maximum entropy random walk improves the general random walk in performance
by counteracting the irregularities in topology to balance the reachability probability of the destination nodes.
Furthermore, only a small number of destination nodes in the network is sufficient to provide replicas of the
desired content for achieving performance compared to flooding for both small world and scale-free topologies
.
REFERENCES
[1] C. Intanagonwiwat, R. Govindan, and D. Estrin, “Directed diffusion: a scalable and robust communication
paradigm for sensor networks”, in Proc. 6th Annu. Int. Conf. on Mobile Computing and Networking (MobiCom ’00), pp. 56–56, Boston, MA, 2000.
[2] I. Stojmenovic´ and S. Olariu, “Data-centric protocols for wireless sensor networks”, in Handbook of
sensor networks: algorithms and architectures, I. Stojmenovic´ (Ed.), John Wiley & Sons, 2005.
[3] V. Jacobson, D. K. Smetters, J. D. Thornton, M. Plass, N. Briggs, and R. Braynard. 2012. “Networking
named content”. Commun. ACM, vol. 55, no. 1, pp. 117–124, Jan. 2012.
[4] J. Choi, J. Han, E. Cho, T. Kwon, and Y. Choi, “A survey on content-oriented networking for efficient
content delivery”, IEEE Com- mun. Mag., vol. 49, no. 3, pp. 121–127, March 2011.
[5] A. Mainwaring, D. Culler, J. Polastre, R. Szewczyk, and J. Anderson, “Wireless sensor networks for