O R I G I N A L R E S E A R C H
A Systematic Review of Instruments for the
Assessment of Insomnia in Adults
This article was published in the following Dove Press journal: Nature and Science of Sleep
Raja Mahamade Ali
Monica Zolezzi
Ahmed Awaisu
College of Pharmacy, QU Health, Qatar
University, Doha 2713, Qatar
Introduction:
Self-reported sleep instruments remain the most practical methods for the
assessment of insomnia in clinical practice. This systematic review aims to identify, describe
and summarize the psychometric properties of questionnaires available for the assessment of
insomnia in the adult population. In addition, the review also aimed to identify sleep
instruments available in the Arabic language.
Methods:
A systematic literature search was conducted using the following electronic
databases: PubMed, EMBASE, ProQuest Central, SCOPUS, and Google Scholar. The quality
assessment of the instruments was conducted using two established international criteria.
Results:
One hundred and seven articles were selected for inclusion, from which 31
instruments were identi
fi
ed and categorized based on the constructs they assess as: (1)
screening for insomnia (n=14); (2) measuring the consequences of insomnia (n=8); (3)
assessing the cognitive aspects of insomnia (n= 5); and (4) assessing sleep hygiene (n= 4).
The review of the psychometric properties showed that the Insomnia Severity Index and the
Functional Outcomes of Sleep Questionnaire were the most extensively evaluated
instru-ment. Criterion validity and reliability measures were the most commonly reported
proper-ties. Only four of the identi
fi
ed instruments were available in Arabic.
Discussion:
Overall, the
fi
ndings of this study indicate ample availability of sleep
instru-ments. However, psychometric testing for several of the available sleep instruments remains
incomplete, particularly responsiveness and interpretability. Our
fi
ndings suggest that future
studies should focus on reporting more psychometric measures to ensure the trustworthiness
of these instruments.
Keywords:
insomnia, sleep hygiene, sleep quality, questionnaires, psychometric properties
Introduction
Worldwide reports suggest that around one-third of the adult population complains
of insomnia symptoms.
1–2Insomnia is characterized by persistent sleep dif
fi
culty
despite adequate sleep opportunity and associated daytime dysfunction.
3Insomnia
has been associated with increased rates of road accidents, lower productivity and
work absenteeism.
4,5Several factors are known to contribute to the development or
worsening of insomnia symptoms. Current
fi
ndings from the literature suggest that
negative cognitive processes including worry, rumination and catastrophizing
thoughts are associated with worse sleep quality and insomnia.
6These processes
have been shown to fuel anxiety and arousal resulting in delayed sleep onset and
shorter sleep duration.
7Similarly, poor sleep hygiene, which consists of a
combina-tion of behavioral practices and environmental condicombina-tions which improves sleep, is
common among insomniacs.
8–11Correspondence: Monica Zolezzi
College of Pharmacy, QU HealthQatar
University, PO Box 2713, Doha, Qatar
Tel +974 4403 5623
Fax +974 4403 5551
Email mzolezzi@qu.edu.qa
Nature and Science of Sleep
Dove
press
open access to scientific and medical research
Open Access Full Text Article
Nature and Science of Sleep downloaded from https://www.dovepress.com/ by 118.70.13.36 on 27-Aug-2020
Studies suggest that chronic insomnia is an
indepen-dent risk factor for developing mental illnesses in
other-wise healthy individuals.
12,13Chronic insomnia has also
been reported to increase the probability of developing
chronic medical conditions, such as hypertension,
cardio-vascular disease and type 2 diabetes.
14,15Therefore, early
detection and management of insomnia is important to
minimize these associated risks. Although
polysomnogra-phy (PSG) is considered the gold standard method for
evaluating insomnia, it is not routinely used as it requires
a specialized setting and equipment, and it is often labour
intensive. Wrist actigraphy is another objective tool for the
assessment of insomnia, but is limited by its lack of
speci
fi
city.
16,17Consequently, self-reported sleep
instru-ments remain the most practical methods for the
assess-ment of insomnia in clinical practice.
16,18There are
several systematic reviews on a range of sleep instruments
utilized for the assessment of sleep dysfunction in a
vari-ety of medical and neuropsychiatric disorders, or in
spe-cialized populations.
19–21In these reviews, there was
insuf
fi
cient evaluation of the psychometric properties of
the instruments that were identi
fi
ed, and none of them
included instruments which assess sleep hygiene practices
in the adult population. Therefore, the main objective of
this study is to present an updated systematic review of the
literature on validated self-reported instruments used for
the assessment of different dimensions of sleep in the adult
population. In addition, the review also aimed to identify
sleep instruments available in Arabic language.
Methods
Search methods
Data Sources and Search Strategy
A comprehensive systematic search was conducted to
identify studies reporting the development and/or
valida-tion of instruments for the assessment of self-reported
sleep and sleep hygiene in the adult population. The
fi
ve
databases and search engines utilized included PubMed
(1966 - April 2018), EMBASE (1980 - April 2018),
ProQuest Central (1947
–
2018), SCOPUS (1966 - April
2018), and Google Scholar (till April 2018). Grey
litera-ture was also searched by reviewing conference
proceed-ings and abstracts of the Canadian Sleep Society and the
American Academy of Sleep Medicine published in the
period
from
January
2014
to
December
2017.
Additionally, a hand search of the bibliographies of the
articles identi
fi
ed through the electronic databases search
was undertaken. Search terms used in the electronic
data-bases search were classi
fi
ed into three categories related
to: sleep dysfunction (Category A), the instrument for
assessment (Category B), and validation and psychometric
properties (Category C). Terms from Category C were not
used in databases such as PubMed which offered
“
valida-tion studies
”
as one of the limits or
fi
lters. Publication
language was limited to English and no limits were
imposed on the publication year. Examples of full search
strategies for two of the electronic databases can be found
under the
supplementary material
. In addition to the
English search, two separate searches were conducted to
identify sleep instruments developed in Arabic language or
translated into Arabic. The
fi
rst used the same search terms
as those used in the original search, in addition to the word
“
Arabic
”
. The second was conducted in Arabic language
in the following databases: PubMed, Google Scholar and
Dar Al-mandumah using the same search terms as those
used in the original search.
Inclusion Criteria
Articles selected for full review were those providing
results of validation studies or reporting psychometric
properties of instruments and questionnaires assessing
characteristics of sleep (quality, quantity, nocturnal
awa-kenings), daytime consequences of poor sleep, or sleep
hygiene in the adult population. The inclusion criteria
were limited to instruments completed by self-report and
to instruments written in English or Arabic.
Exclusion Criteria
Studies were excluded from the review if they included
evaluating instruments designed to measure sleep
disor-ders other than insomnia (eg obstructive sleep apnea,
rest-less leg syndrome, etc.), those using sleep items as
subdomains of an instrument assessing a condition other
than insomnia, studies which focused on pediatric/geriatric
populations, studies describing instruments designed to be
completed by clinician or caregiver and not by the patient,
using instruments developed in languages other than
English or Arabic, or describing instruments not
psycho-metrically validated.
Data Collection and Analysis
Data Collection Process and Data Extraction
Duplicate citations were removed after obtaining the initial
records of relevant articles from different databases. Titles
and abstracts of the articles were then screened for
Nature and Science of Sleep downloaded from https://www.dovepress.com/ by 118.70.13.36 on 27-Aug-2020
relevance. Full-text of eligible articles were obtained and
screened against the inclusion and exclusion criteria. Data
were extracted from the eligible studies according to eight
key attributes, as established by the Scienti
fi
c Advisory
Committee, Medical Outcomes Trust (SAC-MOT).
22The
extraction tool used in this study included the following
elements: instrument
’
s name, authors, conceptual
frame-work (domains and purpose), psychometric properties,
validation population, general description of the
instru-ment (number of items, scale, scoring, response format,
burden), and cultural and linguistic adaptation. The
psy-chometric properties were extracted from studies
describ-ing the validation of the original (English or Arabic)
version of the instruments. The psychometric properties
extracted from the validation studies included validity,
reliability, responsiveness, and interpretability. In addition,
instruments
’
attributes related to the validation sample
were extracted. Data extraction was done by one reviewer
(RA) and reviewed by a second author (MZ). The
psycho-metric properties for instruments validated in speci
fi
c
populations were not extracted.
Quality Assessment
A modi
fi
ed version of the criteria developed by Terwee
et al
23was used to assess the quality of the sleep
instru-ments. The Terwee at al. criteria evaluates 8 psychometric
properties including validity (content, construct and
criter-ion), reliability (internal consistency and reproducibility),
responsiveness, interpretability and
fl
oor and ceiling
effects.
23For the purposes of this study, the criteria for
the
fl
oor and ceiling effects and the agreement component
of the reproducibility were not used, primarily because, for
the most part, these measures were not reported in the
validation studies included in this review. In addition,
Pearson
’
s Correlation Coef
fi
cient was used for rating the
reliability, responsiveness, criterion and construct validity.
Results
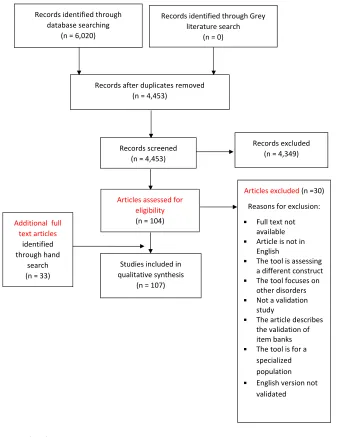
As illustrated in
Figure 1
, a total of 4453 citations were
retrieved from the search. One hundred and seven articles
were deemed suitable for inclusion in the review. These
articles included 31 distinct sleep instruments. Of the 107
articles included, 47 discussed the validation process of
the instruments in English, while the remaining 60 articles
reviewed the translation and cultural adaptation of these
instruments into a variety of languages and populations.
The two additional searches to identify sleep instruments
in the Arabic language did not identify any additional
results than those derived from the original search.
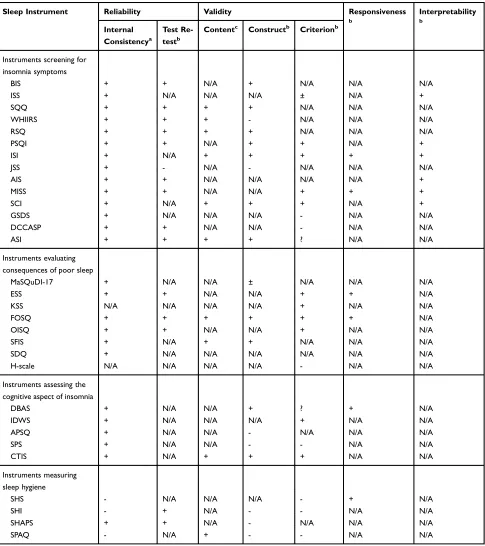
Table 1
summarizes the results of the validation studies
(n=47) related to the 31 sleep instruments included in this
review. The table also describes the psychometric
proper-ties of the instruments and the characteristics of the
popu-lations in which they were validated.
Table 2
provides a
detailed description of the characteristics of the 31
instruments.
As summarized in
Tables 1
and
2
, the majority of the
instruments identi
fi
ed contain less than 20 items. The
longest of these instruments is the Sleep Practices and
Attitudes Questionnaire (SPAQ), which contains 151
questions divided into 16 different domains.
75While the
Karolinska Sleepiness Scale (KSS),
24the Minimal
Insomnia Symptoms Scale (MISS),
25,26and the Jenkins
Sleep Scale (JSS)
27–73are the shortest instruments
iden-ti
fi
ed, consisting of one, three, and four questions,
respectively. Some of the instruments have multiple
ver-sions, each consisting of a different number of questions
[eg, the Functional Outcomes of Sleep Questionnaire
(FOSQ)-30 and the FOSQ-10 have 30 and 10 questions,
respectively].
74,28The majority of the instruments use
Likert-type scales as response options to generate scores.
The time needed to complete an instrument was not
reported in the majority of the studies reviewed.
However, the response burden, wherever reported, did
not exceed 10 minutes. The recall period for the majority
of the instruments was one month, except for the
Insomnia Severity Index (ISI)
29,30and the the Sleep
Functional Impact Scale (SFIS)
31which had a recall
period of 2 weeks and 1 week, respectively. Only four
of the identi
fi
ed instruments were available in Arabic,
three of which (PSQI,
32ISI,
33and ESS
34) were originally
developed in English, but translated and validated in
Arabic-speaking populations. The Arabic Scale of
Insomnia (ASI)
35is the only instrument which was
ori-ginally developed in Arabic.
The instruments were classi
fi
ed into four categories
based on the outcomes that were assessed in the 107
studies, as follows: (1) instruments screening for insomnia
symptoms (n=14); (2) instruments assessing consequences
of poor sleep (n=8); (3) instruments assessing the
cogni-tive aspect of insomnia (n=5) and; (4) instruments
evalu-ating sleep hygiene (n=4). A detailed description of the
reported psychometric properties for the four categories of
sleep instruments retrieved from the studies included in
this review is provided in
Table 3
.
Nature and Science of Sleep downloaded from https://www.dovepress.com/ by 118.70.13.36 on 27-Aug-2020
Instruments Screening for Insomnia
Symptoms
From the 14 instruments screening for insomnia
symp-toms, two [the Women
’
s Health Initiative Insomnia
Rating Scale (WHIIRS)
36,37and the Restorative Sleep
Questionnaire (RSQ)
38] were dimension-speci
fi
c and
focus on evaluating the sleep quality through assessing
problems with initiation and maintenance of sleep. The
remaining 12 instruments were multidimensional,
asses-sing sleep quality and consequences of poor sleep. Some
of the identi
fi
ed instruments also measure other speci
fi
c
dimensions such as satisfaction with sleep in the Bergen
Insomnia Scale (BIS)
39and sleep environment in the
Insomnia Screening Scale (ISS).
40While the Daily
Cognitive-Communication
and
Sleep
Pro
fi
le
(DCCASP)
41measures the daily
fl
uctuation in sleep
qual-ity and evaluates the impact of these
fl
uctuations on the
individual
’
s cognitive functioning and communication,
while the General Sleep Disturbance Scale (GSDS)
42,43assesses sleeping patterns and the use of sleep aids during
the past month.
Instruments Assessing Consequences of
Poor Sleep
These instruments measure an individual
’
s functioning
and daytime performance. Two of these instruments
[the Epworth Sleepiness Scale (ESS
44–46and the
KSS)
24,47focus on assessing sleepiness only, whereas
Records identified through
database searching
(n = 6,020)
Records identified through Grey
literature search
(n = 0)
Records after duplicates removed
(n = 4,453)
Records screened
(n = 4,453)
Records excluded
(n = 4,349)
Articles assessed for
eligibility
(n = 104)
Articles excluded
(n =30)
Reasons for exclusion:
Full text not
available
Article is not in
English
The tool is assessing
a different construct
The tool focuses on
other disorders
Not a validation
study
The article describes
the validation of
item banks
The tool is for a
specialized
population
English version not
validated
Additional full
text articles
identified
through hand
search
(n = 33)
Studies included in
qualitative synthesis
(n = 107)
Figure 1Flow chart of the systematic review process.
Nature and Science of Sleep downloaded from https://www.dovepress.com/ by 118.70.13.36 on 27-Aug-2020
T
able
1
Studies
T
esting
the
Psychometric
Pr
oper
ties
of
Extracted
Sleep
Instruments
Author
,
y
ear
Instruments
Sample
V
alidity
Reliability
Responsiveness
and
Interpr
etability
Pallesen
et
al,
2008
39
The
Bergen
insomnia
scale
(BIS)
Univer
sity
students:
(n=320)
Community sample: (n=5,000) Patient
sample:
(n=225)
Con
verg
ent
and
discriminant
:
BIS
signi
fi
cantly
associated
with
Athens
Insomnia
scale
(r=0.79)
and
the
PSQI
(r=0.73).
BIS
had
lower
corr
elation
with
Beck
depr
ession
and
anxiety
in
ventories
(r=0.55
and
0.32
respectiv
ely).
-Internal
consistenc
y
:
Students:
α
=
0.79
Community:
α
=
0.87
Patient
sample:
α
=
0.80
-Test
retest
(after
2
week
s)
Students
(n=200):
r
=
0.77
NR
Y
eh
et
al,
2012
40
The
Insomnia
Scr
eening
Scale
(ISS)
Study
1:
(n=162)
-Primar
y
insomniacs -Health
y
participants Study
2:
(n=262)
Community sample (paediatrics, adults
and
elderly)
Concurrent/criter
ion
validity
:
-ISS
signi
fi
cantly
corr
elated
with
Insomnia
se
verity
index
(ISI)
and
PSQI
(PSQI):
(r
=0.87
and
r
=0.85
respectiv
ely).
-Da
ytime
functioning
domain
signi
fi
cantly
corr
elated
with
ISI
and
PSQI
(r
=0.63
and
0.68
respectiv
ely).
-Sleep
en
vir
onment
domain
negativ
ely
corr
elated
with
PSQI
and
ISI:
(r
=
-0.31
and
-0.25
respectiv
ely).
-Sleep
opportunity
negativ
ely
corr
elated
with
ISI
and
PSQI:
(r
=
–
0.37
and
r
=
–
0.41,
respectiv
ely).
-External
validity
:
Community
sample:
13.36%
(inadequate
sleep
opportunity
and
sleep
envir
onment),
and
37.02%
met
the
criteria
of
insomnia
and
da
ytime
function.
Internal
consistenc
y
:
-Insomnia
symptoms:
α
=0.98
-Da
ytime
function:
α
=0.94
-Sleep
en
vir
onment:
α
=
0.90
-Sleep
opportunity:
α
=0.87
Interpr
etability:
ISS
demonstrated
sensitivity
and
speci
fi
city
of
0.89
and
0.59
respectiv
ely
Cut-off
scores:
-Sum
of
sleep
en
vir
onment
and
opportunity
subscales
scores=
27
-Sum
of
insomnia
symptoms
and
da
ytime
functioning
subscales
scores=42
Kato
T
.,
2013
70
Sleep
Quality
Questionnair
e
(SQQ)
Full-time emplo
yees
and
college
students
Content
validity
:
con
fi
rmed
by
tw
o
Japanese
experts
in
str
ess
re
sear
ch.
Con
verg
ent
validity
:
(n=370)
SQQ
subscales
(Sleep
dif
fi
culty
and
da
ytime
sleepiness)
with
MOS
sleep
scale
(
r
s
=
0.37
and
0.43,
p<
0.001). The
Da
ytime
Sleepiness
subscale
score
with
Epw
orth
Sleepiness
Scale
(ESS)
score
(r
=
0.47,
p
<
0.001). Incremental
validity
:
(n=
346
)
SQQ
subscales
with
the
GHQ-12,
CES-D
Scale,
FSS,
and
SWLS
scor
es
signi
fi
cant
Δ
R
scor
es
(0.403,
0.313,
0.408
and
0.054
respectiv
ely)
with
p<
0.001.
Internal
consistenc
y
:
Da
ytime
sleepiness
subscale:
-Student
sample:
α
=
0.83
-Emplo
yees
sample:
α
=0.84
Sleep
Dif
fi
culty
subscale:
-Students
sample:
α
=0.74
-Emplo
yees
sample:
α
=0.77
Test-retest
(ov
er
8
w
eeks)
Da
ytime
Sleepiness
subscale:
(r
=0.76)
Sleep
Dif
fi
culty
subscale:(r
=0.79)
NR
(
Continued
)
Nature and Science of Sleep downloaded from https://www.dovepress.com/ by 118.70.13.36 on 27-Aug-2020
T
able
1
(Continued).
Author
,
y
ear
Instruments
Sample
V
alidity
Reliability
Responsiveness
and
Interpr
etability
Le
vine
et
al,
2003
(study
a)
36
Le
vine
et
al,
2003
(study
b)
37
W
omen
’
s
Health
Initiative Insomnia
Rating
Scale
(WHIIRS)
P
ostmenopausal women
Content
analysis
:
The
WHIIRS
items
corr
esponded
to
most
of
insomnia
characteristics
noted
in
the
nosologies
(eg
International
Classi
fi
cation
of
Sleep
Disord
ers)
and
the
literature.
Construct
validity
:
-Small
corr
elation
betwe
en
the
CES-D
and
the
WHIIRS:
r
=0.29
-The
WHIIRS
mean
in
the
largest
CES-D
categor
y
(
M
=10.3
for
Categor
y
12)
was
1.8
times
that
in
the
smallest
depr
ession
categor
y
(ie,
M
=5.7
for
Categor
y
0)
-The
SF-36
subscales
w
er
e
linearly
corr
elated
with
the
WHIIRS:
Cohen
’
s
f
value
was
0.273,
(p
<
0.0001). -Fo
r
night
swe
ats
and
hot
fl
ushes
with
WHIIRS,
the
values
of
Cohen
’
s
f
w
er
e,
re
spectiv
ely
,
0.205
and
0.157.
Internal
consistenc
y
:
α
=
0.786.
●
89.3%
of
the
samples
had
reliability
coef
fi
cients
≥
0.75
Test-retest
:
Same
da
y
administration
(r
=0.96)
Tests
after
>1
year
(r
=0.66)
NR
Drak
e
et
al,
2014
38
Restorativ
e
sleep questionnair
e
(RSQ)
Community based
sample
Patients
with
primar
y
insomnia
Non-r
efres
hed
sleepers
(NRS)
Content
validity
:
-K
ey
concepts
dev
eloped
thr
ough
patient
focus
gr
oups
and
patient
inter
vie
ws.
Concepts
rev
ie
w
ed
by
two
expert
panels.
Con
verg
ent/divergent
:
-RSQ-Daily
(RSQ-D)
with
Leeds
Sleep
Evaluation
Questionnair
e
scor
es:
positive
and
signi
fi
cant
corr
elation
with
all
domains
(r
≥
0.40,
p
≤
0.006)
except
for
Getting
to
Sleep
scores
(r
=
0.27;
p=
0.079). -RSQ-D
with
Subjective
Sleep
questionnaire:
Sleep
quality
(r
=
0.59;
p
<
0.001);
TST
(r
=
0.32;
p=
0.036)
-RSQ-D
with
vitality
questionnair
e:
(r
=
0.61;
p
<
0.001)
-RSQ
with
PSG:
Latency
to
persistent
sleep
(r
≥
0.20),
TST
and
sleep
ef
fi
ciency
(r
≥
0.26),
W
ASO
(r
≤
0.020)
and
total
wak
e
time
(r
≤
0.26)
signi
fi
cant
p-value.
Internal
consistenc
y
:
RSQ-D:
α
=
0.91
RSQ-W:
α
=
0.90
Test-retest
(r
esponses
on
consecutiv
e
da
ys
measur
es)
RSQ-D
and
RSQ-W:
r
>0.80
NR
Nature and Science of Sleep downloaded from https://www.dovepress.com/ by 118.70.13.36 on 27-Aug-2020
Buysse et al, 1989 67 Grandner et al, 2006 68 Backhaus et al, 2002 69 Pittsburgh sleep quality index (PSQI) -Gr oup I: health y contr ol subjects
(n=52) -Gr
oup 2: patients with major depr essiv e disor der (n=34). -Gr oup 3: Clinical sample ph ysician-referr ed outpatients at the Sleep
Evaluation Center (n
=
45)
-Non-clinical sample (younger
and
older
adults)
-Primar
y
insomniacs -Health
y contr ols Discriminating between patients and contr ols : -Global PSQI scores differ ed signi fi cantly betw een subject gr oups and contr ol gr oup subjects differ ed fr om all patient gr oups. -Patients with DIMS had signi fi cantly higher scores than patients with DOES patients. A signi fi cant differ ence in PSQI components ’ scor es we re found between the contr ol gr oup and both DIMS and depr essed gr oups. PSQI scores also differ ed on 3 components (sleep disturbances, da ytime dysfunction, and sleep quality) with DOES patients. -A signi fi cant differ ence in all PSQI component scores except sleep disturbance w er e identi fi ed between DOES and DIMS patients. While DOES and depr essed patients differ ed on all components ’ scores except sleep disturbance and da ytime dysfunction. Diagnostic validity : (Buysse et al, 1989) A cutoff score of 5 corr ectly determined the sleep quality for 88.5 of all part icipants (kappa = 0.75, p < 0.001) re por ting a sensitivity of 89.6% and a speci fi city of 86.5%. (Backhaus et al, 2002) -PSQI global score > 5 resulted in a sensitivity of 98.7% and speci fi city of 84.4% Criter ion/concurrent validity : (Buysse et al, 1989) PSQI scores and PSG: -Signi fi cant positiv e corr elation betw een PSG and PSQI only for sleep latency (r =0.33, p <0.001) PSQI global scor e and PSG: -Objectiv e sleep latency (r = 0.20, p< 0.01), w eak corr elation -The global PSQI score corr elated only with REM% in contr ols (r = 0.34, p <0.006) and number of ar ousals in depr essiv es (r = 0.47, p< 0.002). (Backhaus et al, 2002) -PSQI was highly corr elated with sleep log data (r =0.81, p< 0.001 for sleep duration and r =0.71, p= 0.000 for sleep onset latency . -The corr elations betw een PSQI and PSG data was signi fi cant and low er ranging between r = ( − 0.32 to − 0.33). Construct validity : -PSQI scores did not corr elate signi fi cantly with actigraphic measur es of sleep (r ≤ 0.13). PSQI with sleep diar y: (signi fi cant correlation) -Sleep ef fi ciency (r = − 0.562, p< 0.01), TST (r = − 0.307, p< 0.01), W ASO: (r = 0.262, p< 0.01). -Sleep latency: r = 0.480, p <0.01 -CESD: r = 0.305, p <0.01 Internal consistenc y : Ov erall: α = 0.83 (Buysse et al, 1989) Ov erall: α = 0.85 (Backhaus et al, 2002) Test-retest : (Buysse et al, 1989) -T est retest (28 da ys apart): The corr elation betwee n the PSQI scores was r = 0.85 (p <0.001). -Component scores: r = 0.84 – 0.65 (p< 0.001 for each component scor e). Test retest : (Backhaus et al, 2002) Ov erall: (r =0.87, p <0.001) -Short inter val (2 da ys): r =0.90, p=0.00 -Longer inter val (45.6 ± 18 da ys): r =0.86, p <0.001 Interpr etability: Can distinguish between “ good ” and “ poor ” sleepers. The cut-off point is 5.
(
Continued
)
Nature and Science of Sleep downloaded from https://www.dovepress.com/ by 118.70.13.36 on 27-Aug-2020
T
able
1
(Continued).
Author , y ear Instruments Sample V alidity Reliability Responsiveness and Interpr etability Bastien et al, 2001 29 Morin et al, 2011 30Insomnia severity
index (ISI) Study 1: Patients with
insomnia complaint (n=145). Study
2: (n=78) Insomnia patient in volved in a study assessing the ef fi cacy of cognitiv e beha vioral therap y. Morin et al, 2011
●
Community sample (n=
959)
●
Clinical sample (n=183) Criter ion/concurrent validity : ISI items with sleep diar y variables: -Sleep onset latency (r = 0.38), W ASO (r = 0.35) and Early morning awak ening (r =0.35) -T otal ISI score and the sleep ef fi ciency variable (r = -0.19)●
ISI and sleep diar y components r = 0.32 – 0.55 at baseline and r = 0.50 to 0.91 post-therap y (all p values < 0.05).●
ISI variables with PSG variable: Corr elation ranged betwe en r = 0.07 to 0.45 at pr etre atment, and fr om 0.23 to 0.45 at post-trea tment. Only the corr elation for SOL was signi fi cant at pr etr eatment, wher eas all corr elations, but one (EMA) w er e signi fi cant at post-tr eatment (p< 0.05). -T h e co rr e lat io ns b e tw e en the p at ien t’ s an d the clinicia n ’ s ve rs io n s o f th e IS I at th e tw o as ses sm en t p er iod s w er e al ls ign i fi can t (p val u es < 0 .0 1 ). Fu rt h er mo re, th e co rr el at io n s b et w ee n th e pa ti en t ’ sa n d the sig n i fi ca n t oth e r ve rs ions of the IS I w e re al so sig n i fi can t at th e tw o as ses sm en t pe ri o d s (p val u es <0 .0 1) . Pr ed ic ti ve va lid ity : Th e clin icia n ’ s rat in gs p red ic ted b e st the pa ti en t’ s IS I tota l scor e at ba se line , w hile at post-tr e atme n t, bo th the clinicia n an d the sle e p dia ry d ata w e re re lia b le p re d icto rs of th e pa ti e n t ’ s to tal ISI sc o re. R2 = 0 .3 7 (p< 0.05) at p re tre at me nt , clinicia n : (β = 0 .52) R2 = 0 .6 1 (p< 0.05) at p ost -t re at m en t , clinic ia n : ( β = -0 .52 ) Sl e ep di ary: ( β = -0.34) Con te n t va lid ity: A p ri n ci p al co m p on en t an al ys is ,u si n g va ri m ax ro tat io n ,e x pl o red th e IS Ic o nt e nt val id it y an d th e ex ten t to wh ic h it s co m po n en ts co rr es p o nd ed to in so mn ia ’ s d ia gnostic cr ite ri a. D ia gn os tic va lidi ty : M or in et al , 20 1 1 -Sub thr es ho ld in so mn ia : A cutoff scor e of 8 : S e n sitivity of 9 5 .8% an d 9 9.4% in th e Co m munity an d Clinica lsa m p le s re spe ctiv e ly ,a n d w ith spe ci fi city of 78.3% an d 91.8% . -M ode rat e to se ver e in so mn ia : -A cu to ff sc o re o f 15 : Sp ec i fi city of 9 8 .3% an d 1 0 0% in th e Com munity an d Clinica lsa mple s, re sp e ctiv e ly ,w ith a se n sitivity of 4 7. 7 % an d 78 .1 % res p ec ti vel y. -Com munity sa m p le : cut-p oint of 1 0 (86.1% se n sitivity and 87.7% spe ci fi city). -Cl inical sample :cut-point of 1 1 w as as sociate d w ith 97. 2 % sensit ivity and a p erfect 100% sp eci fi city . Con str uct va lid ity (c onver ge nt ) : -Insomnia se verity o n the IS I w as posit iv e ly corr elated w it h the corr e sponding diar y var ia ble . -The ISI tota ls cor e wa s sig ni fi cantl y corr el ated w ith the P SQ I tota ls cor e ,r = 0 .80, p< 0. 0 5 . -S ig n i fi cant re lat ionships w er e found wit h meas ur es of anxiety and de pr essi on ,d iff er e nt dime nsions of fa tigue .Si gni fi cant corr ela tions w e re als o d iscov er ed with the SF -12, with a str onge r associ ation ide nti fi ed with the M ental components of the measur e than w ith the Ph ys ical Healt h component. Study 1: Internal consistency: α = 0.74. Study 2: Internal consistency: The internal reliability coef fi cients did not change signi fi cantly fr om baseline to follow up (0.76 to 0.78, respectiv ely). Morin et al, 2011 Community (Cr onbach α = 0.90) Clinical samples (Cr onbach α = 0.91). Responsiveness: A signi fi cant reduction in ISI score was detected post-tr eatment in patients ’ (8.9 vs 15.4) and clinician ’ s ve rsions (7.7 vs 17.7). ISI sensitivity to detect clinical impro vement (n=146) -Moderate impr ovemen t in insomnia was identi fi ed as a reduction in ISI score by > 7 points (60% sensitivity , 70% speci fi city). -Mark ed/higher impr ov ement in sleep was identi fi ed as a decrease in ISI score by > 8 points (64% sensitivity , 80% speci fi city). Interpr etability: The scores of the ISI represent thefollowing: 0–
7: lack of insomnia, 8 – 14: Subthr eshold insomnia 15 – 21: Moderate insomnia 22 – 28: Se ver e insomnia. Morin et al (2011) suggested clinically signi fi cant insomnia could be identi fi ed by ISI scores >10 in community samples and scores >11 in clinical settings.
Nature and Science of Sleep downloaded from https://www.dovepress.com/ by 118.70.13.36 on 27-Aug-2020
Jenkin
s
et
al,
1988
27
Nassermoaddeli et
al,
2005
73
Jerl
ock
et
al,
2006
72
The
Jenkin
s
Sleep
Scale
(JSS)
-Air
traf
fi
c
contr
ollers
(n=250
men;
25
–
49
years
old)
-Patients recoveri
ng
after
fr
om
cardi
ac
surger
y
(n=500
patients).
Construct
validity
:
Spielberger
’
s
state
anxiety:
r
=0.37
POMS-Depre
ssion:
r
=0.35
POMS-Hostility:
r
=0.29
POMS-Vigor
:
r
=
-0.24
POMS-Fatigue:
r
=
0.46
P
ositiv
e
w
ell-being:
r
=
-0.22
Internal
consistenc
y
:
α
=
0.79
Test-retest
reliability
:
r
=0.59
Nassermoaddeli
et
al,
2005
Internal
consistency:
α
=
0.77
Jerlock
et
al,
2006
Internal
consistency:
α
=
0.80
NR
Soldatos
et
al,
2000
65
Soldatos
et
al,
2001
65
Athens
Insomnia
Scale
(AIS)
299
subjects
Consisting
of:
1-Primar
y
insomniacs
2-Psychiatric
patients
(both
inpatients
and
outpatients) 3-Health
y
subjects
External
validity
:
Sleep
pr
oblems
scale
with:
AIS-8:
r
=
0.90,
p
<0.001
AIS-5:
r
=
0.85,
p
<0.001
Soldatos
et
al,
2001
Diagnostic
validity
:
-AIS
in
general
population,
for
a
Cut-off
score
of
6
only
1%
of
those
respo
nders
with
insomnia
ar
e
misdiagnosed
(ie
NPV=
99%)
and
(PPV=41%).
-Psychiatric
population:
8%
(NPV=92%)
and
(PPV=86%).
-A
total
score
of
6
or
higher
in
the
AIS
was
shown
to
corr
ectly
identify
90%
of
the
study
subjects
as
suffering
or
not
fr
om
“
nonorganic
insomnia
”
according
to
ICD-10.
-the
AIS
in
overall
case
identi
fi
cation
corr
esponded
to
high
indices
of
both
sensitivity
(93%)
and
speci
fi
city
(85%).
Internal
consistenc
y
:
AIS-8:
α
=
0.89,
AIS-5:
α
=0.87
Test
retest
(n=194;
within
one
w
eek):
AIS-8:
r
=
0.89,
p<0.001
AIS-5:
r
=
0.88,
p<0.001
Interpr
etability:
Cut-off
score
of
6
General
population
(NPV=
99%,
PPV=41%) Psychiatric
population
(NPV=92%,
PPV=86%)
with
sensitivity
(93%)
and
speci
fi
city
(85%).
-A
total
score
of
6
or
higher
in
the
AIS
was
shown
to
corr
ectly
identify
90%
of
the
subjects
’
sleep
quality
.
Br
oman
et
al,
2008
25
W
estergren
et
al,
2015
26
Minimal Insomnia Symptom
Scale
(MISS)
Subjects
selected
randomly (n=1379) Age
range:
20
–
64
(Sw
eden).
Criter
ion
validity
:
The
corr
elation
between
BNSQ
question
about
sleep
quality
and
MISS
total
scor
e
was
high
with
r
=0.76. W
estergren
et
al,
2015
The
differ
ence
between
the
adult
and
elderly
samples
was
lower
for
the
originally
recom
mended
≥
6
points
cut-off
(0.09
logits).
Internal
consistenc
y
:
Total:
α
=0.73
Test
retest
reliability
:
(6
months
apart)
High
corr
elation
was
found
with
an
ICC
of
0.79.
Responsiveness: Sensitivity
to
change
Paired
t
tests
re
vealed
that
there
was
a
str
ong
tr
end
for
incr
ease
in
score
in
subjects
who
deteriorated
(m=+0.80;
t=2.0;
p=0.053). There
was
also
a
signi
fi
cant
decrease
in
MISS
scores
among
subjects
who
impr
ov
ed
(m
=
−
1.06;
t
=2.9;
p<
0.01).
Interpr
etability:
A
cut-off
score
of
≥
6
on
the
MISS
identify
insomniacs
in
the
general
adult
population
(sensitivity
0.82;
speci
fi
city
0.86),
PPV
0.44;
NPV
0.97.
(
Continued
)
Nature and Science of Sleep downloaded from https://www.dovepress.com/ by 118.70.13.36 on 27-Aug-2020
T
able
1
(Continued).
Author , y ear Instruments Sample V alidity Reliability Responsiveness and Interpr etability Espie et al, 2014 64 Sleep Condition Indicator (SCI) Samples fr om 5 validation studies: -The Gr eat British Sleep Sur ve y (GBSS): adults > 18 -The GBSS+ -TV sample -Glasgow Science Centr e data(n=256) -A
randomized contr olled trial (RCT) sample (n=164) recruited into a placebo- contr olled ev aluation of CBT Content validation :
●
The DSM-5 was used to de velop the questionnair e, consultations w er e conducted, and a draft was published on the American psychiatric association w ebsite. Concurrent/criter ion validity :●
SCI was negatively associated with the score of sleep quality questionnaires including PSQI (r = − 0.734) and the ISI (r = − 0.793).●
Sleep condition was signi fi cantly associated with ph ysical and mental health (r =0.222 and r =0.335 respectiv ely).●
Using the HADS scale, SCI was negative ly corr elated with symptoms of depr ession (r = − 0.426) and anxiety (r = − 0.400). But was higher than the associated detected in the RCT sample study (depr ession (r = − 0.267), anxiety (r = − 0.236) and str ess (r = − 0.263)). Concurrent and diagnostic validity :●
A cut-off score ≤ 16 was diagnostic for 89% of individuals who w er e identi fi ed as insomniacs on the ISI scale (scor es of ≥ 15), with a capacity of corre ctly classifying 82% of non-insomniacs.●
These fi ndings support the concurr ent validity for the SCI and con fi rming that a score of ≤ 16 on the SCI could identify insomniac patients. Internal consistenc y :●
Cr onbach ’ s α = 0.857 (the GBSS●
(range of α -if-item-deleted 0.822 – 0.860).●
GBSS+ sample●
( α =0 .86 5). Th e me an co rre cte d ite m-tot al cor rel ati on wa s mo der ate (r =0 .62 0) . Interpr etability: A cut-off ≤ 16, was able to identify 89% of patients who had insomnia (ISI scores of ≥ 15). How ev er , an SCI score of >16 was able to exclude 82% of individuals without insomnia Lee, 1992 41 Lee, 2007 42 General Sleep Disturbance Scale (GSDS) Fem ale nurses in differ ent shifts (permanent da y shift, permanent night shift and rotating shifts) N=760 Paren ts of hospitalized infants in the intensiv e car e unit n=44 Lee, 2007 Content validity : Evaluated by multidisciplinar y rev ie w ers. Criter ion/concurrent validity : 1 -Sleep diar y: Fo r both the Chinese and English versions, higher GSDS scores w er e corr elated with self-r eported lower sleep quality in sleep logs (r = 0.41), higher morning fatigue le vels (Chinese version: r = 0.42, p= 0.05; English version: r = 0.56, p = 0.006). 2-Wrist actigraph y: less sleep ef fi ciency (Chinese version: r = -0.26; English version: r = -0.42). Criter ion/predictive validity : The participants ’ GSDS mean scores w er e positiv ely corr elated with their morning fatigue le vels (Chinese version, r = 0.42, p = 0.05; English version, r = 0.56, p = 0.006), supporting the pr edictiv e validity of the GSDS. Lee, 1992 Internal consistenc y : -Ov erall: α = 0.88 -Subscales of quality of sleep , da ytime sleepiness, and use of sleep aids w er e 0.62, 0.79, and 0.82, re spectiv ely . Lee, 2007 Internal consistencies : Ov erall: Chinese version ( α = 0.81) English version ( α = 0.85) NRNature and Science of Sleep downloaded from https://www.dovepress.com/ by 118.70.13.36 on 27-Aug-2020
Fung
et
al,
2014
41
Daily
Cognitiv
e
Communication and
Sleep
Pr
o
fi
le
(DCC
ASP)
Univer
sity
students
’
univ
ersity
of
T
or
onto
(n=59).
Criter
ion
validity
:
DCC
ASP
and
PSQI:
-Adequate
criterion
validity
for
the
Sleep
Quality
domain
of
the
DCC
ASP
was
established
by
comparing
it
to
the
Sleep
Quality
domain
of
the
PSQI,
with
rs
=
0.398
(p<
0.001).
-P
ositiv
e
corr
elation
betw
een
sleep
quality
and
each
of
the
DCCA
SP
domains:
rs
(0.38
–
0.55)
(p<0.0001).
-Internal
consistenc
y
:
Cr
onbach
’
s
α
ranged
betw
een
0.864
and
0.938
acr
oss
the
se
ven
domains
of
the
DCCA
SP
.
-Test-retest
(r
epeated
after
2
w
eeks)
Concor
dance
Corr
elation
Coef
fi
cient
(CCC)
of
each
domain
of
the
DCC
ASP
was
moderate,
ranging
fr
om
r
=
0.548
to
0.742.
NR
Abdel-khalek, 2008
35
The
Arabic
Scale
of
insomnia
(ASI)
Students
and
emplo
yees
Content
validity
:
The
initial
draft
of
the
ASI
was
rev
ie
w
ed
by
PhD
holding
faculty
members
and
master
students. Construct
:
Conv
ergent
validity:
AIS
was
signi
fi
cantly
corr
elated
with
Arabic
sleep
disor
ders
scale
and
Jenkins
sleep
scale
a
corr
elation
range
of
(r=
0.56
–
0.94,
p<0.001).
Internal
consistenc
y
:
α
=
0.84
–
0.87
Test-retest
reliability
(1
w
eek
apart):
α
=
0.70
–
0.83
NR
Morr
one
et
al,
2017
52
Maugeri
Sleep
Quality
and
Distress Inv
entory
(MaSQuDI-17)
Outpatients evaluated
for
sleep
disorders
in
sleep
centers
of
Northern
Italy
Con
verg
ent
validity
and
discriminant
:(p
<0.001
for
all)
r2
=
0.5
with
the
PSQI
r2
=
0.15
with
ESS
r2
=
0.39
with
anxiety
as
measur
ed
by
A-D
schedule
r2
=
0.52
with
depr
ession
as
measur
ed
by
A-D
schedule
-Discriminating
capacity
:
The
differ
ence
in
mean
scor
e
between
the
health
y
gr
oup
and
patients
(9.31
and
14.15
respect
iv
ely)
was
statistically
signi
fi
cant
(p<
0.001).
-Differen
ces
w
er
e
consistent
with
the
type
of
pathological
condition
pre
sent
(normal
subject
vs
OSAS
or
INS
or
BSD
gr
oup
of
subjects
p
<
0.001).
Internal
consistenc
y
:
α
=
0.896
NR
(
Continued
)
Nature and Science of Sleep downloaded from https://www.dovepress.com/ by 118.70.13.36 on 27-Aug-2020
T
able
1
(Continued).
Author , y ear Instruments Sample V alidity Reliability Responsiveness and Interpr etability Joh ns M., 1991 44 Joh ns M., 1992 45 Joh ns M., 1994 46 Epw orth Sleepiness scale (ESS) -Contr ol (n=30) -Individuals with sleep disorders (n=150) -Thir d year medical students (n=104) -OSA patients tr eated with CP AP -Patients who had MSL T (n=44) -Spouses of participants who completed ESS (n=50) Discriminating capacity : -Signi fi cant differe nces in ESS scores between the se ven diagnostic gr oups wer e detected (F= 50.00; df= 6,173; p< 0.0001). -Scor es for OSA, nar colepsy and idiopathic h ypersomnia w er e signi fi cantly higher than for contr ols (p <0.001) or primar y snor ers (p< 0.001). -The insomniacs had signi fi cantly low er scores (p< 0.01) than all gr oups except contr ols. -Criter ion validity : ESS (total score) with MSL T : -Mean Sleep latency (SL): (rho = − 0.42, p< 0.01). [Signi fi cant negativ e corr elation] -When the corr elation betwee n mean SL with ESS individual item scores was assessed only 3 items w ere signi fi cantly corr elated (p <0.05) which w ere :●
The lik elihood of dosing off “ when sitting, inactiv e in a public place ” (rho= − 0.44), when “ sitting quietly after lunch without alcohol ” (rho= − 0.34) and when “ in a car , stopped for a fe w minutes in the traf fi c ” (rho= − 0.41). Predictive validity : -All eight item score s as pred ictors of the mean SL in the MSL T w er e statistically signi fi cant (r = 0.639, p = 0.01). -Items 3 (r = − 0.44, p <0.01) and 8 (r = − 0.41, p= 0.01) w er e signi fi cant independent pred ictors. Internal consistenc y : α = 0.88 (patients) α = 0.73 (students) Test-retest reliability : (5 months apart) -F or 87 students: r = 0.822 (p< 0.001). -Patient-Spouse paired item corr elation: (mean rho = 0.57, p< 0.001). -The pair ed (patient-Spouse) total ESS scor es corr elation (high) (rho = 0.74, n = 50, p< 0.001). Responsiveness: After 3 months of tr eatment with CP AP . T reatment with nasal CP AP in 54 individuals with OSAS was associated with a change in ESS scores by 7.0 ± 5.2 (SD) following therap y, which was statistically signi fi cant (t = − 9 .59, df = 53, p< 0.001). Ak erstedt et al, 1990 24 Re yner , et al, 1998 47 Kar olinska sleepiness scale (KSS) 8 male subjects Criter ion validity : KSS with V AS: -The maximum score on the KSS scale corr esponds with the verbal anchor “ extrem ely sleep y, fi ghting sleep ,” while the minimum value corr esponds with the rating “ alert. ” -The association between subjectiv e sleepiness and the EEG/EOG variables was signi fi cant: (r =0.29 – 0.65, p<0.05). -Signi fi cant differ ences in various le vels of subjective sleepiness w er e identi fi ed for all variables, except theta activity-during the test conducted under ambulator y conditions. A signi fi cant differ ence between maximum and minimum sleepiness was detected (Wilcoxon , z > 2.20, p<0.05). -No changes w er e identi fi ed in the EEG/EOG befor e le vel 7 was re ached on the KSS scale. Fo r the test session with closed ey es, a signi fi cant variation was identi fi ed only with slow rolling ey e movem ent (x2 = 13.6, p<0.01). -Increasin g KSS le vels w er e highly signi fi cantly corr elated with an incr eased lik elihood of falling asleep (P earson ’ s r = 0.78; d = 1043; p= 0.001). NR NRNature and Science of Sleep downloaded from https://www.dovepress.com/ by 118.70.13.36 on 27-Aug-2020
W ea ver et al, 1997 74 W ea ver et al, 2009 28 Functional outcomes of sleep questionnair e (FOSQ) FOSQ-30 : Sample 1 (n = 153) Health y individuals presen ting with sleep complaint Samples 2 (n = 24) and 3 (n = 51): Patients with OSA FOSQ-10 : Sample 1: (n=155) Participants with moderate to se ver e OSA on CP AP Sample 2: (n = 51) CP AP-treated OSA patients Normal subjects FOSQ-30: Face validity : Se ven judges with expertise in the ar eas of functional status instrument de velopment and sleep pr oblems rated the clinical relev ance of each item and the instrument to DOES. Content validity : Determined by the pr oportion of items receiving a rating of at least three or four acr oss all judges. Construct validity : -Subscale-to-subscale corr elations range: r = 0.52 – 0.86 -Subscale-to-global FOSQ score inter corr elations ranged fr om r = 0.78 – 0.86. Concurrent/criter ion validity : -FOSQ-30 global score with SIP total score (n=24): (r = − 0.50, p ≤ 0.05) -FOSQ-30 global with SF-36 sub-scales (n=51): no signi fi cant corr elation -FOSQ-30 global score with SF36 role emotional functioning subscale (r =0.46, p ≤ 0.01) -FOSQ activity le vel subscale signi fi cantly corr elated with SF36 ph ysical functioning subscale. -The FOSQ social outcome subscale was signi fi cantly corr elated with the SF-36 social function subscale (r =0.36, p ≤ 0.05) and SF36 mental health subscale (r =0.38, p ≤ 0.01). -Discriminant validity : -Mean of FOSQ global score discriminated between normal sleepers and those with sleeping pr oblems: (68.05 ± 21.24 and 89.59 ± 8.64 respectiv ely with p= 0.0004) (T157 = − 5.88, p= 0.0001). FOSQ-10: Criter ion validity : Global scor es comparison: -Before treatm ent with CP AP the FOSQ-10 global score was robustly associated with the FOSQ-30 T otal score (r = 0.96, p< 0.0001). -The corr elation between the post-treatmen t total scores of FOSQ-10 and the FOSQ-30 was r =0.97 (p< 0.0001). Know n gro up validity : -Baseline total score on the FOSQ-10 for the OSA gr oup (mean = 12.48 ± 3.23) statistically differ ed ( t = 8.65, p< 0.0001) fr om the normal values (mean = 17.81 ± 3.10). FOSQ-30: Internal consistenc y( n=153): -T otal: α = 0.95 -Subscales (α = 0.86 to α = 0.91) -Item to total corr elation range: 0.35 – 0.73 Test retest reliability (n=32): (Within 1 w eek) -Global score: r = 0.90 -Individual subscales ranged fr om r = 0.81 to r = 0.90 FOSQ-10: Internal consistenc y : α = 0.87 Responsiveness: Fo llowing CP AP treatm ent, both the FOSQ-30 and the FOSQ-10 detected a large clinically meaningful change in the total score (p< 0.0001). Da vid, 2008 50 Occupational impact of sleep questionnair e (OISQ) Community sample of 86 participants (age: 25 – 50 years)
●
43 meeting DSM IV cri-teria for pri-mar y insomnia (26 w omen & 17 men)●
43 contr ols Criter ion : -At each time point OISQ scores positiv ely corr elate with PSQI (mean r = 0.59, p<0.001). -Sleep diar y variable: W ork assessment scores negatively corr elated with mean TST (r = − 0.47, p<0.001) and mean SE (r = − 0.56, p<0.001), and signi fi cantly and positiv ely with mean W ASO (r =0.66, p<0.001). -Signi fi cant negative corr elation with SF-36 subscales ranging fr om r =-0.21 to − 0.62, p< 0.001. Internal consistenc y : α = 0.93 Test-retest : A mean differ ence of 10.82 betw een gr oups was found resulting in a signi fi cant main gr oup effect (F = 12.52, p< 0.001). A consistent decrease of 10% is seen in insomniacs compared to contr ol. NR(
Continued
)
Nature and Science of Sleep downloaded from https://www.dovepress.com/ by 118.70.13.36 on 27-Aug-2020
T
able
1
(Continued).
Author
,
y
ear
Instruments
Sample
V
alidity
Reliability
Responsiveness
and
Interpr
etability
Bell
et
al,
2011
31
The
Sleep
Functional Impact
Scale
(SFIS)
Primar
y
insomniacs Health
y
volunteers
Content
validity
:
W
as
assessed
though
face
to
face
inter
vie
ws
with
patients.
Con
verg
ent/divergent
validity
:
(p
<0.001)
-SFIS
with
ISI
composite
score:
(r
=0.82),
SFIS
with
PSQI
composite:
(r
=0.78),
SFIS
with
FOSQ
composite:
(r
=
−
0.69),
SFIS
with
ESS
total:
(r
=0.46),
SFIS
with
MOS-sleep
pr
oblems
indices
(I
and
II):
(r
≥
0.74),
SFIS
with
MOS
bre
athing
and
Snoring
subscales:
(r
=0.26
and
0.27
respectiv
ely)
and
with
WP
AI
–
GH
Subscales
(r
≥
0.31).
Know
n
gro
up
validity
(n=430):
-Higher
SFIS
score
in
the
insomnia
gr
oup
compar
ed
to
contr
ol
(t=19.36,
p<
0.0001),
effect
size=2.05
-Lower
SFIS
scores
for
those
reporting
good
sleep
compar
ed
not
reporting
good
sleep
.
(t
=
−
12.18,
p<
0.001)
(effect
size
=
−
1.04).
-Higher
SFIS
score
for
parti
cipants
reporting
wor
se
sleep
quality
on
PSQI
(t
=17.06,
p<
0.0001)
(effect
size
=
2.33).
Internal
consistenc
y
:
All
the
sample:
α
=
0.97
Insomniacs=
α
=
0.95
NR
Espie
et
al,
2000
51
Sleep Disturbance Questionnair
e
(SDQ)
Chr
onic
insomniacs
The
factors
score
of
SDQ
corr
elated
with
the
SDQ
total
(0.31
to
0.88).
Internal
consistenc
y
:
α
=
0.67
NR
Regestein
et
al,
1993
49
Pa
vlova
et
al,
2001
47
Hyperar
ousal
Scale
(H-scale)
-Primar
y
insomnia
patients
-Hypersomnia -Dela
yed
sleep
syndr
ome
-Normal
subjects
-Patients
with
refractor
y
insomnia
Criter
ion
validity
:
-H-Scale
with
neur
oticism
scale
and
extr
ove
rsion-intr
oversi
on
scale:
no
signi
fi
cant
corr
elation
-Higher
EEG
activity
in
insomniacs
compar
ed
to
normal
subjects
(p
<0.05).
-Signi
fi
cant
corr
elation
betwee
n
h
yperar
ousal
score
with
alpha
and
non-alpha
EEG
activity:
(r
≥
0.38,
p
≤
0.03).
Discriminating
capacity:
(
Pa
vlovaa
et
al,
2001)
-The
insomnia
gr
oup
had
a
mean
Hyperar
ousal
total
scor
e
signi
fi
cantly
higher
than
the
normal
gr
oup
(F
=
20.7;
p
<0.001).
NR
NR
Nature and Science of Sleep downloaded from https://www.dovepress.com/ by 118.70.13.36 on 27-Aug-2020
Espie et al, 2000 51 Edinger et al, 2001 58 Chung et al, 2016 59 Dysfunctional Beliefs and Attitudes about Sleep Scale (DBAS) Chr onic insomniacs Normal subjects Insomniacs Individuals with insomnia deriv ed for a randomized contr olled trial of self-help CBT -I. Construct validity : -DBAS 10 with DBAS-30: good corr elation (r =0.826). -T otal score: DBAS-10 and SDQ (r = 0.28) Construct/converg ent validity : Edinger et al, 2001 -DBAS with DBAS-10: Normal sleepers: r =0.84, Insomniacs: r ≥ 0.80 Discriminative validity : Insomniac subjects had signi fi cantly higher scores on the full-length DB AS scale (F (1, 136) = 28.2, p< 0:0001) with mean of (mean DBAS 35.5, SD 10.5) as compar ed to normal sleepers (mean DBAS 26.4, SD 9.7). -DBAS-10 scores of our insomnia suffer ers (mean DBAS-10 43.3, SD 15.0) wer e signi fi cantly (F (1,136) = 15.9, p< 0:0001) higher than those shown by our normal sleepers (mean DBAS-10= 33.5, SD 14.0). Criter ion/concurrent validity : Chung et al, 2016
●
DBAS total scor e signi fi cantly corr elated with se veral subscale scores of the ISI, PSQI total scor es and HADS-anxiety and HADS-depr ession subscale scores.●
The DBAS-10 “ immediate consequences ” subscale had signi fi cant corre lation with ISI and HADS-anxiety subscale but was not related to HADS-depr ession subscale. The DBAS-30 and DBAS-16 “ sleep expectation ” subscales w er e only signi fi cantly corr elated with ISI total score. DBAS 30: Internal consistenc y : -Ov erall: α = 0.72 -Only tw o subscales achie ved signi fi cance: 1) “ misattributions or ampli fi cations of the consequences of insomnia ” ; α = 0.77 2)Subscale 4: “ diminished per ceptions of contr ol and pred ictability of sleep; ” α =0.41. DBAS-10: -Internal
consistenc y : α = 0.69 -Internal consistenc y for factors I and II w er e 0.73 and 0.60. Edinger et al, 2001 Internal consistenc y : DBAS 30: Normal subjects: α = 0.81 Insomniacs; α ≥ 0.71 DBAS-10: Normal subjects: α = 0.70, Insomniacs: α ≥ 0.53 Chung et al, 2016 Internal consistenc y : DBAS-30, DBAS-16, and DBAS-10 with Cr onbach α of 0.81, 0.80, and 0.73, respectiv ely . Responsiveness: -Changes in DBAS scor e following trea tment we re statistically comparable (F (2,68) = 2.33, p< 0.10) for all three tr eatment gr oups CBT , relaxation training (R T) or placebo contr ol (PC). -DBAS-10 changes did differ statistically acr oss the three trea tment gr oups (F (2, 68) = 4.69, p< 0.025). -P ost hoc comparisons, show ed that the CBT -tr eated insomniacs show ed signi fi cantly gr eater decreases on the DBAS-10. -Signi fi cantly gr eater reduction in DBAS score s was found in participants allocated to CBT -I, except the DBAS-30 “ attributions ” subscale and DBAS-16 “ medication ” -Impr ov ement in ISI scor es by ≥ 8 points was associated with signi fi cant changes in DBAS total scores and on DBAS-30 and DBAS-10 subscale scores. Kallestad et al, 2010 5 8
Insomnia daytime
wor ry scale (ID WS) Undergraduate students and senior high school students (Norwa y) Predictive validity : The ID WS pred icted insomnia se verity ov er and abov e the other variables, accounting for an additional 12% of the variance. -In ID WS factor 1 (lack of energy) and ID WS factor 2 (danger) both pred icted insomnia se verity . The internal consistenc y : Total scale α =0.93 lack of energy subscale: α = 0.94 Danger subscale: α =0.75. NR