ARTICLE
Uptake of Varicella Vaccination Among Young
Children in the United States: A Success Story in
Eliminating Racial and Ethnic Disparities
Elizabeth T. Luman, PhD, Pamela L. Y. H. Ching, SD, Aisha O. Jumaan, PhD, Jane F. Seward, MBBS, MPH
National Immunization Program, Centers for Disease Control and Prevention, Atlanta, Georgia
The authors have indicated they have no financial relationships relevant to this article to disclose.
ABSTRACT
OBJECTIVE.To examine uptake of varicella vaccine, a live attenuated vaccine licensed in 1995 and recommended in 1996 for routine vaccination of US children 12 to 18 months of age.
METHODS.Data were for 178 616 children (19 –35 months of age) and were collected in the 1997 to 2004 National Immunization Survey. The main outcome measures were estimated varicella vaccine coverage from 1997 to 2004, coverage among susceptible children (ie, those without a history of varicella disease), racial/ethnic disparities, risk factors for nonvaccination, missed opportunities to vaccinate si-multaneously with other recommended vaccines, and projected increases in cov-erage after elimination of missed opportunities for simultaneous vaccination.
RESULTS.Varicella vaccine coverage rates increased from 26% in 1997 to 87% in 2004. State-specific coverage rates increased 44 to 80 percentage points and were
⬎80% in 42 states and⬎90% in 13 states by 2004. Coverage among susceptible
children increased from 62% in 1999 to 88% in 2004. From 1998 onward, no statistically significant differences in coverage were found between white and black children, whereas Hispanic children had higher coverage rates than white children in 1998 to 2001 and 2004. Risk factors for undervaccination included
living in the Midwest region, living in a household with ⬎1 child, living in
nonmetropolitan areas, living below the poverty level, having a mother who did not have a college degree, and having public providers. If missed opportunities for simultaneous vaccination had been eliminated, then coverage rates would have increased from 58% to 94% in 1999 and from 87% to 96% in 2004.
CONCLUSIONS.Uptake of varicella vaccine has been steady and is an example of successful elimination of racial and ethnic disparities. Additional focus should be placed on reducing missed opportunities for simultaneous vaccination, improving coverage in rural areas and the Midwest region, and closing remaining gaps related to maternal education, provider type, and multiple-children households.
www.pediatrics.org/cgi/doi/10.1542/ peds.2005-1201
doi:10.1542/peds.2005-1201
Dr Jumaan’s current address is: Agency for Toxic Substances and Disease Registry, Atlanta, GA 30333.
Key Words
varicella vaccine, racial disparities, vaccination coverage, immunization
Abbreviations
CDC—Centers for Disease Control and Prevention
NIS—National Immunization Survey MSA—metropolitan statistical area MMR—measles-mumps-rubella Hib—Haemophilus influenzaetype b DTaP— diphtheria-tetanus-acellular pertussis
VFC—Vaccines for Children
SCHIP—State Children’s Health Insurance Program
Accepted for publication Aug 19, 2005
Address correspondence to Elizabeth T. Luman, PhD, National Immunization Program, Centers for Disease Control and Prevention, 1600 Clifton Rd NE, MS E62, Atlanta, GA 30333. E-mail: ELC7@cdc.gov
B
EFORE THE AVAILABILITY of vaccine, almost every-one developed varicella disease (ie, chickenpox)during their lifetimes, with ⬃4 million cases occurring
annually in the United States and leading to an esti-mated 11 000 to 13 500 hospitalizations and 100 to 150
deaths per year.1–5 A live attenuated varicella vaccine
was licensed in March 1995 and was made available to private providers in May 1995. It became available to the public sector in May 1996; in July 1996, it was recom-mended for routine vaccination of US children 12 to 18 months of age (1 dose) and for susceptible older
chil-dren, adolescents, and adults6,7by the Advisory
Commit-tee for Immunization Practices. The United States was the first country to implement a universal vaccination
program for childhood varicella. By 2004, ⬎40 million
doses of varicella vaccine had been distributed in the United States (Centers for Disease Control and Preven-tion [CDC], unpublished data, 2004), and disease inci-dence, hospitalizations, and deaths had decreased dra-matically.4,5,8,9
Increasing varicella vaccination coverage to⬎90% is
a national Healthy People 2010 goal, and eliminating racial/ethnic health disparities is an overarching
objec-tive.10In the United States, varicella vaccination
cover-age among children 19 to 35 months of cover-age has been measured since 1997 through the National
Immuniza-tion Survey (NIS) and reported annually by the CDC.11
In this study, we evaluate the uptake of varicella vaccine from 1997 through 2004, estimate vaccine coverage af-ter adjustment for history of varicella disease, examine racial/ethnic disparities in coverage, determine risk fac-tors associated with lack of vaccination, and assess missed opportunities to vaccinate simultaneously with other recommended vaccines. We also project increases in vaccination coverage that could result from elimina-tion of missed opportunities for simultaneous vaccina-tion.
METHODS
NIS
The NIS has been conducted by the CDC since 1994, to estimate state- and national-level vaccination coverage rates for children between the ages of 19 and 35 months. The NIS is a random-digit-dialing telephone survey of households with age-eligible children, followed by a mail survey of the children’s vaccination providers to
validate immunization information.12
Beginning in 1997, varicella vaccination coverage has been estimated by the NIS. The current study was based on data collected from 1997 to 2004, during which
pe-riod ⬎30 000 household interviews were completed
each year (89 –94% of households identified with age-eligible children). Analysis was restricted to children whose immunization history was verified by their health care providers (65–71%). In total, we analyzed data for
178 616 children (21 310 –23 642 children per year). These data are weighted to account for nonresponding households and vaccination providers, as well as lower vaccination coverage among children in households without telephones, to ensure that estimations of cov-erage are representative of all children 19 to 35 months
of age for each of the 8 survey years.12,13
Outcomes Measured
The primary outcome for this study was valid varicella vaccination coverage, defined as receipt of varicella vac-cine at or after 12 months of age. We assessed annual coverage rates for the nation and for each census region and state (including the District of Columbia). In addi-tion, we examined the percentage of children who re-ceived varicella vaccine on time, as recommended by the Advisory Committee on Immunization Practices (ie,
12–18 months of age).14
In addition to vaccination, children can acquire im-munity to varicella through occurrence of disease and
thus are not required to receive vaccine.7Beginning in
1999, respondents were queried regarding the occur-rence of varicella disease among their children. For 1999 to 2004, we evaluated vaccination coverage among sus-ceptible children by excluding children with reported disease.
Some children in the 1997 and 1998 NIS were born
before July 1995 and thus were ⱖ12 months of age
when the recommendation to vaccinate all children 12 to 18 months of age was published. Because those chil-dren had less opportunity to be vaccinated than did
those who were ⬍12 months of age at the time of the
recommendation, we also evaluated coverage rates ex-cluding them.
To identify risk factors associated with undervaccina-tion or slow vaccine uptake, we evaluated vaccine cov-erage according to various characteristics of the child, household, and immunization providers. In the house-hold portion of the survey, parents or caregivers re-ported race/ethnicity of the child (Hispanic, non-His-panic black or white, or mixed/other) and maternal education level. Poverty status was determined on the basis of household size, composition, and income re-ported by the survey respondents, as defined by the US
Census Bureau.15 Urbanicity (metropolitan statistical
area [MSA] central city, MSA central city, or non-MSA) was determined on the basis of respondents’ tele-phone area code/exchange. Provider facility type (pub-lic, private, or other/mixed) was reported by the providers.
ad-ministration of several other vaccines overlap that of varicella, including measles-mumps-rubella (MMR) vac-cine at 12 to 15 months of age, the third dose of polio-virus vaccine at 6 to 18 months of age, the fourth dose of diphtheria-tetanus-acellular pertussis (DTaP) vaccine at
15 to 18 months of age, and the booster dose of
Hae-mophilus influenzae type b (Hib) vaccine at 12 to 15
months of age.14 For children who had not received
varicella vaccine, we calculated the proportion who had
received another vaccine atⱖ12 months of age, which
we defined as a missed opportunity for simultaneous vaccination. Finally, we projected improvements in vari-cella vaccination coverage levels that would be achieved if these missed opportunities for simultaneous vaccina-tion were eliminated.
Statistical Analyses
Percentage estimates, odds ratios, adjusted odds ratios, and 95% confidence intervals were calculated with
SUDAAN software, version 8.0.16Bivariate analyses and
factor-level2tests were conducted to assess risk factors
for lack of varicella vaccination. Multivariate logistic re-gression analysis was used to evaluate the effect of race/ ethnicity before and after controlling for other demo-graphic factors (poverty status, maternal education level, type of vaccination provider, number of children in the household, and urbanicity). The level of significance was set a priori at .05. All analyses were weighted and
ac-counted for the complex sampling design of the NIS.12
RESULTS
Vaccine Uptake
Varicella vaccine coverage rates increased significantly during the study period, from an estimated 26% in 1997 to 87% in 2004 (Fig 1). On-time vaccination rates in-creased from 18% in 1997 to 82% in 2004. The Midwest had the lowest coverage in each year of the study period, ie, 2 to 17 percentage points below rates for other census
regions (P⬍.01) (Table 1). Initial uptake varied widely
by state, from 3% in South Dakota to 40% in Maryland and Pennsylvania in 1997 (median: 23%) (Table 1). By 2004, coverage rates had increased 44 to 80 percentage points in each state, reaching 70% in Wyoming to 94% in Arkansas (median: 86%). In 2004, varicella vaccine
coverage rates were⬎80% in 42 states and⬎90% in 13
states.
Rates of reported history of varicella disease among children 19 to 35 months of age decreased steadily, from 10% in 1999 to 3% in 2004. Vaccine coverage rates among susceptible children increased from 62% in 1999 to 88% in 2004 (Fig 1). Susceptible children had higher vaccine coverage rates than all children; this difference decreased from 5 percentage points in 1999 to 1 percent-age point in 2004.
In the 1997 and 1998 NIS, 7373 (31%) and 98 (⬍1%)
of the sampled children, respectively, were born before
July 1995 and thus wereⱖ12 months of age at the time
routine varicella vaccination was recommended offi-cially by the Advisory Committee on Immunization Practices. When these children were excluded from the analysis, coverage rates increased from 26% to 29% in 1997 but remained unchanged (43%) in 1998.
Racial/Ethnic Disparities and Other Risk Factors
After lower uptake the first year among Hispanic and black children, coverage rates increased substantially for both of these groups (Fig 2). From 1998 onward, there were no statistically significant differences in coverage rates between white and black children, whereas His-panic children had significantly higher coverage rates than white children in 1998 to 2001 and 2004 (Figs 2 and 3). After controlling for poverty status, maternal education level, type of vaccination provider, number of children in the household, and urbanicity, initial uptake values were statistically equivalent between white and
black children (adjusted odds ratio: 0.9; P ⫽ .3), and
FIGURE 1
Uptake of varicella vaccine among all children in the United States 19 to 35 months of age and susceptible children, ie, children 19 to 35 months of age without a reported history of varicella disease. The estimated percentages of children receiving varicella vaccina-tion atⱖ12 months of age are shown (data from the NIS, 1997– 2004).aInformation regarding varicella disease history was not
TABLE 1 Rates of Varicella Vaccination Coverage (Receipt of Varicella Vaccine at>12 Months of Age) According to State and Census Region in
the NIS, 1997 to 2004
Coverage Rate, Mean (SD), %
1997 1998 1999 2000 2001 2002 2003 2004
Alabama 26.5 (4.9) 52.5 (5.5) 71.3 (5.0) 75.5 (4.7) 88.1 (3.3) 89.3 (3.8) 91.3 (3.7) 89.9 (4.7)
Alaska 11.9 (4.1) 13.4 (4.0) 29.9 (5.3) 47.4 (6.3) 60.7 (6.1) 63.6 (6.5) 81.1 (5.1) 76.5 (6.5)
Arizona 27.4 (4.2) 46.4 (5.0) 59.3 (4.7) 65.2 (4.4) 74.2 (3.9) 78.6 (3.9) 81.5 (3.7) 85.8 (3.4)
Arkansas 15.5 (4.2) 27.9 (5.3) 58.0 (6.4) 77.2 (5.2) 83.0 (4.1) 88.7 (4.1) 88.3 (5.0) 94.0 (2.9)
California 33.4 (4.0) 55.2 (4.2) 69.8 (3.8) 75.4 (3.4) 82.9 (3.2) 85.1 (3.2) 89.7 (2.8) 90.2 (2.4)
Colorado 19.2 (4.7) 39.3 (6.3) 52.9 (6.0) 59.5 (5.7) 78.2 (4.6) 79.8 (5.5) 78.9 (5.6) 86.1 (4.6)
Connecticut 26.5 (5.3) 45.4 (6.3) 62.7 (6.0) 76.2 (5.3) 83.9 (5.0) 86.5 (4.6) 93.2 (3.2) 92.7 (4.1)
Delaware 28.7 (5.9) 45.6 (6.3) 61.4 (6.0) 69.0 (5.7) 80.5 (4.9) 86.0 (4.2) 81.5 (6.1) 87.6 (5.5)
District of Columbia 34.8 (6.7) 59.9 (6.9) 77.9 (5.4) 83.8 (5.0) 86.6 (4.4) 91.1 (4.8) 88.8 (4.9) 92.3 (3.5)
Florida 26.9 (4.3) 36.0 (4.9) 50.7 (5.1) 60.6 (4.9) 72.2 (4.4) 80.8 (4.4) 87.6 (4.0) 91.3 (3.0)
Georgia 24.7 (4.5) 43.6 (5.1) 61.7 (5.4) 75.0 (4.6) 87.1 (3.5) 89.2 (3.4) 90.5 (3.5) 91.6 (4.1)
Hawaii 32.5 (6.4) 52.8 (6.4) 63.1 (6.1) 77.6 (5.4) 80.7 (5.0) 81.6 (5.2) 89.6 (4.2) 91.7 (3.4)
Idaho 6.1 (2.6) 8.2 (3.3) 16.1 (4.3) 38.0 (5.5) 55.9 (5.7) 65.9 (6.0) 72.8 (6.1) 77.1 (5.7)
Illinois 20.1 (4.1) 25.8 (4.2) 43.6 (4.9) 47.8 (4.9) 56.6 (4.9) 69.9 (5.1) 77.8 (4.7) 85.9 (3.7)
Indiana 16.7 (3.7) 30.2 (4.9) 42.8 (5.6) 56.1 (5.5) 58.8 (5.3) 70.0 (5.3) 73.1 (6.3) 80.3 (5.4)
Iowa 17.5 (4.4) 33.0 (5.3) 46.0 (5.9) 50.5 (6.4) 62.4 (5.9) 66.5 (6.2) 71.6 (6.4) 85.9 (5.4)
Kansas 24.7 (5.5) 42.5 (6.4) 53.5 (5.9) 56.9 (6.3) 64.4 (7.0) 76.2 (5.5) 74.8 (6.1) 77.8 (6.5)
Kentucky 29.1 (5.6) 49.4 (6.2) 61.7 (6.2) 62.7 (5.9) 77.0 (5.0) 78.3 (6.0) 91.6 (4.2) 89.6 (5.8)
Louisiana 17.1 (4.1) 37.6 (5.7) 61.0 (5.4) 65.2 (5.5) 72.4 (5.2) 83.4 (4.0) 83.3 (4.4) 82.2 (5.2)
Maine 12.5 (3.9) 31.3 (5.4) 43.1 (6.2) 55.1 (6.0) 61.4 (5.8) 73.0 (6.0) 81.0 (4.8) 83.8 (5.1)
Maryland 40.2 (5.4) 53.2 (5.5) 71.7 (4.9) 82.3 (4.6) 87.2 (3.4) 87.7 (4.8) 90.4 (4.3) 90.2 (4.1)
Massachusetts 22.5 (4.6) 47.7 (5.4) 66.0 (5.6) 78.7 (4.7) 82.7 (4.0) 87.0 (3.9) 89.1 (4.3) 90.6 (3.8)
Michigan 15.7 (3.9) 29.6 (5.0) 43.5 (5.4) 69.8 (5.1) 75.2 (4.9) 83.0 (5.0) 88.8 (3.8) 88.0 (4.3)
Minnesota 39.1 (5.9) 46.1 (6.1) 61.6 (6.5) 61.4 (6.3) 73.4 (5.3) 73.6 (6.2) 78.2 (6.4) 83.3 (6.3)
Mississippi 10.5 (3.8) 27.7 (5.8) 39.4 (6.4) 53.3 (6.4) 61.8 (6.3) 77.5 (5.9) 88.5 (4.5) 90.6 (4.4)
Missouri 23.3 (5.3) 36.4 (6.6) 51.4 (5.9) 59.9 (6.2) 68.7 (6.1) 77.1 (5.8) 83.9 (4.8) 85.1 (5.0)
Montana 19.8 (4.4) 35.4 (5.8) 44.6 (6.1) 53.4 (6.4) 66.0 (5.7) 59.2 (6.9) 74.6 (5.6) 74.9 (5.8)
Nebraska 23.6 (4.9) 35.1 (5.5) 58.5 (6.3) 63.4 (5.9) 69.2 (5.7) 74.8 (5.8) 75.3 (6.8) 82.2 (5.0)
Nevada 10.8 (3.9) 28.7 (5.8) 48.3 (6.2) 60.4 (5.5) 66.9 (5.9) 74.7 (6.1) 78.1 (5.6) 80.7 (4.9)
New Hampshire 28.1 (5.3) 41.4 (5.9) 54.0 (6.5) 65.7 (5.5) 73.1 (5.2) 73.9 (6.2) 83.3 (4.9) 85.6 (5.3)
New Jersey 28.1 (5.7) 51.3 (7.1) 59.7 (5.8) 68.0 (5.5) 75.0 (5.2) 80.2 (5.4) 76.9 (6.0) 86.8 (4.8)
New Mexico 20.0 (5.5) 35.5 (6.6) 53.5 (6.5) 67.9 (5.9) 72.4 (5.4) 80.5 (5.9) 84.7 (5.4) 87.5 (4.7)
New York 25.1 (4.1) 46.1 (5.0) 59.2 (4.5) 70.4 (4.1) 78.8 (3.7) 81.0 (4.1) 87.3 (3.2) 89.1 (3.6)
North Carolina 32.4 (5.9) 59.8 (6.1) 59.4 (6.2) 76.3 (5.2) 82.4 (4.5) 81.8 (5.9) 86.0 (4.8) 89.9 (4.6)
North Dakota 24.0 (5.3) 36.4 (5.6) 45.9 (6.0) 59.2 (5.8) 68.8 (5.4) 67.4 (6.7) 71.8 (6.0) 79.6 (5.2)
Ohio 23.0 (4.0) 36.7 (4.8) 53.0 (4.9) 60.1 (5.2) 71.9 (4.2) 75.4 (4.4) 81.5 (4.4) 84.2 (4.2)
Oklahoma 25.7 (5.5) 49.5 (7.0) 66.4 (6.1) 71.6 (5.6) 82.1 (4.5) 81.0 (5.8) 83.9 (6.2) 89.6 (4.6)
Oregon 28.9 (5.4) 43.4 (6.0) 57.9 (6.4) 76.5 (5.4) 73.9 (5.6) 73.7 (5.6) 87.0 (4.4) 84.8 (5.0)
Pennsylvania 40.1 (5.2) 57.7 (5.0) 67.0 (5.3) 73.8 (4.9) 79.5 (4.4) 84.7 (4.9) 85.9 (4.5) 91.9 (3.4)
Rhode Island 36.7 (5.6) 56.3 (6.2) 76.5 (5.7) 81.7 (4.3) 89.6 (3.2) 88.9 (4.9) 90.7 (4.6) 91.7 (3.6)
South Carolina 26.9 (5.4) 51.4 (6.5) 65.1 (5.6) 70.0 (5.6) 80.3 (4.9) 86.0 (5.4) 86.0 (5.0) 90.2 (4.7)
South Dakota 2.6 (2.0) 12.9 (4.1) 17.6 (4.7) 39.9 (6.1) 51.8 (6.4) 71.2 (6.5) 68.4 (6.7) 79.4 (5.9)
Tennessee 21.9 (3.5) 41.6 (4.4) 57.0 (4.5) 69.6 (4.3) 80.4 (3.6) 81.1 (4.1) 87.8 (3.5) 89.0 (3.5)
Texas 23.8 (4.0) 44.1 (4.3) 58.9 (4.0) 73.7 (3.6) 83.5 (2.9) 82.9 (4.1) 87.6 (2.7) 84.8 (3.2)
Utah 14.3 (4.2) 23.7 (5.0) 41.6 (6.4) 51.3 (6.2) 67.6 (5.7) 78.1 (5.5) 79.0 (6.1) 84.8 (4.6)
Vermont 21.3 (4.5) 37.8 (5.9) 46.8 (6.0) 56.8 (5.9) 61.4 (5.5) 66.5 (6.0) 71.2 (5.9) 72.8 (6.2)
Virginia 30.5 (5.6) 50.4 (6.4) 64.6 (6.3) 76.5 (5.6) 82.9 (6.0) 83.0 (5.4) 87.0 (5.1) 88.5 (5.0)
Washington 12.2 (3.0) 21.2 (3.7) 32.1 (4.3) 48.3 (4.6) 56.7 (4.8) 65.1 (5.1) 66.6 (4.9) 77.6 (4.4)
West Virginia 20.0 (4.8) 42.5 (6.0) 51.3 (6.1) 59.7 (6.4) 72.8 (5.6) 81.8 (4.8) 76.5 (7.0) 81.7 (6.1)
Wisconsin 22.1 (3.7) 32.8 (4.4) 49.1 (4.8) 57.0 (4.9) 66.9 (4.8) 79.9 (4.0) 84.4 (4.2) 88.6 (3.3)
Wyoming 10.4 (3.5) 30.4 (5.4) 46.1 (6.1) 56.9 (5.6) 61.0 (6.1) 65.2 (6.5) 68.6 (6.1) 70.4 (6.4)
Northeast 28.6 (2.2) 49.3 (2.5) 61.7 (2.4) 71.7 (2.2) 78.6 (2.0) 82.4 (2.1) 85.5 (1.9) 89.4 (1.8)
Midwest 21.4 (1.5) 32.8 (1.8) 48.2 (1.9) 57.8 (1.9) 66.4 (1.8) 74.8 (1.8) 80.1 (1.7) 84.7 (1.6)
South 25.9 (1.5) 44.8 (1.6) 59.6 (1.6) 71.0 (1.5) 80.6 (1.3) 83.5 (1.5) 87.6 (1.2) 88.5 (1.2)
West 27.5 (2.4) 45.9 (2.5) 59.9 (2.3) 68.3 (2.1) 76.6 (1.9) 80.1 (2.0) 84.4 (1.7) 86.9 (1.5)
black children were significantly more likely than white children to have received varicella vaccine in 1999,
2000, and 2002 (adjusted odds ratio: 1.2–1.3;P⬍.05) (Fig
3). Similarly, controlling for the aforementioned factors increased the odds ratios for Hispanic versus white chil-dren, and Hispanic children were significantly more likely
than white children to have received varicella vaccine from
1998 onward (adjusted odds ratio: 1.2–1.6;P⬍.05).
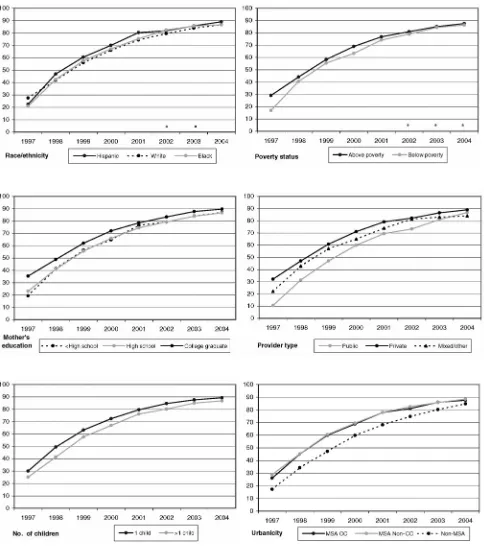
Statistically significant (P⬍.05) gaps in varicella
vac-cination coverage were identified for other characteris-tics of the child, household, and vaccination provider(s) (Fig 2). Children living at or below the poverty level had FIGURE 2
Uptake of varicella vaccine according to demographic factors. CC indicates central city.aAll within-year factor-level differences were significant at theP⫽.05 level except for
3 to 12 percentage points lower coverage rates than did those living above the poverty level from 1997 to 2000, but differences were eliminated by 2002. Similarly, up-take rates were initially 12 to 16 percentage points lower among children whose mothers did not have a college degree, compared with those who did, and 22
percent-age points lower among those who had public providers, compared with private providers, but these gaps nar-rowed to 3 and 2 percentage points, respectively, by 2004. Coverage rates were consistently 3 to 8 percentage
points lower among children in families with⬎1 child,
compared with those with 1 child, and 3 to 13 percent-FIGURE 3
age points lower among children living in non-MSA areas, compared with those living in MSA central cities or MSA non-central cities.
Simultaneous Vaccination (1999 –2004)
Among children who received varicella vaccine, most received a dose of another vaccine on the same date. This proportion increased steadily, from 71% in 1999 to 86% in 2004. Most commonly, children received vari-cella vaccine simultaneously with MMR vaccine; this proportion increased from 55% in 1999 to 70% in 2004. A substantial percentage of children also received vari-cella vaccine with Hib vaccine (29 –37%), DTaP vaccine (19 –26%), poliovirus vaccine (16 –31%), and hepatitis B vaccine (7–23%).
Most children who had not received varicella vaccine
had a medical visit at ageⱖ12 months during whichⱖ1
other vaccination was given. These missed opportunities for simultaneous vaccination decreased consistently be-tween 1999 and 2004 (from 86% to 64% among chil-dren who had not received varicella vaccine and from 37% to 8% among all children) (Fig 4). White children were consistently more likely than black or Hispanic children to have had a missed opportunity for simulta-neous vaccination (2–5 percentage points more than
black children; P ⬍ .05 for each year; 3–7 percentage
points more than Hispanic children; P ⬍.001 for each
year). If missed opportunities for simultaneous vaccina-tion had been eliminated, then varicella vaccinavaccina-tion cov-erage would have increased from 58% to 94% in 1999 and from 85% to 96% in 2004 (reaching 93–95%
among Hispanic and black children). Simultaneous ad-ministration with MMR vaccine alone would have in-creased varicella vaccination coverage rates to 91% in 1999 and 94% in 2004.
DISCUSSION
Nine years after vaccine introduction, varicella vaccine coverage rates among children 19 to 35 months of age have increased dramatically, from 26% in 1997 to 87% in 2004. These findings parallel observed declines in varicella disease incidence and morbidity and mortality
rates.4,5,8Although increases in varicella vaccination
cov-erage levels were most rapid in the first few years after licensure, coverage rates are continuing to increase and are likely to reach the Healthy People 2010 goal of 90% well ahead of schedule. In fact, by 2004, 13 states had achieved 90% coverage and all except 9 states had rates
of⬎80%. Furthermore, because NIS data represent
vari-cella vaccine administered up to 3 years before the end of the reporting year, current coverage levels are likely higher than the estimates provided here.
Our data suggest that one of the greatest opportuni-ties for improving varicella vaccine coverage is simulta-neous administration with other vaccines at existing health care visits. An MMR-varicella combination vac-cine was licensed in the United States in September 2005. With national MMR vaccine coverage at 93% in
2004,11 widespread use of an MMR-varicella
combina-tion vaccine could boost varicella vaccine coverage im-mediately. In addition, missed opportunities for vaccina-tion can be minimized by encouraging parents and
FIGURE 4
providers to deliver varicella vaccine to children at their
first health care visit atⱖ12 months of age.
Disparities in vaccination coverage between white children and black or Hispanic children have been de-scribed for most universally recommended childhood
vaccinations.17–21 In 2004, coverage among black
chil-dren 19 to 35 months of age continued to lag behind that among white children by an estimated 3 percentage points for 3 doses of Hib vaccine and for 1 dose of MMR vaccine and by 7 percentage points for 4 doses of DTaP
vaccine (P⬍.01 for each comparison). Differences for 3
doses of hepatitis B vaccine (2 percentage points; P ⫽
.06) and poliovirus vaccine (1 percentage point;P⫽.14)
were smaller. The black/white disparity was⬃8
percent-age points for the standard combined series of these
vaccines (P⬍.001), and Chu et al22found that this gap
widened from 1996 to 2001 by an average of 1.1 per-centage points per year. Differences between white and Hispanic children were smaller but were statistically sig-nificant for 4 doses of DTaP, 3 doses of Hib, and the
combined series of vaccines (P⬍.01 for each
compari-son). In contrast, we found that, although initial uptake of varicella vaccine was higher among white children, differences between white and black children were not statistically significant after 1997 and Hispanic children had significantly higher coverage rates than did white children in 5 of the 8 years. Furthermore, after control-ling for poverty status, maternal education level, type of vaccination provider, number of children in the house-hold, and urbanicity, initial uptake rates were not statis-tically different between white children and either black or Hispanic children, whereas black children were sig-nificantly more likely than white children to have re-ceived varicella vaccine in 1999, 2000, and 2002 and Hispanic children were more likely than white children to have received varicella vaccine in all years except 1997.
Reasons for the lack of disparity are not completely clear. We found that white children were more likely than either black or Hispanic children to have missed an opportunity to receive varicella vaccine with other vac-cines administered after 12 months of age. In addition, timing of varicella vaccine introduction may be a factor. Varicella was the first new vaccine to be recommended universally after implementation of the Vaccines for Children (VFC) program in 1994. The goal of VFC was to reduce vaccine cost barriers by providing free vaccine to uninsured and underinsured children. Because black children are twice as likely as white children to be
eligi-ble for VFC (66% vs 31%;P⬍.001; CDC, unpublished
data, 2002), the program might have had a dispropor-tionately positive effect on black children. Similarly, the State Children’s Health Insurance Program (SCHIP) was established in October 1997 with the goal of expanding health insurance, including well-child care and
immu-nizations, to children whose family income is above Medicaid eligibility but not high enough for purchase of private insurance. Although all recommended childhood vaccinations are included in VFC and SCHIP benefits, these programs might have had a greater impact on administration of newly recommended vaccines and they might have helped to prevent some missed oppor-tunities for simultaneous vaccination.
Other risk factors that we identified for slow uptake of varicella vaccine, such as living below the poverty level, having a mother who did not have a college degree,
living in a household with⬎1 child, and having public
vaccination providers, were similar to risk factors
de-scribed previously for undervaccination in general.18,23–27
However, we found that gaps in varicella vaccine cover-age between these groups narrowed over the study pe-riod, which suggests that the associated barriers are be-ing overcome successfully. Unlike for other vaccines, living in a non-MSA area was a strong and persistent risk factor for lack of varicella vaccination, consistent with
previous findings.18 Storage and handling are
substan-tially more complicated for varicella vaccine than for other vaccines, because varicella vaccine must be kept
frozen at less than ⫺13°C; deep freezers may not be
readily available in rural areas, and their purchase may be more cost-prohibitive for practices with relatively few young children. In addition, pediatricians, who are more likely to offer varicella vaccine to their patients than are
family physicians or general practitioners,28,29are
under-represented in rural areas.30,31
Before implementation and during the early years of the program, concerns were raised regarding uptake for
varicella vaccine.32,33Identified barriers to use mirrored
those described for the introduction of other childhood vaccines, including safety, availability, cost, reimburse-ment, storage and handling, effectiveness, duration of immunity, effects of vaccination on the epidemiologic features of the disease, absence of child care and school requirements, and the perception that the disease is not serious enough to warrant routine childhood
vaccina-tion.8,34–37 Our data indicated that uptake of varicella
vaccination increased rapidly after vaccine introduction, which suggests that these barriers are being overcome.
Previously published varicella vaccination coverage rates underestimated true coverage, because they did not adjust for children with a history of varicella disease. Although information on disease history was not col-lected in the NIS during 1997 to 1998, it is likely that this bias was even greater for these years, because surveil-lance data suggested that disease incidence was still
high.8,9 Because of the dramatic decreases in varicella
Adolescents and adults are at increased risk of
mor-bidity and death resulting from varicella.1,2As
opportu-nities for exposure to varicella disease decrease, it be-comes increasingly critical (1) to ensure high vaccination coverage rates among young children, to prevent them from reaching adolescence or adulthood without having immunity to varicella, and (2) to monitor vaccine coverage and disease history among older children, ad-olescents, and adults and to vaccinate those without evidence of immunity. Information on vaccination cov-erage among older children and adults is not currently available in the NIS, and mechanisms for collecting this information should be developed.
In addition to a lack of information on the vaccination status of older children and adults, this study is subject to several limitations. First, the NIS is a telephone survey; although data are weighted to adjust for households without telephones and for nonresponse, some bias may remain. Second, history of varicella disease was reported by the caregivers and was not confirmed medically. However, because varicella disease is recognized easily, we expect misclassification to be minimal. Third, we do not have information on health care visits during which no vaccinations were administered or on vaccinations given after data collection, which limits our ability to evaluate more completely missed opportunities for vac-cination and catch-up doses. Finally, the NIS was not designed to provide county-level coverage estimates, which limits our ability to identify geographically local-ized groups of children who have not received varicella vaccine.
Achievement of the Healthy People 2010 goal of 90% coverage for varicella vaccine will require continued cooperation between providers and parents to ensure that children are vaccinated as recommended. Addi-tional focus should be placed on reducing missed opportunities for simultaneous vaccination, improving coverage in rural areas and the Midwest region, and continuing to close gaps related to maternal education, provider type, and multiple-children households. The success of varicella vaccination in eliminating racial dis-parities is encouraging and should be studied more ex-tensively, to identify factors that could be applied to other currently recommended vaccines and to new vac-cines on the horizon.
ACKNOWLEDGMENTS
This research and the NIS were conducted with funding and approval from the CDC, US Department of Health and Human Services.
We acknowledge Dr Abigail Shefer for review of the manuscript and Ron Nuse for graphical support.
REFERENCES
1. Wharton M. The epidemiology of varicella-zoster virus infec-tions.Infect Dis Clin North Am.1996;10:571–581
2. Meyer PA, Seward JF, Jumaan AO, Wharton M. Varicella mortality: trends before vaccine licensure in the United States, 1970 –1994.J Infect Dis.2000;182:383–390
3. Galil K, Brown C, Lin F, Seward J. Hospitalizations for varicella in the United States, 1988 to 1999.Pediatr Infect Dis J.2002;21: 931–934
4. Nguyen HO, Jumaan AO, Seward JF. Decline in mortality due to varicella after implementation of varicella vaccination in the United States.N Engl J Med.2005;352:450 – 458
5. Davis MM, Patel MS, Gebremariam A. Decline in varicella-related hospitalizations and expenditures for children and adults after introduction of varicella vaccine in the United States.Pediatrics.2004;114:786 –792
6. American Academy of Pediatrics, Committee on Infectious Dis-eases. Recommendations for the use of live attenuated varicella vaccine.Pediatrics.1995;95:791–796
7. Centers for Disease Control and Prevention. Prevention of varicella: recommendations of the Advisory Committee on Im-munization Practices (ACIP).MMWR Recomm Rep. 1996;45(RR-11):1–27
8. Seward JF, Watson BM, Peterson CL, et al. Varicella disease after introduction of varicella vaccine in the United States, 1995–2000.JAMA.2002;287:606 – 611
9. Centers for Disease Control and Prevention. Decline in annual incidence of varicella: selected states, 1990 –2001.MMWR Morb Mortal Wkly Rep.2003;52:884 – 885
10. US Department of Health and Human Services.Healthy People 2010. 2nd ed. Washington, DC: US Government Printing Office; 2000
11. Centers for Disease Control and Prevention. National, state, and urban area vaccination coverage among children aged 19 –35 months: United States, 2003.MMWR Morb Mortal Wkly Rep.2004;53:658 – 661
12. Smith PJ, Battaglia MP, Huggins V, et al. Overview of the sampling design and the statistical methods used in the Na-tional Immunization Survey.Am J Prev Med.2001;20(suppl): 17–24
13. Frankel MR, Srinath KP, Hoaglin DC, et al. Adjustments for non-telephone bias in random-digit-dialling surveys.Stat Med. 2003;22:1611–1626
14. Centers for Disease Control and Prevention. General recom-mendations on immunization: recomrecom-mendations of the Advi-sory Committee on Immunization Practices (ACIP) and the American Academy of Family Physicians (AAFP).MMWR Morb Mortal Wkly Rep.2002;51:1–36
15. Dalaker J.Current Population Report, Series P60-207: Poverty in the United States, 1998. Washington, DC: US Government Printing Office; 1999
16. Research Triangle Institute. SUDAAN User’s Manual, Release 8.0.0. Research Triangle Park, NC: Research Triangle Institute; 2001
17. Centers for Disease Control and Prevention. Vaccination cov-erage by race/ethnicity and poverty level among children aged 19 –35 months: United States, 1997.MMWR Morb Mortal Wkly Rep.1998;47:956 –959
18. Luman ET, Barker LE, Simpson DM, Rodewald LE, Szilagyi PG, Zhao Z. National, state, and urban-area vaccination-coverage levels among children aged 19 –35 months, United States, 1999.Am J Prev Med.2001;20(suppl):88 –153
19. Institute of Medicine. Introduction and literature review. In: Unequal Treatment: Confronting Racial and Ethnic Disparities in Health Care.Washington, DC: National Academy Press; 2002: 21– 62
21. Darling NJ, Barker LE, Shefer AM, Chu SY. Immunization coverage among Hispanic ancestry, 2003 National Immuniza-tion Survey.Am J Prev Med.2005;29:421– 427
22. Chu SY, Barker LE, Smith PJ. Racial/ethnic disparities in pre-school immunizations: United States, 1996 –2001.Am J Public Health.2004;94:973–977
23. Luman ET, McCauley MM, Shefer A, Chu SY. Maternal char-acteristics associated with vaccination of young children. Pedi-atrics.2003;111:1215–1218
24. Klevens RM, Luman ET. US children living in and near poverty: risk of vaccine-preventable diseases.Am J Prev Med. 2001;20(suppl):41– 46
25. Bardenheier BH, Ysuf HR, Rosenthal J, et al. Factors associated with underimmunization at 3 months of age in four medically underserved areas.Public Health Rep.2004;119:479 – 485 26. Stokley S, Smith PJ, Klevens RM, Battaglia MP. Vaccination
status of children living in rural areas in the United States: are they protected?Am J Prev Med.2001;20(suppl):55– 60 27. Luman ET, Barker LE, Shaw KM, McCauley MM, Buehler JW,
Pickering LK. Timeliness of childhood vaccinations in the United States: days undervaccinated and number of vaccines delayed.JAMA.2005;293:1204 –1211
28. Zimmerman RK, Mieczkowski TA, Mainzer HM, Medsger AR,
Nowalk MP. Understanding physician agreement with vari-cella immunization guidelines.Prev Med.2002;35:135–142 29. Ehresmann KR, Mills WA, Loewenson PR, Moore KA.
Atti-tudes and practices regarding varicella vaccination among phy-sicians in Minnesota: implications for public health and pro-vider education.Am J Public Health.2000;90:1917–1920 30. Council on Graduate Medical Education.Physician Distribution
and Health Care Challenges in Rural and Inner-City Areas. Tenth Report. Rockville, MD: US Department of Health and Human Services Administration; 1998
31. Randolph GD, Pathman DE. Trends in rural-urban distribution of general pediatricians.Pediatrics.2001;107:1–7
32. American Academy of Pediatrics, Committee on Infectious Dis-eases. Varicella vaccine update.Pediatrics.2000;105:136 –141 33. Shapiro ED, LaRussa PS. Vaccination for varicella: just do it!
JAMA.1997;278:1529 –1530
34. Schaffer SJ, Bruno S. Varicella immunization practices and the factors that influence them.Arch Pediatr Adolesc Med.1999;153: 357–362
35. Taylor JA, Newman RD. Parental attitudes toward varicella vaccination.Arch Pediatr Adolesc Med.2000;154:302–306 36. Gershon AA. Varicella: to vaccinate or not vaccinate.Arch Dis
Child.1998;79:470 – 471
DOI: 10.1542/peds.2005-1201
2006;117;999
Pediatrics
Elizabeth T. Luman, Pamela L. Y. H. Ching, Aisha O. Jumaan and Jane F. Seward
Success Story in Eliminating Racial and Ethnic Disparities
Uptake of Varicella Vaccination Among Young Children in the United States: A
Services
Updated Information &
http://pediatrics.aappublications.org/content/117/4/999 including high resolution figures, can be found at:
References
http://pediatrics.aappublications.org/content/117/4/999#BIBL This article cites 32 articles, 6 of which you can access for free at:
Subspecialty Collections
_sub
http://www.aappublications.org/cgi/collection/vaccine:immunization
Vaccine/Immunization
b
http://www.aappublications.org/cgi/collection/infectious_diseases_su
Infectious Disease
following collection(s):
This article, along with others on similar topics, appears in the
Permissions & Licensing
http://www.aappublications.org/site/misc/Permissions.xhtml in its entirety can be found online at:
Information about reproducing this article in parts (figures, tables) or
Reprints
DOI: 10.1542/peds.2005-1201
2006;117;999
Pediatrics
Elizabeth T. Luman, Pamela L. Y. H. Ching, Aisha O. Jumaan and Jane F. Seward
Success Story in Eliminating Racial and Ethnic Disparities
Uptake of Varicella Vaccination Among Young Children in the United States: A
http://pediatrics.aappublications.org/content/117/4/999
located on the World Wide Web at:
The online version of this article, along with updated information and services, is
by the American Academy of Pediatrics. All rights reserved. Print ISSN: 1073-0397.