Lincoln
University
Digital
Dissertation
Copyright
Statement
The
digital
copy
of
this
dissertation
is
protected
by
the
Copyright
Act
1994
(New
Zealand).
This
dissertation
may
be
consulted
by
you,
provided
you
comply
with
the
provisions
of
the
Act
and
the
following
conditions
of
use:
you
will
use
the
copy
only
for
the
purposes
of
research
or
private
study
you
will
recognise
the
author's
right
to
be
identified
as
the
author
of
the
dissertation
and
due
acknowledgement
will
be
made
to
the
author
where
appropriate
you
will
obtain
the
author's
permission
before
publishing
any
material
from
the
dissertation.
Agronomic Effectiveness of Chatham Rise Sediments
A dissertation
submitted in partial fulfilment
of the requirements for the Degree of
Bachelor of Agriculture Science Honours
at
Lincoln University
by
Linden Brackstone
Lincoln University
Abstract of a dissertation submitted in partial fulfilment of the
requirements for the Degree of Bachelor of Agriculture Science Honours.
Abstract
Agronomic Effectiveness of Chatham Rise Sediments
by
Linden Brackstone
Sediments from the Chatham Rise, a by-product from phosphate nodule extraction, could have some
agronomic value for New Zealand pastoral soils. Two pot trials were carried out to investigate the
agronomic effectiveness of four selected sediments with varying levels of nutrients, mainly calcium
(Ca) and phosphorus (P). The first experiment tested all sediments at a range of application rates in
contrasting soils growing Italian ryegrass (Lolium multiflorum). The second experiment tested one
selected sediment at a constant rate of P against Chatham Rise phosphate rock (PR) and triple
superphosphate (TSP), growing monocultures of Italian ryegrass and white clover (Trifolium repens).
Results showed that sediment application did not increase ryegrass dry matter yield or P uptake,
however did have a liming effect. One sediment, DD44W, actually reduced clover dry matter yield in
the second experiment, and P uptake was significantly reduced compared to PR and TSP. The findings
demonstrate that these sediments are of limited value as a P fertiliser, however the sediments with
higher Ca content can be a useful liming material. The implications are that if the mining project gets
consent, these sediments could be retained rather than returned to the sea floor after phosphate
nodule extraction. These findings could also be beneficial in the consenting process and could
provide a useful product for New Zealand farmers while also providing a solution that reduces the
environmental impacts of the sea floor mining operation.
Keywords: Chatham Rise Phosphate, Sediments, Phosphorus, Calcium, Liming, Pot Trial, Italian
Ryegrass (Lolium multiflorum), White Clover (Trifolium repens), Seafloor Mining, Phosphate Nodules,
Acknowledgements
I would first and foremost like to thank Leo Condron for being an all round good bugger and a great
supervisor. Your laid-back attitude and commitment to a simple straightforward project and getting
shit done was much appreciated. Your unique style and wealth of knowledge made this dissertation a
fun and engaging process and I have learned lots and enjoyed working with you. Academia needs
personalities like you so keep doing what you are doing and spreading the good word for phosphorus
and soil science!
The plant science honours kids must be acknowledged as you guys provided a great source of banter;
a break from the stuffy science filled burns building and made my last year at Lincoln very enjoyable!
Your superior coffee and spacious tearoom facilities were great for procrastination, as was getting
out onto your trial plots and sometimes being of assistance.
Special thanks to university staff goes to Brent Richards for accommodating me in the glasshouses
and helping me with any questions I had and things I needed for my trial. Rodger Cresswell, your
proactivity and help with anything lab or sample related was greatly appreciated, cheers!
Cheers also to my fellow postgrad students in the office in the first half of the year. Sephra, Sophie
and Flavia it was great to have your company and discussions and it made for a great working
environment in the office. Giant jenga was a great distraction for procrastination as was giant
dominos around the office. It was fun working along side you all and it made for a fun and enjoyable
Table of Contents
Abstract ... ii
Acknowledgements ... iii
Table of Contents ... iv
List of Tables ... vi
List of Figures ... vii
Chapter 1 Introduction ... 1
Chapter 2 Literature review ... 3
2.1 Phosphate rock ...3
2.2 Phosphate Rock Reactivity ...5
2.2.1 Chemical Characteristics of Phosphate Rock ... 5
2.2.2 Physical Characteristics of Phosphate Rock ... 6
2.3 Dissolution of Phosphate Rock in Soil ...7
2.3.1 Soil Factors ... 9
2.3.2 Plant Factors...10
2.3.3 Interaction of Factors ...11
2.4 Liming Effect ... 11
2.4.1 Effective Neutralising Value ...12
2.4.2 Liming Effect of Long Term Phosphate Rock Application ...13
2.4.3 Limitations of Liming Effect ...15
2.5 Agronomy of Phosphate Rock ... 15
2.5.1 Relative Agronomic Effectiveness ...15
2.5.2 Relative Agronomic Effectiveness Compared with Superphosphate ...17
2.5.3 Lag Phase ...19
2.5.4 Strategies for Improving Agronomic Effectiveness of Rock Phosphate ...20
2.6 Phosphate Rock Application in New Zealand ... 21
2.7 Conclusions ... 21
Chapter 3 Materials and Methods ... 23
3.1 Collection and Preparation of Materials ... 23
3.2 Glasshouse Experiment 1 ... 25
3.2.1 Trial Design ...25
3.2.2 Nitrogen and Sulphur Application ...27
3.2.3 Harvesting ...27
3.2.4 Sample Analysis ...27
3.2.5 pH Sampling ...27
3.3 Glasshouse Experiment 2 ... 28
3.3.1 Nitrogen and Sulphur Application ...29
3.3.2 Harvesting ...29
3.3.3 Sample Analysis ...29
3.3.4 pH Analysis ...30
4.1 Glasshouse Experiment 1 ... 31
4.1.1 Dry Matter Yields ...31
4.1.2 Phosphorus Uptake ...31
4.1.3 Soil pH ...32
4.2 Glasshouse Experiment 2 ... 33
4.2.1 Dry Matter Yields ...33
4.2.2 Phosphorus Uptake ...34
4.2.3 Soil pH ...35
Chapter 5 Discussion ... 36
5.1 Glasshouse Experiment 1- Relative Agronomic Effectiveness of Different Sediment Materials ... 36
5.2 Glasshouse Experiment 2- Agronomic Effectiveness of a Selected Sediment Compared With Other Phosphorus Fertilisers ... 37
Chapter 6 Conclusions ... 42
List of Tables
Table 1. Estimation of reserves and resources in million of metric tons of PR by the IFDC (International Fertiliser Development Centre) and USGS (United States geological
survey) (Walan, 2013). ... 4
Table 2. Comparison of normally ground and very finely ground Gafsa PR (Davies, 1984). ... 7
Table 3. Liming properties of various phosphorus fertiliser products (Lewis et al., 1997). ...13
Table 4. Change in pH values across a range of Australian sites. *= Significant main effect for fertiliser product (mean for year 2-4) (Lewis et al., 1997). ...14
Table 5. Analysis of nutrients in Chatham Rise sediments at different application rates. ...23
Table 6. Soil test results for Whanganui, Chatham, Gammack and Wairarapa soils. ...24
Table 7. Glasshouse experiment 1 design. ...26
Table 8. Glasshouse experiment 2 design. ...28
Table 9. Mean dry matter yield mg/pot of Italian ryegrass in response to varying rates of sediments in a range of soils. Sediments compared within soils, NS= non-significant difference. ...31
Table 10. Mean P uptake mg/pot of Italian ryegrass in response to varying rates of sediments in a range of soils. Sediments compared within soils. Means with the same letters are not significantly different, NS= non-significant difference. ...32
List of Figures
Figure 1. Reported PR reserves in 2013 (Walan, 2013). ... 4 Figure 2. Relationship between unit-cell a dimension of apatite sample and solubility of P in 2%
citric acid solution, adapted from (Rajan et al., 1996). ... 6 Figure 3. Diagram showing the rate limiting factors (boxes inside shaded area) for PR dissolution in soils and the variables (boxes outside striped area), which determine the magnitude and degree of interaction of the rate limiting factors (Bolan et al., 1990). ... 8 Figure 4. The soil P cycle (Pierzynski et al., 2005). ... 9 Figure 5. Exchangeable Al and Ca in an acidic soil treated with 200 kg P/ha triple superphosphate
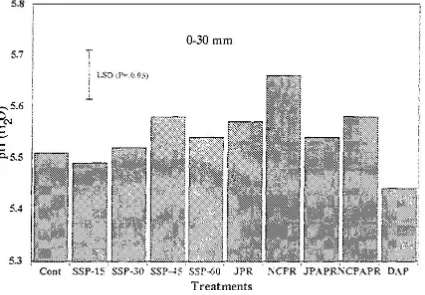
and varying PR forms during incubation (Zapata & Roy, 2003)...12 Figure 6. Effect of P fertilizer application on soil pH at 0-30 mm depth (Manoharan, 1997). ...14 Figure 7. The measurement of effectiveness of PR relative to SSP. Graph A shows the vertical
comparison, y0 control yield, y1, y2 yield increase due to input of P as PR and SSP respectively. Graph B shows the horizontal comparison y0 control yield, y1 yield increase due to input of P as PR x1 or SSP x2 (Bolan et al., 1990). ...16 Figure 8. Phosphorus yield of subterranean clover tops at harvest 1 as a function of rate of
application of SP (triangles), Island PR (dimonds), North Carolina PR (squares) and C500 (circles) for(a) incorporated sources, (b) surface-applied sources (Yeates & Allen, 1987). ...18 Figure 9. Dry matter yield (permanent pasture) response curves on applying phosphate fertilizers.
Adapted from (Rajan, 2002). ...19 Figure 10. Pots in randomised design pre first harvest. ...26 Figure 11. Second experiment pre randomisation and first harvest. ...29 Figure 12. Mean dry matter yield mg/pot of Italian RG and WC in response to a range of P
fertilizers. Means compared within pasture type. ...33 Figure 13. Mean P uptake mg/pot of ryegrass and white clover in response to a range of P
fertilizers. Means compared within pasture type. ...34 Figure 14. Mean pH of ryegrass and white clover in response to a range of P fertilizers. Means
Chapter 1
Introduction
Phosphorus (P) is a major essential element, required in all plant, animal and agricultural systems
(Sims & Sharpley, 2005). In agriculture world wide, P deficiencies limit agricultural food production
and in New Zealand P is the main nutrient required for pasture production and its deficiency is a
major limiting factor (Di et al., 1994). Mineral fertilisers are used to counter P deficiencies and are
used when establishing and maintaining pastures in agricultural soils. The application of
superphosphate is the main form P is applied to soils in New Zealand. Phosphate rock (PR) is the raw
material used in superphosphate fertiliser production, with 80% of this coming from sedimentary
apatite (Stewart et al., 2005). World reserves of PR are estimated by the US geological survey to be
around 67 billion metric tons as at January 2013 and resources could be over 300 billion metric tons
(Walan, 2013). It is understood that the supply of this PR globally is shrinking as the common
reserves in places such as Morocco and South Africa become depleted. This is linked to increasing
global population growth and food demands increasing the mining of PR reserves, as a major portion
is used in crop production.
Given the increasing demand for PR globally, new reserves are being investigated for their feasibility
for mining. The Chatham Rise is an under water shelf 450km off the east coast of New Zealand that
has significant PR deposits and has been extensively surveyed since the 1960s, with a current plan to
mine Phosphate rich nodules off the sea floor. This project requires regulatory permission to
undertake the mining and if successful, plans to supply roughly 35 million tonnes of PR for fertiliser
manufacture and direct application over the 20 year life span of the project (Chatham Rock
Phosphate Ltd., 2014).
The production of PR for direct application fertiliser has direct positive implications for New Zealand
agriculture and organic agriculture. Phosphate rock application is also a viable option for acidic hill
country farms and is the only viable option for organic farmers, as the use of soluble fertilisers is
prohibited (Bolan et al., 1990). For New Zealand agriculture, this will provide a secure local source of
PR, reducing dependence on imports from countries such as Morocco.
A by-product of the PR nodule extraction is a large amount of sediment and it is this sediment that is
the focus of this study. Sediments from the Chatham Rise vary in their mineralogical composition and
The first objective in this project was to evaluate the general agronomic effectiveness of these
sediments at a range of application rates in contrasting soils. Once the agronomic effectiveness was
established, the second objective aimed to assess the specific effectiveness of one selected sediment
as a P fertiliser. This selected sediment was compared at the same rate of P to Chatham Rise PR and
triple superphosphate. The findings from these two trials were designed to show if these sediments
could be of any use to New Zealand agriculture? An understanding of the response including P
uptake was gained as was other beneficial characteristics these sediments can bring to agricultural
Chapter 2
Literature review
2.1
Phosphate rock
Phosphate rock (apatite) are naturally occurring mineral assemblages (rocks), that contain relatively
high levels of P bearing material (Stewart et al., 2005). Apatite describes a group of hexagonal
crystalline phosphate minerals that are abundant on the earth surface and make up what is
commonly known as PR. This group can be split into 3 types of apatite, FluoroapatiteCa5(PO4)3F,
Chloroapatite Ca5(PO4)3Cl and Hydroxyapatite Ca5(PO4)3OH. This P bearing material is in the PR
mainly in association with Ca (Lehr, 1980). PR is found in two types, sedimentary or the hard mineral
igneous type (Kisitu, 1991). Sedimentary PR, ranging in form from loose unconsolidated material to
hardened rock, is the most common form found world wide, accounting for 80% of the worlds
production of PR (Stewart et al., 2005). This sedimentary PR, or marine phosphorites as it is
commonly know, has its main P bearing component as calcium fluroapatite Ca10(PO4)6F2 (Mackay,
1982). Chatham Rise PR is an example of this calcium fluroapatite which contains roughly 9% P and
25% CaCO3. Hard mineral PR is less reactive and not suitable for direct application.
The world reserves of PR are estimated by the US geological survey to be around 67 billion metric
tons as at January 2013 and resources could be over 300 billion metric tons (Walan, 2013). This is
located mainly in Morocco, which has recently had the estimate of their reserves up graded from 5.7
to 50 billion tons. Other major contributors to world PR reserves are South Africa, China and the USA
Table 1 and Figure 1 below.
Phosphate rock is the main raw ingredient used in phosphorus fertiliser production and is also used
for direct application. The mineralogical, textural and chemical characteristics of PR vary widely and
these are influenced by their origin and the quality/type of PR mined at the location. Regardless of
the type or origin of PR, the P in the rock exits in a form that is not readily available to plants (Kisitu,
1991). Some rocks have greater solubility than others and are more suited to direct application, but
all under go a chemical process in order for the P to become plant available and for them to be an
Table 1. Estimation of reserves and resources in million of metric tons of PR by the IFDC (International Fertiliser Development Centre) and USGS (United States geological survey) (Walan, 2013).
2.2
Phosphate Rock Reactivity
The key concern when looking at PR for direct application is the reactivity, as this has a direct
association with the relative agronomic effectiveness. For PR to be used as a direct application
fertiliser it is crucial that it dissolves in the soil and releases P for plant uptake. It is important to
access this reactivity as this will give a measure as to how well the PR will dissolve in soil and its merit
as a direct application fertiliser. Rajan et al. (1996) defined this by, “reactivity is the combination of
PR properties that determines the rate of dissolution in a given soil under given field conditions”.
When looking at the reactivity of PR in terms of direct application, it is important to consider
dissolution at a field scale. However to test reactivity at this scale would be unfeasible and
impractical, so a method of estimating the chemical reactivity has been developed by dissolving PR in
different chemical reagents (Osztoics et al., 2006). This provides a feasible test to give a measure of
the reactivity for a range of PR types. In New Zealand the standard test for determining if a PR is
classified as reactive is if 30% of the P in the rock is dissolved in a 2 % citric acid solution (Bolan et al.,
1990). However there is some debate around this measure with Rajan et al. (1992) suggesting that
this be replaced with the 2% formic acid test. They state that it is a more sensitive test and a better
predictor of agronomic performance, with greater sensitivity to particle size and the chemical
reactivity of the PR.
2.2.1
Chemical Characteristics of Phosphate Rock
The Calcium apatite of sedimentary origin have been found to be suitable for direct application
(Rajan et al., 1996). However their reactivity and agronomic effectiveness is effected by the chemical
nature of the PR. Furthermore the reactivity is inversely related to the apatite unit cell ‘a’ dimension
(Condron et al., 1994) Figure 2. This decrease in unit ‘a’ dimension occurs through the substitution of
CO32- for PO43- in the lattice structure of the apatite mineral (Rajan et al., 1996). The degree of this
substitution causes an increase in the crystal instability and reactivity as the tetrahedral PO43- is being
replaced by the planar CO32-. The resulting increase in reactivity was shown by Rajan (1987) that
found 1 year after surface application of PR to permanent pastures, only 27% of the low carbonate
substitution PR dissolved compared with 42% of the high carbonate substitution PR. However, an
increasing substitution of CO32- in the apatite mineral causes issues with solubility. The dissolution
increases the calcium concentration and pH at the apatite surface, reducing the rate of dissolution of
the PR in soil solution. Although under field conditions this calcium may be removed by plant uptake,
Figure 2. Relationship between unit-cell a dimension of apatite sample and solubility of P in 2% citric acid solution, adapted from (Rajan et al., 1996).
2.2.2
Physical Characteristics of Phosphate Rock
The physical nature of PR has a direct impact on reactivity and agronomic effectiveness (Bolan et al.,
1990). It is convention to grind PR down to a fine powder (<150 um diameter) to increase the surface
area and increase its agronomic effectiveness. By grinding to a fine powder there is a larger surface
area exposed for dissolution to take place, which is important in the solubility in a 2% citric acid test.
However Davies (1984) points to much debate around the effectiveness of grinding PR from normal
(80 % passing through <150 um sieve) to fine grinding known as hyper phosphate (90% passing
through <63 um sieve). This paper suggests that in acidic soils the increased benefit of grinding the
rock finer is only marginal as the normally ground PR will dissolve anyway, however in higher pH soils
there is a greater reduction in effectiveness of the normally ground PR than the fine ground PR. Table
2 below shows the benefit of extra grinding on a slightly acidic grassland soil (pH 5.8-6.3) is marginal,
with results only evident in residual years and this author questions the extra expense of additional
Table 2. Comparison of normally ground and very finely ground Gafsa PR (Davies, 1984).
While this grinding is important to increase the reactivity, it causes issues with spreading and
handling of the product. To overcome this issue of spreading a fine dusty powder, products such as
palletised or granulated PR have been developed. But again these pellets can reduce dissolution
rates in the soil and reduce its effectiveness as the soil solution around the particle becomes
saturated with P (Amberger, 1979). This is evident in a paper by Davies (1984) who showed a relative
increases in dry matter yield from a permanent grassland at 32.7 kg of P/ha for years 0, 1 and 2, of
52, 123 and 100 kg DM/ha for the powder and 35, 109 and 117 kg DM/ha for the granulated
materials respectively.
The issues surrounding the physical nature of PR is summed up well by Chien (1979) who stated that
“the effectiveness of PR increases as particle size decreases, if the rate of dissolution of the PR in soil
solution is the limiting factor in the uptake of phosphorus by plants and that Ca ions in soil solution
depress the dissolution of PR”.
2.3
Dissolution of Phosphate Rock in Soil
For PR to be used as an effective fertiliser it must dissolve in soil solution and release P for plant
uptake (Hughes & Gilkes, 1986). This dissolution depends on a range of factors which all interact to
determine the rate of dissolution in soil Figure 3. Rock type and particle size are the first major
factors influencing the dissolution of PR in soil and the chemical reaction and dissolution of rock
minerals is directly associated to this. After particle size the condition of soil solution surrounding the
PR particle is important in determining the dissolution rate. Soil solution H+ ion concentration is of
major importance, as acidic conditions will aid PR dissolution. Phosphate Rock fertilisers are
particularly suited to acidic soils where they dissolve in the soil faster and have higher rates of P
supply to the soil solution (Rajan, 2002). Calcium ion concentration also directly effects dissolution of
PR, as the major product of this equation has to defuse across a concentration gradient into soil
Outside of these 4 immediate rate limiting factors, are factors that influence dissolution such as pH
buffering capacity, which is important to buffer against the liming effect of PR dissolution, rainfall
amount and evaporation and the CEC of the soil and P retentive nature.
2.3.1
Soil Factors
Dissolution of PR in soil is a simple process but is complicated by a range of conditions and factors
that both enhance and impair the dissolution rate. The inputs of mineral P as PR are the main
addition of P into the cycle and the interactions and pathways can be seen below in Figure 4.
Figure 4. The soil P cycle (Pierzynski et al., 2005).
Dissolution in soil can be explained by the equation Ca10(PO4)6F2+12H+=10Ca2++6H2PO4-+2F- (Bolan et
al., 1990). For this reaction to take place and continue in the soil there needs to be available
reactants (PR, H2O and H+) and the ability for products (Ca2+ and H2PO4-) to be removed from soil.
Given this equation the 2 major limiting factors in soil, which will affect dissolution rate, are the pH
and calcium concentration. H+ supply is crucial to this reaction given adequate soil moisture, as a
large number of H+ ions are required for dissolution to occur. However related to this is the buffering
capacity of the soil. The consumption of H+ and production of OH- ions by the PR in poorly buffered
soils will raise the pH, making an unsuitable environment around the PR particle for dissolution
(Rajan et al., 1996). Yeates and Allen (1987) reported a 2 unit pH increase in a pot trial with PR as a
result of the dissolution, however this was 10 times greater than the response seen in the National
Reactive Phosphate Rock Project field trials carried out across Australia from 1997 by Lewis et al.
The second major factor affecting PR dissolution is Ca2+ concentration in soil solution. A lot of Ca2+ is
produced in the dissolution process and this will raise the concentration of Ca2+ around the PR
particle. This results in less of a concentration gradient for the Ca2+ to diffuse across and raises the
pH, reducing the dissolution rate of PR further. Davies (1984) summarises this factor by concluding,
“where the soil solution is rich in Ca2+ ions or free calcium carbonate prevails PR doesn’t react
effectively”
The P sorption capacity of the soil is another factor that affects dissolution. As the soil absorbs P onto
the soil surface and away from the environment around the PR particle, it will favour dissolution of P
from the PR, due to the concentration gradient. This is a smaller effect than the Ca2+ concentration in
soil solution. However a paradox exists where if this absorbed P is not in a plant available form then
the agronomic effectiveness of PR may be no higher than superphosphate (Gregg et al., 1987).
Cation exchange capacity of the soil is important as it allows exchange sites to absorb Ca2+, effects
the buffering capacity of the soil and affects the supply of the crucial H+ ions into soil solution for the
dissolution of PR to occur. Organic matter (OM) is beneficial for PR dissolution as it provides a large
number of exchange sites for cation exchange and the organic acids produced through microbial and
chemical action on the OM aids the dissolution of PR (Chien & Menon, 1995).
Soil textural factors also impact PR dissolution as Scholefield et al. (1999) found with their study on
acidic clay soils under high rainfall environments in SW England. These soils allowed the initial large
doses of PR to be applied and incorporated into the soil without leaching, and dissolve in the soil,
which retained a higher level of soil moisture allowing dissolution to occur and the clover/grass
sward to benefit.
2.3.2
Plant Factors
Phosphate rock has generally been more effective under permanent pastures such as ryegrass/white
clover than arable crops such as barley and wheat (Bolan et al., 1990). The higher root density under
permanent pastures results in higher P uptake by plant because there is a greater chance of roots
coming into contact with PR particles. Also the effect is greater when plant roots cause some
acidification in the rizohsphere, especially legumes through the process of N fixation. As the process
of N fixation enhances the dissolution of PR by the resulting soil acidification. Also the use of N based
fertilisers can lead to acidification and the organic acids excreted by the plants can aid dissolution of
2.3.3
Interaction of Factors
Perrott et al. (1996) confirmed the interaction of factors on the dissolution of PR in soil from their
study on across 94 sites in New Zealand. Finding the rate of PR dissolution can be estimated by the
solubility of PR and its particle size, soil factors such as type, pH, drainage and rainfall. They also
found the correlation between pH and rainfall, with dissolution rate negatively correlated to pH and
positively correlated with rainfall. Higher soil moisture contents allowed for greater diffusion of the
products of dissolution (Ca and P) away from the particle and into soil solution. Drainage also has a
negative effect on dissolution as PR dissolves faster is poorly drained soils. Sinclair et al. (1990) found
that a combination of high soil pH>6, low rainfall <800 mm/yr and high P retentive soils >95%, will
produce unfavourable conditions for PR dissolution. Perrott et al. (1996) summarised the interaction
of these factors stating that, an initial regression model indicated that the rate of dissolution was
negatively associated with soil pH and positively associated with rainfall and exchangeable soil
magnesium. Aside from these factors, and one that may have a large impact in terms of availability of
PR to plant roots, is earthworm activity. Loganathan et al. (2004) found that earth worms moved up
to 24% of the PR to a depth of 40-60mm which gives rise to errors in dissolution calculations at
shallow depth and availability of PR particles for shallow rooted pastures.
2.4
Liming Effect
New Zealand soils, especially south island hill and high country soils are known to be acidic with a sub
optimal pH (<5.5) for adequate pasture growth (Morton et al., 1998). Furthermore a raise in the pH is
especially important to promote legume growth in the sward to encourage nitrogen fixation and
supply to pasture. Also the availability of nitrogen and phosphorus improves with a higher soil pH as
does the plant P content and P uptake (Lewis et al., 1997). Issues of aluminium (Al) and manganese
toxicity, which impair legume growth, are reduced with an increase in soil pH. Traditionally, raising
pH has been achieved through lime application in the form of CaCO3 of around 2500kg/ha every 3-10
years depending on soil acidity (Craighead, 2005). However another viable option may be to apply PR
at high rates over time, as the dissolution will have a liming effect, raising the pH as well as providing
a P source to support legume production (Lewis et al., 1997). In the process of dissolution, PR
consumes a large number of H+ ions and produces Ca2+ ions raising soil pH (Zapata & Roy, 2003). This
relationship can be seen below in Figure 5, where raised Caconcentrations from the dissolution of PR
Figure 5. Exchangeable Al and Ca in an acidic soil treated with 200 kg P/ha triple superphosphate and varying PR forms during incubation (Zapata & Roy, 2003).
However Lewis et al. (1997) cautions the viability of this from their study of PR application across
varying landscapes in Australia. They state that any liming effect must be considered against 3
criteria. 1) That the PR is dissolving as seen by a pasture yield response. 2) That there was actually a
significant increase in the PR treatments compared to the control and superphosphate treatments.
3) That the soil pH increase observed came from PR types that were more agronomically effective.
2.4.1
Effective Neutralising Value
Liming products are measured on their effectiveness to neutralise soil acidity and this is represented
by a measure of the CaCO3 content. The calcium carbonate equivalent (CCE) can be estimated for PR
and is the sum of gangue mineral and the carbonate in the apatite which makes up PR and gives an
indication of its liming potential (Zapata & Roy, 2003). Agricultural lime has a effective neutralising
value of >90% which puts it in the top grade, with ENV of 65-80% and 55-65% making up grade 2 and
3 respectively, according to Australian legislation (Lewis et al., 1997). Phosphate rock fertilisers are
very low grade liming materials with ENV varies at around 50% and this is dependant on origin of
rock, fineness and amount of carbonate substitution. Also these potential liming values are
dependant on full dissolution of material which can often be limiting (Zapata & Roy, 2003). Table 3
Table 3. Liming properties of various phosphorus fertiliser products (Lewis et al., 1997).
2.4.2
Liming Effect of Long Term Phosphate Rock Application
In a wide PR trial across various Australian landscapes Lewis et al. (1997) found that application rates
of 100-200 kg/ha/yr with an ENV of 50% could be adequate to negate soil acidification in pastoral
soils. However there were inconsistent pH values between the sampling sites each year and this large
variability masked the small pH change caused by PR application. When the pH change was analysed
from year to year only 13 of the 27 sites significantly increased in pH and the author concluded that
only 3 of these increases met the criteria for the PR to class as a liming product Table 4. In pot trials
Yeates and Allen (1987) found PR sources to be an effective liming source, raising the pH and
lowering extractable Al. However they were in effective as liming materials when compared on a
basis of fertiliser material (calcium carbonate content) against traditional lime. Over the long term
Manoharan (1997) indicated that after 8 years of application, North Carolina PR can significantly raise
the pH of the slightly acidic trial soil (pH 5.4-5.8) and lower the soluble Al compared to control plots.
Soil pH was raised to around 5.68 compared to the control of 5.5 with applications of PR at 30 kg
P/ha/yr over the trial Figure 6. They state however that regardless of the form or rate of P, the soil
became increasingly acidic over time and that consistent applications of PR was able to counter this
and even increase pH, while soluble P forms such as DAP and superphosphate further acidified soils
Figure 6. Effect of P fertilizer application on soil pH at 0-30 mm depth (Manoharan, 1997).
2.4.3
Limitations of Liming Effect
As stated by Manoharan (1997), pastoral soils naturally acidify over time and the liming effect of the
PR may only be minimal and inadequate to cover this natural acidification. Another consideration is
the carbonate content of the PR and its reactivity, which will also be affected by the carbonate
substitution in the mineral PR. It is shown that the liming effect will be beneficial in years
immediately prior to application in acidic conditions, with liming effect reducing as pH rises and Ca2+
content from dissolution hinders further dissolution rate (Bolan & Hedley, 1990).
2.5
Agronomy of Phosphate Rock
Phosphate rock has been proven to be a beneficial fertiliser for grazed pastures and its popularity has
grown over the years (Quin et al., 2012). There are circumstances where PR should not be used, such
as high intensity farming systems or where dissolution is limited. Although in all other situations,
efforts have been made to understand how well PR performs against conventional water-soluble P
fertilisers such as super phosphate. There has been some debate about the effectiveness of PR as a
form of P fertiliser over time, due mainly to the various interacting factors that effect the dissolution
(Percival et al., 1984). Although it is now well proven that PR can be as effective as superphosphate
under the right conditions and generally performs well as a maintenance P fertiliser due to its slow P
release. The main measure for accessing the potential of PR in agriculture is relative agronomic
effectiveness. Using this measure, trials have demonstrated if any yield reduction has resulted from
using PR compared with superphosphate and research has been directed into establishing
techniques for enhancing the effectiveness of the PR as a direct application fertiliser.
2.5.1
Relative Agronomic Effectiveness
To compare the effectiveness of PR to water-soluble fertilisers it is important to first determine what
relative agronomic effectiveness is and how it is defined in the literature. Rajan et al. (1996) states
agronomic effectiveness of PR as the ability for it to supply adequate P levels to sustain desired levels
of crop production. The focus for this definition is on plant growth rather than purely the dissolution
in soil, which has the main bearing on the agronomic effectiveness of the PR as a P fertiliser. So in a
situation where farmers are using PR as a P fertiliser a method must be established to access the
effectiveness, usually against a soluble P fertiliser such as superphosphate (SSP). However problems
arise when making comparisons between SSP and PR as their crop growth response curves are non
linear and do not share the same maximum yields (Chien et al., 1990). Two common methods were
developed to counter this issue and determine the relative agronomic effectiveness Figure 7. The
The second method is the horizontal comparison or the substitution rate. This is the amount of
fertiliser SSP that can be substituted by PR, which is still supplying the same amount of nutrients. The
substitution method is measured by the ratio of fertiliser inputs (x) that produce the same increase in
yield (y). This can be explained by the equation Substitution Rate= (x2/x1)=(y1/x1) X (x2/y1) (Bolan et
al., 1990) Figure 7. The measure of agronomic effectiveness is widely used throughout research on
PR and it is important to have a consistent measure, which can be used to compare results between
studies. Van Straaten (2006) stated that the agronomic effectiveness of rock fertilizers is a function of
rock factors, mineralogy, Ca substitution, particle size and soil factors such as organic matter content,
pH, texture, crop factors, environmental factors and management factors. Given all that affects
agronomic effectiveness the need for one measure is important if conclusions are to be drawn
between studies.
2.5.2
Relative Agronomic Effectiveness Compared with Superphosphate
Phosphate rock can be as effective as superphosphate (SSP) when applied to permanent pasture as a
source of P (Mackay et al., 1984). The application of 70 kg P/ha as CRP in an initial autumn
application was as effective as 3 applications of superphosphate at 35 kg P/ha, in the 3rd year of this
trial in 2 moist north island sheep and beef sites. Pasture and clover production with the CRP
treatment in the 3rd year was roughly 7000 kg DM/ha, similar to the 3 applications of
superphosphate, which equated to 105 kg P/ha. This was similar to the trial by Rajan (2002) who
demonstrated that North Carolina PR produced similar DM responses in years 4 and 6 after an initial
lag phase Figure 9. However this trail repeated P applications yearly with a slightly different PR to
CRP. Both of these studies highlight the important point of the lag phase when applying PR. Yeates
and Allen (1987) disagrees and suggests that legume P uptake is limited with PR applications
compared with superphosphate fertiliser applications. This paper suggests that DM yield is also less
with the PR treatments than the maximum achieved with superphosphate in the short term under
pot trial conditions with low DM yields associated with this low plant P uptake Figure 8. Also
highlighted is the fact that PR dissolution will be limited to below the maximum DM yield of
superphosphate treatments, due to increasing concentrations of P and Ca, with this becoming more
Figure 9. Dry matter yield (permanent pasture) response curves on applying phosphate fertilizers. Adapted from (Rajan, 2002).
2.5.3
Lag Phase
The lag phase with annual PR application can be represented by the soil P concentration, which can
be 78 to <1% of the P concentration when applying SSP (Rajan, 2002). Longer term this lag phase is
described by Edmeades et al. (1992) as the time it takes to accumulate sufficient PR residuals in soil
so that the amount of P dissolved is >90% of the amount of PR P applied annually. They state this can
take 4-6 years, which is in agreement with (Mackay et al., 1984; Rajan, 2002). Scholefield et al. (1999)
illustrated this lag phase well when comparing Gasfa PR to triple super phosphate on ryegrass/white
clover pastures on acidic clay soils under high rainfall conditions in SW of England. Deeming the
content by weight around 25% compared to 9% for CRP rock and this trial was using TSP as their
reference fertilizer, which is slightly different to the trials identified above.
Contrary to this lag phase concept Gatiboni et al. (2003) found that without the addition of lime in
South Brazil high rainfall (1800mm) poorly drained soils, Gasfa PR had high agronomic effectiveness
73% of TSP in the first year and 124% in the 3rd year. This study was dealing with very acidic (pH
4.9-5.1) and very low P soils with resident native vegetation and applying PR at 65.5 kg P/ha. Under these
sever acidic and moist conditions it is not surprising the effectiveness of the PR, as a soluble P
fertilizer in these circumstances would be rapidly dissolved and prone to leaching and the conditions
heavily favour rapid PR dissolution. Davies (1984) found slightly different results with Gasfa PR,
finding it only 50% effective in the first year compared with super phosphate on a grassland trial at
146 kg P/ha. This study used soils with a pH of 5.5-6.5 which is a possible factor explaining the lower
effectiveness. Although this author still supports the lag phase with results demonstrating a strong
residual effect of the PR. These contradictory results highlight the variability amongst PR trials that
use PR of different origin, contrasting soil types, varying soil P retentiveness, varying climatic
conditions and differing pH which has a major effect on the dissolution of PR and its effectiveness.
2.5.4
Strategies for Improving Agronomic Effectiveness of Rock Phosphate
Any measure to increase the dissolution rate of PR will be beneficial to its agronomic effectiveness by
enhancing the P release into soil solution for plant uptake. Rajan (2002) suggests mixing PR with
elemental sulphur as a way to accelerate PR dissolution. The oxidation reaction of the S forms H2SO4,
which reacts with the PR to increase the rate of dissolution. Another widely studied technique is
partial acidulation of PR, however this method of manufacture was found to be not appropriate for
producing fertilisers that contain slow and fast release nutrients and sometimes lead to reduced
effectiveness (Condron et al., 1994; Di et al., 1994). Green manuring was suggested by Oladeji et al.
(2006) as the products of decomposition is believed to aid in the acidulation of the PR and its
dissolution and increase its effectiveness. However this study used Sokoto PR, which is high in P
(roughly 35% by weight compared to CRP of 9% by weight). Issues were also raised in terms of the
quality of the residue, with low quality (C/N ratio) residue leading to immobilisation in the initial
stages. Also high application rates of 4 T/ha and the benefit of this to a short rotation maize is
questioned and it is still unclear if it is the acidulation from the decomposition of plant residue which
is aiding the dissolution of PR in these tropical soils. Further understanding is needed due to the
effectiveness by increasing the surface area while granulating had the opposite effect. Lastly Van
Straaten (2006) reviewed techniques such as fusion and calcination, blending and granulation, ion
exchange, phospho-composting, bio solubilisation and micorrhizal inoculation all with varying rates
of success in improving the effectiveness of PR.
Techniques to improve the effectiveness of PR for direct application can be beneficial to some
farmers depending on their farm system and circumstances. However if PR is to be used as a viable
fertiliser for direct application it should be use in conditions and circumstances that aid dissolution.
Acidic soils with high rainfall are the best conditions and considerations of the reactivity and slow
release nature of PR must be considered in order to build up residual P in the soil to supply plants in
years following application.
2.6
Phosphate Rock Application in New Zealand
There has been limited work on PR trials in recent years, post the multitude of studies in the late
1980s and 1990s when interest in PR peaked in New Zealand. This is due in part to rapid
intensification of New Zealand’s farming systems and the push for increased pasture and legume
production, with soluble P fertilisers the most commonly used P source. The Olsen P test value is
seen as a benchmark for general soil fertility and for maintenance P status in legume based pastures,
and over the years has been the basis for recommendations of P fertiliser applications. The debate
surrounding PR dissolution in soil, its contribution to soil P status and limited plant P uptakes has
contributed to its unpopularity compared to soluble P fertilisers, where rapid P supply is needed for
legume growth, especially in the development phase of new land and farm intensification. Given its
limitations, PR applications can still be viable on land where a long-term view is adopted towards
raising soil fertility. Very acidic soils and depleted lands would be suitable for applications, with a
beneficial liming effect as well as P supply for depleted legume based pastures over a 3-5 year
period.
2.7
Conclusions
Phosphate rock fertilisers are known to be slow release. This characteristic can be both positive and
negative depending on the farming system to which it is applied. Under permanent pasture and
organic systems, PR can be a viable alternative to soluble P fertilisers as a steady state of P supply
over a long term is desired and organic systems are prohibited from using soluble P fertilisers.
Debate still remains over the extensive research comparing PR and superphosphate on their relative
agronomic performance, however more clearly understood are conditions for dissolution. Phosphate
liming effect to the soil. However it is inconclusive if this overcomes natural soil acidification and that
the liming effect is of benefit in conjunction with some agronomic benefit of the PR application.
Overall PR use has declined in popularity since the late 1980s and 1990s in favour of soluble P
fertilisers, however the case can still be made in appropriate locations and conditions for PR to be a
Chapter 3
Materials and Methods
3.1
Collection and Preparation of Materials
The soils used in this study were Gammack (sedimentary), Whanganui (volcanic), Chatham (organic)
and Wairarapa soil (experiment 2). All soils were collected prior to this experiment in bulk and each
soil sieved through a 5mm sieve. Four different types of sediment were used in this study, namely
DD44 whole, DD44<2mm, DD26 whole and DD26 <2mm as supplied by Chatham Rock Phosphate ltd.
Analysis of the sediment nutrient status was also supplied by the company and this is displayed for
the major nutrients at a range of application rates in Table 5. Hill Laboratories performed soil tests on
each soil prior to the experiment, with the results for a range of tests seen in Table 6. Over the 5
months duration of the 2 glasshouse experiments the temperature was maintained at an average of
17 degrees Celsius.
Table 6. Soil test results for Whanganui, Chatham, Gammack and Wairarapa soils.
Test Whanganui Chatham Gammack Wairarapa
pH 5.5 5.1 5.4 5.3
Resin P mg/kg 16 <4 30 25
Olsen P mg/kg 7 <1 25 12
Anion Storage Capacity % 100 100 23 50
Exchangeable Potassium me/100g 1 0.63 0.78 0.62
Exchangeable Calcium me/100g 9.8 2.5 4.5 4.4
Exchangeable Magnesium me/100g 2.1 1.93 1.73 1.19
Exchangeable Sodium me/100g 2.9 2.27 0.15 0.13
CEC me/100g 25 55 17 21
Total Base Saturation % 52 14 41 31
Volume Weight g/mL 0.92 0.53 0.89 0.74
Sulphate Sulphur mg/kg 50 15 3 12
Exchangeable Organic Sulphur mg/kg 8 4 7 8
Available Nitrogen kg/ha 160 49 138 119
Organic Matter % 15.2 47.1 8 9.7
Total Carbon % 8.8 27.3 4.6 5.6
Total Nitrogen % 0.79 0.57 0.39 0.51
C/N Ratio 11.1 47.9 12 11
Total Phosphorus mg/kg 818 214 409 567
3.2
Glasshouse Experiment 1
A glasshouse trial was set up in March 2015 to investigate the agronomic effectiveness of these
sediments from the Chatham Rise in 3 contrasting soils growing Italian ryegrass. 750 ml pots were
used for the Gammack and Whanganui soil and 500ml pots used for the Chatham soil due to limited
soil available. The species sown was Tabu Italian ryegrass (Lolium multiflorum). Sediments were
applied to each soil at a rate of 0,500,1000 and 2000 kg/ha each replicated 4 times.
All soils were sieved through a 5mm sieve with any plant debris or large peds removed. All sediments
were weighed out on a balance in batches of 4 replicates for each of the application rates and placed
in small plastic bags and labelled. 4 pots of soil was combined in a zip lock bag with the 4 replicates of
sediment and well mixed to ensure sediment was well distributed through the soil. Filter paper was
placed in the bottom of each pot then soil and sediment was placed evenly into the 4 pots and
labelled according to treatment. This process was repeated for all sediments and soils with the
control treatments prepared in the same manner with no sediment added.
3.2.1
Trial Design
Due to a lack of soil, not all sediments were tested in all soils. 4 sediments were tested at all rates in
the Gammack soil. Sediment DD44 whole, DD44<2mm and DD26 whole were tested at all rates in the
Whanganui soil. There was even less Chatham soil and this required using 500ml pots and only
sediment DD44 whole and DD44<2mm were tested at all rates. The number of soils and sediments
tested is displayed below in Table 7. All pots were arranged on the bench in the glasshouse in a
completely randomised design. Seeds were sown in the pots on 8/4/15 and covered with soil and
watered lightly for germination. More seeds were sown again on 20/4/15 to maintain full plant cover
over pots and maximise germination. Figure 10 shows plant growth and randomisation pre 1st
Table 7. Glasshouse experiment 1 design.
Sediment
Soil
Rate kg/ha
Replicates
DD44W
Gammack
0,500,1000,2000
4
DD44-
Gammack
0,500,1000,2000
4
DD26W
Gammack
0,500,1000,2000
4
DD26-
Gammack
0,500,1000,2000
4
DD44W
Whanganui
0,500,1000,2000
4
DD44-
Whanganui
0,500,1000,2000
4
DD26W
Whanganui
0,500,1000,2000
4
DD26-
Whanganui
0
DD44W
Chatham
0,500,1000,2000
4
DD44-
Chatham
0,500,1000,2000
4
DD26W
Chatham
0
DD26-
Chatham
0
3.2.2
Nitrogen and Sulphur Application
Over the course of the experiment nitrogen was applied to all pots on 6/5/15 and 19/6/15 at a rate
of 50 kg N/ha as ammonium sulphate. Ammonium sulphate was weighed out on a balance for the
112 750ml pots that were to receive nitrogen. This was dissolved in 1120 ml of water and applied at
10 ml of solution per pot. For the Chatham soil in the 500ml pots, ammonium sulphate was weighed
out on a balance for the 32 pots and dissolved in 320ml of water and then applied at 10ml of solution
per pot.
3.2.3
Harvesting
Plants in this experiment were harvested to a height of 2.5 cm 4 times on 26/5/15, 16/6/15, 9/7/15
and a final harvest to soil level on 3/8/15. Harvested forage was placed in a paper bag and labelled
with the corresponding pot number. Samples were then dried in an oven for 48 hours at 60 degrees
Celsius. The dry weight of each sample was then weighed on a balance and recorded. At each
consecutive harvest the forage was added to the appropriate bag and the drying, weighing and
recording of dry weight repeated.
3.2.4
Sample Analysis
After the 4th harvest, the dried samples were bulked together in replicates and machine ground. The
bulking of replicates was needed to provide enough weight for analysis and to save cost. Ground
material was then placed in pottles and labelled according to treatment and sent away for
phosphorus uptake analysis at Hills Laboratories. Samples were oven dried overnight at 62 degrees
following a digestion in nitric acid/hydrogen peroxide followed by ICP-OES analysis for P percentage.
3.2.5
pH Sampling
After the final harvest a soil core was taken from every pot and placed in a plastic pottle and labelled
with the corresponding pot number. Samples were air dried for 5 days at 35 degrees. Samples were
then weighed on a balance to 10g of dried soil and 25ml of deionised water added. Samples were
shaken for 30 minutes in an end over end shaker and left to settle over night. A pH meter was used
to measure pH of each sample, with recalibration of the pH meter every 15 samples using a pH 4 and
pH 7 buffer solutions.
3.3
Glasshouse Experiment 2
During the first glasshouse experiment once some agronomic benefit of the sediment had been
established a second experiment was set up to compare the effects of the sediment (DD44 whole) to
triple superphosphate and Chatham rock phosphate when applied at the same rate of P. Wairarapa
soil was used for its low P levels and two different pasture species sown, Italian ryegrass (Lolium
multiflorum) and white clover (Trifolium repens).
Soil was sieved to 5mm to remove plant material and large peds. The sediment, used at a rate of
1000 kg/ha or 18 kg P/ha, was weighed out on a balance for 4 replicates and combined with 25g of
silica sand and shaken in a container. Four 750 ml pots of sieved soil was combined in a zip lock bag
with the sediment/sand and thoroughly mixed. Filter paper was placed at the bottom of each pot
then the soil was distributed evenly into 4 pots and labelled according to its treatment. This process
was repeated for the Chatham rock phosphate and triples superphosphate each weighed out and
applied at a rate of 18 kg P/ha and combined with 25g of sand. Control treatments were prepared in
the same manner but with nothing added to the soil. This process was repeater for the other 16
replicates that would be sown with the second pasture species. The trial design can be seen below in
Table 8
The ryegrass and white clover seeds were scattered onto their corresponding pots according to the
trial design and covered with soil and lightly watered on 17/6/15 Figure 11. Pots were then arranged
on the bench in a completely randomised design.
Table 8. Glasshouse experiment 2 design.
Sediment Soil Rate kg P/ha Replicates Crop % P
DD44W Wairarapa 18kg P/ha 4 Ryegrass 1.76 TSP Wairarapa 18kg P/ha 4 Ryegrass 21.06 CRP Wairarapa 18kg P/ha 4 Ryegrass 8.72 Control Wairarapa 0 kg P/ha 4 Ryegrass
Figure 11. Second experiment pre randomisation and first harvest.
3.3.1
Nitrogen and Sulphur Application
All pots received nitrogen applications of 50 kg N/ha as ammonium sulphate on 20/7/15 and
24/8/15. Ammonium sulphate was weighed out on a balance for the 32 pots and dissolved in 320 ml
of water with 10ml of solution was applied to each pot.
3.3.2
Harvesting
Three harvests of the ryegrass were taken on the 21/7/15, 18/8/15 to 2.5cm and the final harvest to
ground level on 7/9/15. Only 1 harvest of the clover was taken to ground level on 7/9/15. Harvested
forage was placed in a paper bag and labelled with the corresponding pot number. Samples were
then dried in an oven for 48 hours at 60 degrees Celsius. The dry weight of each sample was then
weighed on a balance and recorded. At each consecutive harvest the forage was added to the
appropriate bag and the drying, weighing and recording of dry weight repeated.
3.3.3
Sample Analysis
Phosphorus uptake analysis by Hills Laboratories. Samples were oven dried overnight at 62 degrees
following a digestion in nitric acid/hydrogen peroxide followed by ICP-OES analysis for P percentage.
3.3.4
pH Analysis
After final harvest a soil core was taken from every pot and placed in a plastic pottle and labelled
with the corresponding pot number. Samples were air dried for 5 days at 35 degrees. Samples were
then weighed on a balance to 10g of dried soil and 25ml of deionised water added. Samples were
shaken for 30 minutes in an end over end shaker and left to settle over night. A pH meter was used
to measure pH of each sample, with recalibration of the pH meter every 15 samples using a pH 4 and
pH 7 buffer solution.
3.4
Statistical Analysis
Statistical analysis was done using the statistical analysis software Genstat with one and two way
analysis of variance (ANOVA). Least significant difference (LSD) was used to compare means with
P<0.05 used to determine significance level. Excel was used to record data, calculate means and
Chapter 4
Results
This project was designed around 2 objectives. The first to test the agronomic effectiveness of
different sediments in a range of contrasting soils and the second was to compare the effectiveness
of a selected sediment to other P fertilisers at the same rate of P. Due to the 2 objectives and the 2
experiments, results have been divided into 2 sections with the initial dry weight results presented,
followed by P uptake and pH data for each experiment.
4.1
Glasshouse Experiment 1
4.1.1
Dry Matter Yields
Table 9 displays mean dry matter (DM) yield data of Italian ryegrass after 4 harvests. There was no
significant increase in DM as a result of sediment application across any of the 3 soils used in this
experiment. There was some indication of increased DM yield with the highest application rate;
however there was a large amount of variation in the data and this was neither consistent among
sediments nor consistent in each soil type.
Table 9. Mean dry matter yield mg/pot of Italian ryegrass in response to varying rates of sediments in a range of soils. Sediments compared within soils, NS= non-significant difference.
4.1.2
Phosphorus Uptake
Table 10 displays mean P uptake per pot of Italian ryegrass as effected by sediment application at a
range of rates. Results of P uptake were inconclusive between sediments and rates of application
between each sediment in the various soils. In the Chatham soil there was a significant increase in P
uptake of 128 and 126 mg/pot for sediments DD44- and DD44W respectively at 1000 kg/ha against
fluctuating P uptake results, large data variability and no clear evidence of greater uptake with higher
rates of sediment application. There was no significant effect present for increased P uptake with
increased application rate in the Whanganui soil.
Table 10. Mean P uptake mg/pot of Italian ryegrass in response to varying rates of sediments in a range of soils. Sediments compared within soils. Means with the same letters are not significantly different, NS= non-significant difference.
4.1.3
Soil pH
Application of Chatham rise sediments had a liming effect on all soils in this experiment. Application
rates of 2000 kg/ha had the greatest liming effect for each sediment in every soil, except DD44- in
Chatham soil where 1000 kg/ha of DD44W resulted in a soil pH of 4.93, significantly higher than any
other application rate (P=0.01) Table 11. In the Whanganui soil applications of DD26W sediment at
2000 kg/ha resulted in a significantly increased soil pH of 5.47 compared to the control 4.96 (P<0.01)
an increase of 10.28%. There was no significant difference in soil pH between application rates of 500
or 1000 kg/ha, however both rates significantly increased pH compared to the control (P<0.01). In
the Gammack soil a similar trend was observed with 2000 kg/ha of DD26- resulting in significant
increase in soil pH to 5.37 compared to the control of 4.8, the largest increase of all sediments 11.9%
(P<0.001). DD26W had a similar effect, significantly raising soil pH to 5.2 against the control of 4.8
Table 11. Mean pH/pot in response to varying rates of sediments in a range of soils growing Italian ryegrass. Sediments compared within soils. Significant rate term for Whanganui and Chatham soil and significant interaction term for Gammack soil. Means with the same letters are not significantly different, NS=non-significant difference.
4.2
Glasshouse Experiment 2
4.2.1
Dry Matter Yields
Figure 12. Mean dry matter yield mg/pot of Italian RG and WC in response to a range of P fertilizers. Means compared within pasture type.
Figure 12 shows mean DM yield of Italian ryegrass after 3 harvests and white clover after 1 harvest to
Chapter 5
Discussion
5.1
Glasshouse Experiment 1- Relative Agronomic Effectiveness of Different
Sediment Materials
Dry matter (DM) yield data gathered from 4 herbage cuts failed to show any significant increase from
application of sediments at a range of application rates. There was large variation in the data and no
indication of any particular sediment or application rate causing a significant increase in DM yield.
When compared within each soil, again there were no clear relationships able to be drawn about any
one sediment performing better in a particular soil.
The lack of DM yield response in the first experiment was the first indication of the ineffectiveness of
these sediments, and P uptake data was used to support these findings. Results from the P uptake
data were inconsistent across soil type, with sediment application showing no significant effect in the
Whanganui soil and only a marginal effectiveness in the Chatham and Gammack soils. The large
variability in data and minimal significant results supports the findings from the DM yield data that
these sediments were ineffective as judged by these measures. Also there seemed to be some
evidence of possible suppression of P uptake at the 2000 kg/ha application rate, however this was
not investigated further.
An interesting positive finding to come out of the first experiment was the liming effect all sediments
had in all of the soils tested. All sediments reacted differently in terms of their liming effect and some
sediments had a greater liming effects in particular soils compared to other soils. The DD26
sediments in the Gammack soil demonstrated the largest liming potential of all the sediments tested.
The soil pH increase was greatest in its ground form while the whole form resulted in a slightly lower
liming effect. This was evident also in the Whanganui soil where the DD26 sediments generally out
performed the DD44 sediments with their liming ability. In the Chatham soil, where only the DD44
sediments were tested, soil pH increased by 0.1 of a unit, however this is from a control pH 4.71, the
most acidic soil in this trial. The lack of liming response seen in the Chatham soil was due to the high
buffering capacity, as soil buffering capacity is strongly correlated with soil carbon levels R=0.76
(Curtin & Trolove, 2013). The Chatham soil has 27.3% soil carbon, which is roughly 5 times greater