EQUIVALENCY FACTOR USING OPTIMIZATION FOR INDIAN
MIXED TRAFFIC CONDITION
Chetan Patel1, Gaurang Joshi2
1, 2 Sardar Vallabhbhai National Institute of Technology, 395007, India
Received 5 November 2013; accepted 14 January 2015
Abstract:The term Equivalency Factor as PCE was introduced in the 1965 by HCM. And after that, considerable research effort has been carried toward to estimate PCE value. The present empirical study is to determine the dynamic equivalency factor for mix traffic condition in Indian context. For that car as reference vehicle is considered this termed as Dynamic Car Unit (DCU). Speed and Volume studies during the peak hour are carried out and based on the observed data dynamic car unit using modified homogenization coefficient approach is calculated. The wide ranges of DCU values for different location are observed based on the side friction, composition, wide ranging traffic characteristics and lane width. To have the unique value of the DCU optimization method is used. Based on the optimization final values of the DCU are frizzed which will be utilised to present the traffic stream volume in terms of equivalent passenger cars.
Keywords:equivalency factor, dynamic car unit, modified homogenization coefficient, optimization.
1. Introduction
Traffic in the Indian condition is highly heterogeneous in nature and because of the wide ranges of static and dynamic characteristic it is worth to express all the vehicles in the traffic stream in terms of equivalent passenger cars. Basically the derivation of passenger car equivalent is carried out by comparing the influence of a vehicle entering into a stream of homogenous traffic on the speed of the standard or reference vehicle. It is evident that the effect of interference from other vehicles to the movements of the reference vehicle is significantly affected by the flow rate
composition and roadway conditions, the vehicle equivalent factor is most likely to vary as the flow rate and speed of the stream which changes from time to time. This is more relevant in urban areas where hourly variations of flow rate are quite significant. Under such circumstances, it is desirable to derive the vehicle equivalent factors which take care of the fluctuations in stream speed and also the speed of the individual vehicles for the urban roadway.
of India. Multilane arterial mid-block road sections in seven metropolitan cities; Lucknow, Kanpur, Jaipur, Patna, Surat, Pune and Thiruvananthapuram are selected for the study. The selected cities have significant difference in the socio-economic characteristics, city size and structure, vehicle types, predominant transportation modes, traffic volumes, traffic control conditions and road widths. The terrain is flat and road stretches are straight and free from effect of intersections, hence vehicles are assumed having a constant speed. Based on the data analysis significant variation in the speed and flow rate is observed in one minute duration. This lager variation in the speed and corresponding flow rate has wide range of equivalency factor and hence it is difficult to decide the unique value of the equivalency factor. Also it is not worth to consider the mean values of the equivalency factor as the flow rate variation and composition at that f low affect the equivalency factor and results in to larger error in representing all vehicles in the same unit. To have the single unique values for equivalency factor optimization technique is used. Using linear model and considering constrains of the maximum and minimum values of the equivalency factor unique values of equivalency factor is freeze by minimizing the error. The final values of the equivalency factor are more realistic than to have the average value to represent all the vehicles in the single unit for mix traffic environment.
1.1. Data Collection and Study Area
Table 1
Traffic and Roadway Characteristic of Arterial Road in Indian City
City Carriageway width(m) Maximum Flow rate(veh/hr)
Free Flow Stream Speed (kmph)
Vehicle Composition (%)
2W
he
ele
r
3W
he
ele
r
Ca
r
M
ini B
us
St
and
ar
d B
us
LC
V
Tr
uck
Bic
ycle
PEDR
XW
PA
T
N
A 10.5
(Six Lane Divided) 3712veh/hr 35 kmph 30 25 17 6 5 4 5 19 14
PU
N
E 11.6m
(Six Lane Divided) 12292veh/hr 41 kmph 62 11 20 3 3 2 2 3
-T
R
IV
E
N
DR
U
M 9.0m(Four Lane
Divided) 4137veh/hr 49 kmph 52 10 32 3 5 5 4 4
-JA
IPU
R 10.5m
(Six Lane Divided) 8873veh/hr 50 kmph 58 7 28 3 4 3 1 4 2
K
A
N
PU
R 10.9m
(Six Lane Divided) 5148veh/hr 30 kmph 51 2 8 2 2 2 2 22 18
LU
C
K
NO
W 10.5m
(Six Lane Divided) 8116veh/hr 32 kmph 47 18 15 2 2 3 1 10 7
SU
R
AT 7.5m(Four Lane
Divided)
11203
-Free flow speed during the morning off peak time is measured when the vehicles are maintaining the higher headway. The width of the road is 10.5 m except Pune where due to bus bay the carriageway width is 11.5 m. Roads in Patna, Kanpur and Lucknow are having the effect of side friction due to parked vehicles along the edge. Arterial Road of the Surat city is having all motorized traffic which can be taken as base case for modeling the effect of the NMV. The arterial road of Trivandrum, Pune and Jaipur having very less proportion of the NMV (1% - 5%), whereas Lucknow city arterial road having NMV in the range of 5% - 10%. The arterial road in Kanpur and Patna has major shares of the NMV in variation of 10% - 30%.
2. Dynamic Equivalent Factor
The Highway Capacity Manual (1965) used Walker Method to estimate a passenger car equivalents (PCE) value, which compares the relative number of passing of trucks by passenger cars in relation to number of passing of passenger car by passenger cars. Mcshane and Roess (1990) stated that equal density approach will be more appropriate for equivalency unit since density is the primary parameter for LOS. Chandra and Kumar (2003) obtained passenger car unit (PCU) values for different carriageways widths. The finding was that the PCU for a vehicle type increases linearly with the width of carriageway which is due to the greater freedom of movement on wider roads. Rahman et al. (2003) introduced a method for estimating (PCE) for non-motorized vehicle – Rickshaws on two mid-block sections of Dhaka metropolis, Bangladesh. This PCE estimate is based on the speed difference of mixed flow and basic flow of passenger cars. They concluded that there is a linear relationship between PCE value
are not static and prime factors affecting PCU are traffic volume, traffic composition and roadway conditions. No comprehensive guideline for PCU values is still prepared for Indian mixed traffic condition which takes into account all these influencing factors.
There are various methods for determination equivalency factor, i.e. Homogenization coefficient method, Walker’s method, Headway method, multiple linear regression method and Simulation techniques. The approach suggested by Chandra and Sikdar (2000) seems more suitable due to its simplicity and as it takes into account horizontal projected area and speed of vehicle which are prime influencing characteristics of a vehicle in heterogeneous traffic stream which was utilized here for the determination of Dynamic Car Unit (DCU).
The dynamic equivalent factor includes effect of vehicular speed on the traffic interaction and interference. The speed and maneuverability of the vehicles in stream is generally governed by the vehicles which has high proportion in the stream. In the present study, dynamic vehicle equivalent factors are estimated considering car as the reference vehicle. Using Satish Chandra’s (2000) modified homogenization co-efficient approach; effect of static characteristics is incorporated by comparing projected area
of reference vehicle and the other vehicle in terms of area ratio, whereas Speed ratio described as ratio of speed of reference vehicle to the other vehicle is adopted to include effect of speed differential as dynamic characteristics. It may be noted that area ratio remains constant for a vehicle type under all the flow condition, while speed ratio varies dynamically with the flow rate.
Mathematically,
) )/(Ac/Ay (Vc/Vy
=
DEFc (1)
Where,
DEFc: Dynamic Vehicle Equivalent Factor considering ‘car’ reference vehicle
Vc/Vy: Speed Ratio Ac/Ay: Area Ratio
Vc: Spot speed of ‘car’ reference vehicle Vy: Spot speed of ‘y’ vehicle
Ac: Projected area of ‘car reference vehicle Ay: Projected area of ‘y’ reference vehicle
Speed and volume of vehicles are measured during every minute of traffic study for about four hours on selected arterial roads of six cities. Separate DEF are computed for each city to reflect the effect of roadway condition, traffic condition and local effect on DEF.
2.1. Area Ratio (α)
Area ratio is important criteria for finding Dynamic Equivalent Factor in modified
Table 2
Area Ratio
Sr. No. Vehicle Projected Area of vehicle (m2)
Area Ratio
Car (Reference vehicle )
1 Two Wheeler (2W) 1.48 3.86
2 Three Wheeler (3W) 3.28 1.74
3 Car 5.72 1.00
4 Mini Bus 15.18 0.38
5 Std. Bus 25.73 0.22
6 Light Commercial Vehicle (LCV) 7.50 0.76
7 Truck 17.63 0.32
8 Cycle 0.86 6.65
9 Pedal Rickshaw 2.57 2.23
2.2. Speed Ratio
Speed ratio of reference vehicle and the vehicle category under consideration is the only dynamic parameter because area ratio remains constant for each vehicle category. The speed of the reference vehicle becomes higher compared to other vehicle DEF for that vehicle becomes high. This indicates greater impedance
to the reference vehicle. Near capacity condition speed ratio becomes one because at that time all vehicles move at the same speed. Table 3 shows speed ratio statistics for Vidhansabha road of Lucknow city. It is observed that average speed of Car remains high than that of all other categories except for two-wheelers. Standard deviation for 2W and 3W categories is less compared to all other categories.
Table 3
Speed Ratio Statistics for Vidhansabha Road (Lucknow)
Vehicle Category Speed Ratio (Car as reference vehicle)2W 3W MB SB LCV TRK CYCL PEDRXW
Max 1.46 1.87 2.02 1.82 2.70 1.97 3.64 5.47
Min 0.59 0.74 0.84 0.70 0.49 0.89 1.25 1.22
Average 0.91 1.11 1.24 1.19 1.20 1.27 2.25 3.09
Std. Dev. 0.13 0.15 0.26 0.25 0.29 0.29 0.42 0.68
Table 4 shows speed ratio statistics for Dr. Ambedkar road of Kanpur city. It is observed that average speed of Car remains high than
that of all other categories except two-wheelers. Standard deviation for 2W, 3W, LCV and truck categories is less compared to others.
Table 4
Speed Ratio Statistics for Dr. Ambedkar Road (Kanpur) Vehicle Category Speed Ratio (Car as reference vehicle)
2W 3W MB SB LCV TRK CYCL PEDRXW
Max 1.31 1.57 2.08 1.58 1.14 1.20 3.33 3.24
Min 0.52 1.06 0.69 0.68 0.78 1.07 1.03 1.04
Average 0.86 1.37 1.12 1.13 0.99 1.14 1.67 1.79
Table 5 shows speed ratio statistics for Jawaharlal Nehru road of Jaipur city. It is observed that average speed of Car remains high than that of all other categories. Standard
deviation for 2W category is less compared to all other categories. Average speed ratio for non motorized vehicles is high compared to that observed in Lucknow and Kanpur.
Table 5
Speed Ratio Statistics for J L Nehru Road (Jaipur)
Vehicle Category Speed Ratio (Car as reference vehicle)
2W 3W MB SB LCV TRK CYCL PEDRXW
Max 1.35 2.53 3.40 1.58 2.87 1.71 4.87 8.65
Min 0.79 1.08 0.97 0.92 0.83 1.62 2.30 3.53
Average 1.07 1.40 1.60 1.28 1.40 1.66 3.18 6.12
Std. Dev. 0.12 0.23 0.56 0.22 0.37 0.06 0.55 1.59
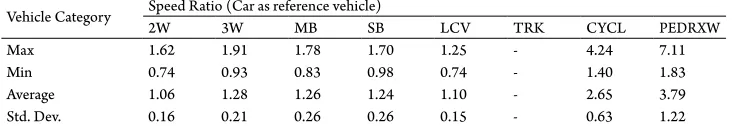
Table 6 shows speed ratio statistics for Fraser road of Patna city. It is observed that average speed of Car remains high than that of all
other categories. Average speed ratio for non motorized vehicles is high compared to that of Lucknow and Kanpur cities.
Table 6
Speed Ratio Statistics for Fraser Road (Patna) Vehicle Category Speed Ratio (Car as reference vehicle)
2W 3W MB SB LCV TRK CYCL PEDRXW
Max 1.62 1.91 1.78 1.70 1.25 - 4.24 7.11
Min 0.74 0.93 0.83 0.98 0.74 - 1.40 1.83
Average 1.06 1.28 1.26 1.24 1.10 - 2.65 3.79
Std. Dev. 0.16 0.21 0.26 0.26 0.15 - 0.63 1.22
Table 7 show speed ratio statistics for arterial road of Surat city. It is observed that average speed of Car remains high than that of all other categories. Average speed ratio for all vehicle
categories is high compared to all cities which is due to moderate traffic volume in access controlled condition and very less proportion of non-motorized slow moving vehicles.
Table 7
Speed Ratio Statistics for Flyover (Surat)
Vehicle Category Speed Ratio (Car as reference vehicle)
2W 3W MB SB LCV TRK CYCL PEDRXW
Max 2.53 2.74 2.18 2.16 2.91 2.36 5.29
-Min 0.90 0.97 1.07 1.45 1.08 1.40 1.26
-Average 1.57 1.64 1.68 1.73 1.73 1.74 3.66
-Table 8
Speed Ratio Statistics for Maharshi Karve Road (Pune) Vehicle Category Speed Ratio (Car as reference vehicle)
2W 3W MB SB LCV TRK CYCL PEDRXW
Max 1.30 1.57 1.98 1.92 2.93 1.64 4.16
-Min 0.64 0.78 0.70 0.54 0.48 0.44 0.84
-Average 0.91 1.08 1.04 1.06 1.08 1.14 2.11
-Std. Dev. 0.12 0.15 0.21 0.29 0.33 0.27 0.73
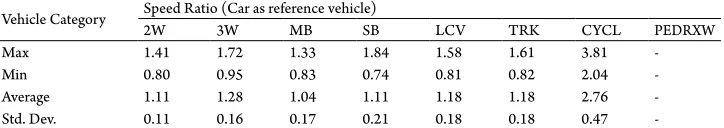
-Table 9 show speed ratio statistics for Kawadiar road of Thiruvananthapuram city. It is observed that average speed ratio
for all vehicle categories is more than 1.0 which is due to moderate traffic volume and less proportion of non-motorized vehicles.
Table 9
Speed Ratio Statistics for Kawadiar Road (Thiruvananthapuram)
Vehicle Category Speed Ratio (Car as reference vehicle)2W 3W MB SB LCV TRK CYCL PEDRXW
Max 1.41 1.72 1.33 1.84 1.58 1.61 3.81
-Min 0.80 0.95 0.83 0.74 0.81 0.82 2.04
-Average 1.11 1.28 1.04 1.11 1.18 1.18 2.76
-Std. Dev. 0.11 0.16 0.17 0.21 0.18 0.18 0.47
-3. Dynamic Car Unit (DCU)
Dynamic Car Unit (DCU) is calculated for every 1 minute interval of observation. The area ratios for each vehicle type considering Car as reference vehicle are calculated and are shown in above section 2.1. The speed
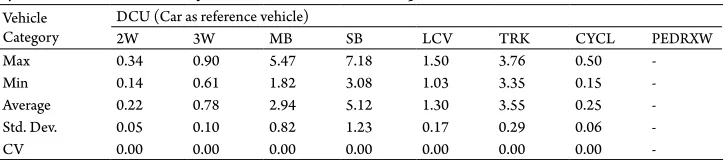
ratios are also derived for these vehicles and are discussed in section 2.2. The DCU is then derived using Eq. (1). The calculated Dynamic Car Unit (DCU) Car as reference vehicles are given in following section. Table 10 shows Dynamic Car Unit (DCU) statistics for Vidhansabha road of Lucknow city.
Table 10
Dynamic Car Unit Statistics for Vidhansabha Road (Lucknow) Vehicle
Category
DCU (Car as reference vehicle)
2W 3W MB SB LCV TRK CYCL PEDRXW
Max 0.34 0.90 5.47 7.18 1.50 3.76 0.50
-Min 0.14 0.61 1.82 3.08 1.03 3.35 0.15
-Average 0.22 0.78 2.94 5.12 1.30 3.55 0.25
-Std. Dev. 0.05 0.10 0.82 1.23 0.17 0.29 0.06
-CV 0.00 0.00 0.00 0.00 0.00 0.00 0.00
-Table 11 shows speed ratio statistics for Dr.
Table 11
Dynamic Car Unit Statistics for Dr. Ambedkar Road (Kanpur) Vehicle
Category
DCU (Car as reference vehicle)
2W 3W MB SB LCV TRK CYCL PEDRXW
Max 0.34 0.90 5.47 7.18 1.50 3.76 0.50
-Min 0.14 0.61 1.82 3.08 1.03 3.35 0.15
-Average 0.22 0.78 2.94 5.12 1.30 3.55 0.25
-Std. Dev. 0.05 0.10 0.82 1.23 0.17 0.29 0.06
-CV 0.00 0.00 0.00 0.00 0.00 0.00 0.00
-It is observed that DCU values for 2W varies from 0.34 to 0.14 with average value of 0.22, for 3W DCU values varies from 0.90 to 0.61 with average value of 0.78, Variation of 5.47 to 1.82 with mean value of 2.94 DCU for MB, whereas for SB DCU values varies from
7.18 to 3.08 with average value 5.12, for LCV DCU values varies from 1.50 to 1.03 with mean value of 1.30, DCU value for truck varies from 3.76 to 3.35 with average value of 3.55 and for Cycle DCU value varies from 0.50 to 0.15 with average value of 0.25.
Table 12
Dynamic Car Unit Statistics for J L Nehru Road (Jaipur) Vehicle Category DCU (Car as reference vehicle)
2W 3W MB SB LCV TRK CYCL PEDRXW
Max 0.35 1.46 8.95 7.18 3.78 5.33 0.73 3.88
Min 0.21 0.62 2.57 4.17 1.10 5.05 0.00 1.58
Average 0.27 0.80 4.21 5.80 1.85 5.19 0.46 2.75
Std. Dev. 0.03 0.13 1.47 1.02 0.49 0.20 0.13 0.71
CV 0.11 0.16 0.35 0.18 0.26 0.04 0.27 0.26
It is observed from Table 12 that DCU values for 2W varies from 0.35 to 0.21 with average value of 0.27, for 3W DCU values varies from 1.46 to 0.62 with average value of 0.80, Variation of 8.95 to 2.57 with mean value of 4.21 DCU for MB, whereas for SB DCU values varies from 7.18 to 4.17 with average
value 5.8, for LCV DCU values varies from 3.78 to 1.10 with mean value of 1.85, DCU value for truck varies from 5.33 to 5.05 with average value of 5.19 and for Cycle DCU value varies from 0.73 to 0.15 with average value of 0.46 and for pedal rickshaw DCU varies from 3.88 to 1.58 with mean value of 2.75.
Table 13
Dynamic Car Unit Statistics for Fraser Road (Patna)
Table 13 presents the DCU for Patna arterial road, DCU values for 2W varies from 0.42 to 0.19 with average value of 0.27, for 3W DCU values varies from 1.10 to 0.53 with average value of 0.73, Variation of 4.69 to 2.18 with mean value of 3.31 DCU for MB, whereas for
SB DCU values varies from 7.72 to 4.44 with average value 5.62, for LCV DCU values varies from 1.65 to 1.02 with mean value of 1.45, for Cycle DCU value varies from 0.64 to 0.21 with average value of 0.4 and for pedal rickshaw DCU varies from 3.19 to 0.82 with mean value of 1.7.
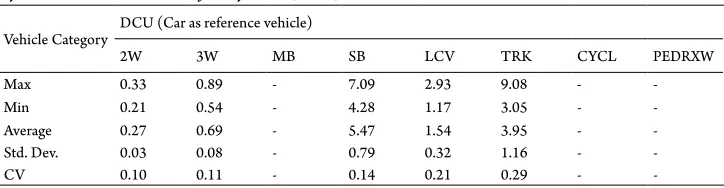
Table 14
Dynamic Car Unit Statistics for Fly Over (Surat)
Vehicle Category DCU (Car as reference vehicle)
2W 3W MB SB LCV TRK CYCL PEDRXW
Max 0.33 0.89 - 7.09 2.93 9.08 -
-Min 0.21 0.54 - 4.28 1.17 3.05 -
-Average 0.27 0.69 - 5.47 1.54 3.95 -
-Std. Dev. 0.03 0.08 - 0.79 0.32 1.16 -
-CV 0.10 0.11 - 0.14 0.21 0.29 -
-It is observed form Table 14 that DCU values for 2W varies from 0.33 to 0.21 with average value of 0.27, for 3W DCU values varies from 0.89 to 0.54 with average value of 0.69, Variation of 7.09 to 4.28 with mean
value of 5.47 DCU for SB, whereas for LCV DCU values varies from 2.93 to 1.17 with average value 1.54, for Truck DCU values varies from 9.08 to 3.05 with mean value of 3.95.
Table 15
Dynamic Car Unit Statistics for Maharshi Karve Road (Pune)
Vehicle Category DCU (Car as reference vehicle)2W 3W MB SB LCV TRK CYCL PEDRXW
Max 0.34 0.90 5.20 8.73 3.86 5.14 0.63
-Min 0.16 0.45 1.85 2.47 0.63 1.38 0.13
-Average 0.24 0.62 2.73 4.83 1.42 3.58 0.32
-Std. Dev. 0.03 0.09 0.55 1.33 0.44 0.84 0.11
-CV 0.13 0.14 0.20 0.28 0.31 0.23 0.35
-It is observed from Table 15 that DCU values for 2W varies from 0.34 to 0.16 with average value of 0.24, for 3W DCU values varies from 0.9 to 0.45 with average value of 0.62, Variation of 5.20 to 1.85 with mean value of 2.73 DCU for MB, whereas for SB DCU values
Table 16
Dynamic Car Unit Statistics for Kawadiar Road (Thiruvananthapuram) Vehicle Category DCU (Car as reference vehicle)
2W 3W MB SB LCV TRK CYCL PEDRXW
Max 0.37 0.99 3.51 8.35 2.08 5.04 0.57
-Min 0.21 0.54 2.19 3.38 1.06 2.56 0.31
-Average 0.29 0.74 2.73 5.04 1.55 3.69 0.42
-Std. Dev. 0.03 0.09 0.44 0.94 0.24 0.68 0.07
-CV 0.10 0.13 0.16 0.19 0.15 0.18 0.17
-Table 16 shows the DCU variation in Thiruvananthapuram arterial road, DCU values for 2W varies from 0.37 to 0.21 with average value of 0.29, for 3W DCU values varies from 0.99 to 0.54 with average value of 0.74, Variation of 3.51 to 2.19 with mean value of 2.73 DCU for MB, whereas for SB DCU values varies from 8.35 to 3.38 with average value 5.04, for LCV DCU values varies from 2.08 to 1.06 with mean value of 1.55, DCU value for truck varies from 5.04 to 2.56 with average value of 3.69 and for Cycle DCU value varies from 0.57 to 0.31 with average value of 0.42.
4. Dynamic Vehicle Equivalent Factor
Using Optimization
A bove sec t ion d isc ussed t he DEF using Car as reference vehicles-DCU
Table 17
Dynamic Car Unit Statistics Using Optimization
Vehicle Category DCU (Car as reference vehicle)2W 3W MB SB LCV TRK CYCL PEDRXW
Kanpur 0.22 0.78 2.94 5.12 1.30 3.55 0.25
-Jaipur 0.27 0.79 3.87 5.97 1.70 5.05 0.35 3.71
Patna 0.19 0.69 3.81 7.71 1.02 - 0.23 1.52
SuratMFly 0.28 0.76 - 5.46 1.34 3.61 -
-Pune 0.23 0.58 2.75 4.82 1.47 3.99 0.63
-TVM 0.29 0.62 2.86 4.96 1.80 4.23 0.31
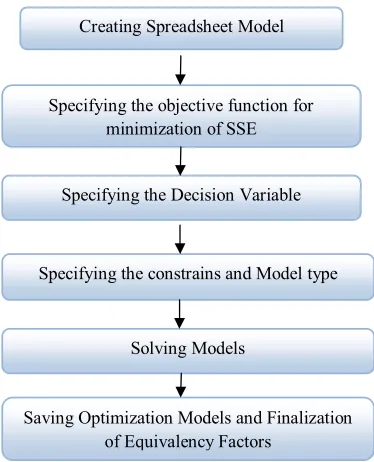
-Fig. 2.
Flow Chart for Optimization of DCU Values
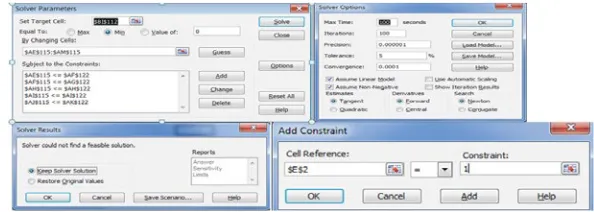
In excel solver create model by specifying the total value of the DCU by aggregating the product of numbers of vehicles in each class and mean equivalency factor of that class. Set the objective function of minimizing the sum of square error by changing the various values of DCU. The decision variable here is the mean values of equivalency factor of each class of vehicles. Based on the decision variables the constraint are selected in such a way
Kanpur Jaipur Patna Surat Puna Trivendrum 0.10 0.15 0.20 0.25 0.30 0.35 0.40 0.45 Range Kanpur Jaipur Patna Surat Puna Trivendrum
Kanpur Jaipur Patna Surat Puna Trivendrum 0.4 0.6 0.8 1.0 1.2 1.4 1.6 Range Kanpur Jaipur Patna Surat Puna Trivendrum
Vehicle Category: 2 Wheeler Vehicle Category: 3 Wheeler
Kanpur Jaipur Patna Surat Puna Trivendrum 0 2 4 6 8 10 Range Kanpur Jaipur Patna Surat Puna Trivendrum
Kanpur Jaipur Patna Surat Puna Trivendrum 1 2 3 4 5 6 7 8 9 10 Range Kanpur Jaipur Patna Surat Puna Trivendrum
Vehicle Category: Mini Bus Vehicle Category: Standard Bus
Kanpur Jaipur Patna Surat Puna Trivendrum 0.0 0.5 1.0 1.5 2.0 2.5 3.0 3.5 4.0 4.5 Range Kanpur Jaipur Patna Surat Puna Trivendrum
Kanpur Jaipur Patna Surat Puna Trivendrum 0 2 4 6 8 10 Range Kanpur Jaipur Patna Surat Puna Trivendrum
Vehicle Category: LCV Vehicle Category: Truck
Kanpur Jaipur Patna Surat Puna Trivendrum 0.0 0.1 0.2 0.3 0.4 0.5 0.6 0.7 0.8 0.9 Range Kanpur Jaipur Patna Surat Puna Trivendrum
Kanpur Jaipur Patna Surat Puna Trivendrum -1 0 1 2 3 4 Range Kanpur Jaipur Patna Surat Puna Trivendrum
Above Table 17 shows the final values based on the optimization technique. The most referred guidelines IRC in India specified the higher values than the present Equivalency factor. Researches carried out for the equivalency are having the similar values.
5. Study Inferences and Conclusion
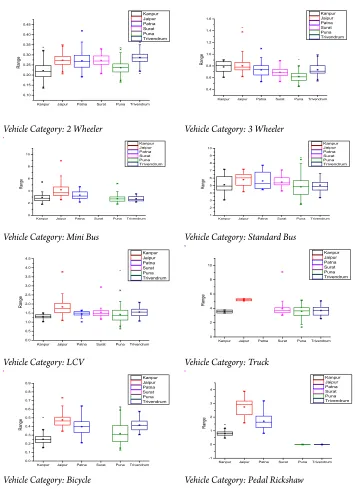
The present empirical study is to determine the optimal value of dynamic equivalency factor considering car as reference vehicle in various cities of India. Modified homogenization co-efficient approach as speed ratio to area ratio is used for determination of Dynamic Car Unit and following box plot shows the inference of the study.
From the above box plot in Fig. 3, it is clear that the less variation in the values of DCU for 2- Wheeler (2w), 3-Wheeler (3w), Mini Bus, LCV and Truck, whereas more variation in Standard bus, Bicycle and Pedal Rickshaw is observed. For 2w category and 3w category DCU values for the Kanpur city is more spread out, all the cities having less skewed data for 2w and 3w category. The unequal spread is observed because of the change in the composition of the vehicles and the flow rate also the variation in the DCU values are due to the Non motorized vehicles and the sided friction prevailing on the road. It is found that, the suggested DCU values are decreasing with increase in flow rate. At higher volume, at higher composition of NMV, the bikes and bicycles DCU values are more or less same. The composition of vehicles that are smaller than the cars is more, then the DCU values increases with increase in flow rate. At higher volume levels, at the side friction, the DCU values of bikes and bicycles are more or less same.
Due to this vast variation and the unequal spread and asymmetry about mean the optimization techniques was used. The values using the optimization technique is more nearer to mean value of DCU for each category of vehicles. The values of Passenger Car Equivalency (PCU) prescribed by the Indian Road Congress (IRC) are Static and are on higher side which was determined in 1990 based on the old technology vehicles. The present DCU values are more realistic as it’s considering the dynamic effect of the speed variation. The values of Dynamic car unit will help in determination of the capacity values for the urban arterial roads having heterogeneous traffic.
References
Arasan, V.T.; Arkatkar, S.S. 2010. Micro simulation Study of Effect of Volume and Road Width on PCU of vehicles under Heterogeneous Traffic, Journal
of Transportation Engineering. DOI: http://dx.doi.
org/10.1061/(ASCE)TE.1943-5436.0000176, 136(12): 1110-1119.
Arasan, V.T.; Krishnamurthy, K. 2008. Effect of Traffic Volume on PCU of Vehicles under Heterogeneous Traffic Conditions, Road and Transport Research, 17(1): 32-49. Chandra, S.; Kumar, U. 2003. Effect of Lane Width on Capacity under Mixed Traffic Conditions in India,
Journal of Transportation Engineering. DOI: http://dx.doi. org/10.1061/(ASCE)0733-947X(2003)129:2(155), 129(2): 155-160.
Chandra, S.; Sikdar, P.K. 2000. Factors affecting PCU in mixed traffic situations on urban roads, Roads and Transport Research, 9(3): 40-50.
Joshi, G.; Sinha, V.; Patel, J. 2011. Heterogeneous Traffic Characterization and Flow Behaviour Modeling for Metropolitan Arterial in India, Journal of the Eastern Asia Society for Transportation Studies, 9: 1684-1699. McShane, W.R.; Roess, R.P. 1990. Traffic Engineering. Prentice Hall, Inc. Englewood Cliffs, New Jersey. Praveen, P.S.; Arasan, V.T 2013. Influence of traffic mix on PCU value of vehicles under heterogeneous traffic conditions, International Journal for Traffic and
Transport Engineering. DOI: http://dx.doi.org/10.7708/
ijtte.2013.3(3).07, 3(3): 302-330.