REVERSE LOGISTICS RETAIL LEVEL RETURN
Ivona Bajor1, Dario Babić2
1, 2 University of Zagreb, Faculty of Traffic and Transport Science, Vukelićeva 4, 10000 Zagreb, Croatia
Received 4 December 2013; accepted 16 April 2014
Abstract: Conducting scientific research regarding reverse logistics systems includes certain difficulties. Developed logistics systems are aimed at analysing reverse logistics issues and tend to continuously detect differences and oscillations in the flow of returned products and their characteristics. Developing logistics systems, as Croatian, find reverse logistics issues, regarding product returns, significantly complex and very often these issues are not observed as issues of priority. As distributive flow, reverse logistics systems fundaments should be also based on detailed analysis. Analysis in this flow presents amounts, reasons, process flows and quality of returned items. Because of complex product evaluation on individual level, reverse logistics procedures should be implemented as a methodology individually developed for every supply chain subject. This paper presents a research of retail level returns on the Croatian market, where the analysis implicated that the majority of products in return for this level is directed from final consumers and presents noncurrent inventories of distribution chain. The paper will present conducted research regarding characteristics of returns and routing these products from the retail level.
Keywords: reverse logistics, distribution chain, return products routing, process optimization.
1. Introduction
Economic activity depends on the effciency of logistics systems and processes along the supply chain. Strategic importance of speed, reliability and flexibility in the supply chain is forcing companies to re-examine traditional logistics services (Tadić and Zečević, 2012). Regarding products in return, one can observe two sources. Products can be returned from the final consumer, most often on retail level, or can be returned from networks of business subjects inside the supply chain (McKinnon et al., 2010). The main difference between products in return is the amount, which from the final consumer’s perspective presents an item in return, but from business subjects perspective it presents certain amounts of inventories.
in a manual, cumbersome and expensive way (Norek, 2002). The design of reverse logistics network is also attracting growing attention with the stringent pressures from environmental and social requirements (Lee and Dong, 2009).
An important activity generally related to reverse logistics systems is activity of gatekeeping. Gatekeeping is carried out during the return of the product, and presents a decision regarding the subject in return entering the supply chain. While return, at the entry point, in addition to the authorization of the product, collection of the relevant information about a particular return is important and can provide benefits during the return processing in whole reverse chain (Ramirez, 2012). Companies that are developing reverse logistics system, while products are entering into the system, usually require general information about the reasons for return, place of purchase
and payment method (Ivaković et al., 2010). Businesses who want statistical data in order to improve the return, on the point of entry, require more detailed information on the reasons for return, type of product, detailed information about the user, service satisfaction, the desire to introduce the call centre, etc. (Bajor et al., 2012a).
Returns volume significantly depends on the size of retail locations and assortment (Rogić et al., 2012). For the research, returned amounts were measured on three categories of retail locations, where the first category includes retail locations with 300 m2 area and with 3000 to 5000 items in our range of products, the second category are retail locations with 2500 m2 area with 8000 to 10000 items, and the third category includes retail locations with areas between 2500 to 5000 m2 with more than 30000 items in our range of products. The above categorization is shown in Table 1.
Table 1
Categories of Retail Locations
Sales area [m²] Sales range [products assortment] Category I < 300 3000-5000
Category II 1000-2500 8000-10000
Category III 2500-5000 > 30000
2. Products Receipt Processes at the
Retail Level
Products in the return to a retail location are directed by the final consumer who initiates it due to a variety of reasons. The aforementioned activity triggers the return
a period of eight days, due to dissatisfaction with the product, is a matter of business policy (Rogić and Bajor, 2012).
One of the surveyed retailers reported higher volumes of product returns at retail locations that do not belong to their chain just because their return procedure does not require an account at receipt location. Retail chain justifies this procedure with an assumption that market positioning is just a result of final consumer satisfaction, and that the amount of products that do not belong to their chain is negligible. Studies have shown just the opposite, at the same retail location category (III), of one of the surveyed retail chains, there were 17% of returned products that do not belong to the retailer. The amount of returned products of the mentioned category depends on the company policy, uniformed return procedures and trained employees who will identify the returned product category. The research implicated that although employees at receipt recognize these products (various labels, prices, etc.), sometimes for different reasons, they decide to accept these products.
Research regarding return of products on the retail level is based on data of 112 retail locations of various retail chains on the Croatian market, with a variety of operating conditions. Retail chains included in the research are chains that make the majority on the Croatian market.
For Category I retail locations, the daily average is three products in return. It is
important to note that often the mentioned retail locations do not accept returns on a daily basis, and for all processes regarding return, such as receiving, administrative procedures and further directing of goods in return, the manager of retail locations is in charge.
For decisions regarding discounts and further directing, the manager consults the procurement manager or product category manager on retail chain level and acts accordingly, which is in line with the company policy and existing contracts.
Retail locations Category II record an average return of seven products per day. For administration, reception and further directing of products in return, two employees and the manager are usually in charge. The mentioned employees are fully familiar with the procedures regarding return.
Category III retail locations, receive an average return of 16 products per day. For retail locations Category III, at least three employees and the retail location manager are responsible for refund processing. The surveyed employees in Category III retail location implicated that processing returned items requires certain education regarding product categories in return and proficient knowledge of the company policy.
0 5 10 15 20 25
1 6 11 16 21 26 31 36 41 46 51 56 61 66 71 76 81 86 91 96
R
et
ur
ne
d i
tem
s
Observed period [days]
Category I ≤500m2 Category II ≤2500m2 Category III ≤5000m2
Fig. 1.
Returned Products According to Categories of Retail Locations
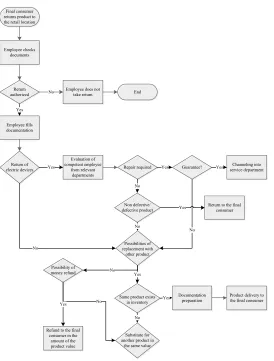
In addition to employees at the reception that are administrating and accepting return, at almost all retail chains in the Croatian market, there is a processing pattern for different product categories that make the majority range in the chain (electronic devices, consumer products, books, etc.) (Bajor et al., 2012b). Every return made by the final consumer is initiated due to different reasons (Blackburn et al., 2004). At the Croatian market after initiating return, in the receipt processing zone, an employee checks the documentation and, if the return is authorised, follows the procedure. If the product to be returned is an electric or electronic device or is not a user-friendly product (the most complex easy-use product implies only “switch on and use” complexity), the employee at the
Final consumer returns product to the retail location
Employee fills documentation
Return of electric devices
Evaluation of competent employee
from relevant departments
Yes Repair required Yes Guarantee? Yes service departmentChanneling into
No
Same product exists in inventory Employee checks
documents
Return authorized
Yes
No Employee does not take return End
Possibilities of replacement with
other product No
No
Yes
Documentation preparation
Yes Product delivery to the final consumer
Substitute for another product in
the same value No Possibility of
money refund No
No
Refund to the final consumer in the
amount of the product value
Yes
Non defective/ defective product
No
Return to the final consumer Yes
Fig. 2.
Processes at the Retail Location Regarding Product Receiving from the Final Consumer
If the company policy and receipt conditions allow the return, the final consumer will decide to replace the product or receive cash equivalent to product market value in retail chain. Although in most retail chains the refund rate is not related to the current market price, but to the amount on the invoice, some retailers base the refund on current prices of the same or most similar product in the existing offer.
belonging to the category of “complex consumer”), its status in the retail chain (e.g. loyal consumer), age, familiarization with the Consumer Protection Act, etc. In the majority of observed retail chains, employees at the return reception estimate the final consumer, and often adapt further processing to the situation. The mentioned non-uniformed organization results in unnecessary transport processes by the retail chain to the final consumer in order to collect the product in return, granting refunds due to an unpleasant behaviour of
the final consumer, replacing products that do not belong to the retailer, etc.
3. Routing the Products in Return
Studies have shown that the retail locations Category III receives an average of 6.25% of the products that do not belong to the retail chain, 9.43% of the products are directed to be sold at full price, for 57.05% of returned products reduced prices are defined, 18.18% of returned products are directed to landfills and 9.09% of them are directed to services, as shown in Fig. 3.
Fig. 3.
Routing Products after Return to Retail Location
Products that are directed to be sold at full price are products that visually match the brand new and originally packaged product. The decision on the above guidance brings an employee who receives the returned product and has not been trained to check the accuracy of all product categories and the possible failures. This result in the return of the same product by different final consumers recorded more than once.
At a retail location, in a day, a total write off includes 40-50 products, which according to the retailer, at a retail location Category III at monthly level make the total value 650-700 EUR, excluding other costs. Depending on the company policy, the product category and level of retail chain centralization, the products are destroyed at the retail level (in the form of proper disposal in specified containers) or routed to a central warehouse where are they also destroyed. At the retail location, also category III, the containers are emptied twice a month, while the removal of animal origin product categories is organized once a week and at the monthly level presents an average of 150-170 kg of products.
The studies conducted on the respondents included in the research, confirmed that in most cases, even 76%, final consumers products that are intended to service returns
to the place of purchase, while only 10% of returned products are directed to the service, then to the manufacturer or location indicated on the product, which is shown in Fig. 4. Further research implicated that after consumers return the product to the retail location, in 12% of cases (out of the total recorded return), employees at the information desk or at the retail level direct them to return product themselves back in the authorized service. These facts support the research conducted at retail chains, since two chains involved in the study do not organize the transport of the returned products to services, but consider it as the obligation of final consumers. A specified business policy is explained with a very small range of electrical and electronic devices, and the fact that this kind of business they currently obtain and they do not plan to change it.
Fig. 4.
Final Consumers Re-routing or Acceptance of Returned Products
4. Purchase Characteristics at the
Retail Level
For research purposes, returns have been followed during the period of 30 days, at retail
contained 12 products, while at the end of the observed time period at retail location there were more than 900 000 products sold, in more than 80 000 accounts. After reviewing the statistical data of the retail chain, it was found that in January 2013 on each invoice issued, an average of 35% of purchased products included products with reduced prices, as shown in Fig. 5.
These data are significant for creating channels of reverse logistics within the Croatian market, based on market research and the behaviour of the final consumer. At the Croatian market reverse logistics
activities and channels should be developed in certain direction. This direction needs to be based on activities for reusing the products and developing reverse logistics channels in form of secondary markets. The behaviour of final consumers and conducted research implicated that market for used or slightly damaged products or product without their original packaging exists and consumers are willing to purchase them, as products of primer, distribution channel. The formation of secondary markets can affect environmentally conscious purchasing and result in fewer products unnecessarily directed to landfills.
0% 10% 20% 30% 40% 50% 60% 70% 80% 90% 100%
Th
e
sh
ar
e o
f p
urc
ha
sed
p
ro
du
ct
s
Observed period
Products with full price Product with discount
Fig. 5.
Share of Products Purchased at a Reduced and Full Price at Category III Retail Location
5. Conclusion
The issues of reverse logistics in developed logistics systems were investigated twenty
return flows are substantially different, and must be observed at an individual level. Specific levels of liberalization, formed contracts, the structure of final consumer and ways of organizing business entities at different levels of the supply chains of individual logistics markets, directly affect the construction form of reverse logistics system and the amount of products in the return. To systematically provide detailed analysis of reverse logistics system, it is necessary to structure and adjust it to subjects in the supply chain that include manufacturers, retailers, distributors, etc.
During the market research, there were large quantities of returned products to all business subjects of the supply chains, but it was detected that the highest amounts are continuously accumulated at the supplier’s level. The most relevant shortcomings of reverse logistics organization are evident in a prolonged disposition cycling time, employee engagement, overload of distribution flow, high costs, unorganized and non-existing activities and reverse logistics channels, amounts unnecessarily directed on landfills, etc.
The research results primarily implicated that operators of supply chains at the retail level do not keep detailed records of the return quantities and the reasons for the formation of increased amounts on reverse flow, also they do not conduct analysis related to returned products. Although returned products on this level present the lowest amount detected in reverse flow, this level, as all other more complex levels, needs to be systematically organized. The mentioned characteristics of reverse logistics flow are primarily due to management’s oversight. As in the most developing logistics systems, reverse logistics on the Croatian
market is considered as flow of secondary matter. Regarding processing and overload of employees and infrastructure of distribution channel, centralized returned centre should be developed for uniformed processing of returned items and disburden of distributive flow.
References
Aberdeen Group. 2010. A Harte Hanks Company: Reverse Logistics, Driving improved Returns Directly to the Bottom Line.
Underwritten by Flash Global Logistics, On Process Technology, Aberdeen Group, Inc. 071309b, USA, 9-13.
Bajor, I.; Babić, D.; Kolarić, G. 2012a. Sustainability When Developing Return Centres. Proceedings of the International Conference on Traffic and Transport Engineering, 425-430.
Bajor, I.; Babić, D.; Ivaković Babić, M. 2012b. Sustainability Through Greening and Reversing the Supply Chain. LOGI Scientific Journal on Transport and Logistics, 3(2): 7-13.
Bajor, I.; Jurčević, M.; Ivaković Babić, M. 2010. Human Resources Management in Reverse Logistics Operations. Proceedings of the 7th Russian Scientific and Technical Conference „Polytransport Systems“, Russia, 10-11.
Blackburn, J.D.; Guide, Jr.V.D.; Souza, G.C.; Van Wassenhove, L.N. 2004. Reverse Supply Chains for Commercial Returns. California Management Review, No. 46, California, USA, 6-22.
de Brito, M. 2003. Managing Reverse Logistics or Reversing Logistics Management. Erasmus Research Institute of Management, Erasmus University of Rotterdam, Rotterdam, Netherlands, 36-45.
Kleberte, R. 2006. Dynamic Inventory Management in Reverse Logistics. Springer–Verlagis, Berlin, Germany, 13-25.
Lee, D.H.; Dong, M. 2009. Dynamic Network Design for Reverse Logistics Operations Under Uncertainty, Transportation Research Part E: Logistics and Transportation Review. DOI: http://dx.doi.org/10.1016/j. tre.2008.08.002, 45(1): 61-71.
McKinnon, A.; Cullinae, S.; Browne, M.; Whiteing, A. 2010. Green Logistics: Improving the environmental sustainability of logistics. The Chartered Institute of Logistics and Transport, Kogan Page, London, UK, 33-52.
Norek, C.D. 2002. Returns Management: Making Order Out of Chaos, Supply Chain Management Review, 6(3): 34-42.
Ramírez, A.M. 2012. Product Return and Logistics Knowledge: Inf luence on Performance of the Firm, Transportation Research Part E: Logistics and Transportation Review. DOI: http://dx.doi.org/10.1016/j. tre.2012.06.001, 48(6): 1137-1151.
Rogers, D.S.; Tibben-Lembke, R.S. 1998. Going Backwards: Reverse Logistics Trends and Practices. Reverse Logistics Executive Council, Pittsburgh, USA, 53-96.
Rogić, K.; Babić, D.; Bajor, I. 2012. Analysis of Reverse Logistics on the Croatian Market. Proceedings of the International Scientific Conference: Development of Logistics Business and Transport System Supported by EU, 200-207.
Rogić, K.; Bajor, I. 2012. Return Centres Concepts on the Croatian Market. Proceedings of the International Scientific Conference Development of Logistics Business and Transport System Supported by EU, 425-430.
Rogić, K.; Bajor, I.; Rožić, T. 2010. Reverse Logistics Operation as Element of Warehouse Management.
Proceedings of the 13th International Conference on Transport Science: Maritime, Transport, and Logistics Science, 507-511.