Proc. IAHS, 374, 35–40, 2016 proc-iahs.net/374/35/2016/ doi:10.5194/piahs-374-35-2016
© Author(s) 2016. CC Attribution 3.0 License.
Open Access
ater
Resources
Assessment
and
Seasonal
Prediction
Rainfall as proxy for evapotranspiration predictions
Bruno Collischonn1and Walter Collischonn2
1Agencia Nacional de Aguas, Brasilia, 70610-200, Brazil 2Instituto de Pesquisas Hidraulicas, Porto Alegre, 91501-970, Brazil
Correspondence to:Bruno Collischonn (bruno.collischonn@ana.gov.br)
Published: 17 October 2016
Abstract. In this work, we evaluated the relationship between evapotranspiration and precipitation, based on the data recently made available by the Brazilian Meteorological Institute. ETP tend to be lower in rainy periods and vice-versa. This relationship was assessed both in physical and statistical ways, identifying the contribution of each explaining variable of ETP. We derived regression equations between monthly rainfall and ETP, which can be useful in studies where ETP time series are not available, such as reservoir design, irrigation management and flow forecast.
1 Introduction
Evaporation and evapotranspiration (E/ETP) are compo-nents of the water cycle, corresponding to the transfer of water from the terrestrial surface to the atmosphere. Quan-titative information about these components is used in sev-eral problems involving water resources, such as crop man-agement (both irrigated and non-irrigated), reservoir design and operation, flow forecast and so on. However,E/ETP data availability is sparse both in time and space, as well as the data needed to estimate it (solar radiation, wind speed, rel-ative humidity, air temperature and atmospheric pressure) using consecrated methods like Penman-Monteith (Shuttle-worth, 2012).
Moreover, E/ETP shows a lower variability, compared with precipitation. These factors (data scarcity and low vari-ability) lead to the fact that many studies in water resources in Brazil use simple evaporation vectors, i.e. long-term monthly averages of E/ETP, instead of time series. When evaluat-ing reservoir yields, for example, most studies in Brazil use E/ETP averages. It is straightforward to conclude, however, that this approach leads to an underestimation of reservoir yields, since during a sequence of dry years, which nor-mally defines the magnitude of reservoir yields, realE/ETP is greater than the average. On the other hand, in wet years, whenE/ETP is lower than average, one can expect frequent reservoir spilling; thus, excess volumes do not compensate interanually.
The Brazilian hydropower network, which accounts for more than 70 % of power supply in the country, is designed to minimize the risk of power shortages in the case of repetition of a so-called critical hydrological period, which was a very dry sequence of years in the country as a whole, from 1949 to 1956. But hydrological data during that period was very scarce, leading to the need of hydrological modelling, mostly usingE/ETP averages. Better estimates ofE/ETP would al-low a more real assessment of the supply capacity, as well as a better estimation of historical inflows.
Again, given the low variability ofE/ETP, it is often as-sumed that the errors incurred by using averages are lower than the estimation ofE/ETP itself (as well as the estima-tion of other hydrological variables), making this approach widely accepted.
However small, interannual variability inE/ETP does ex-ist, and it is in some ways linked to the variability of precip-itation. In general, there is an inverse relationship of rainfall andE/ETP in a given time interval. As a consequence, the rainfall-runoff transformation process becomes nonlinear, as stated by Tucci (1998), since an increase of, say, 100 mm in monthly precipitation leads to an increase in runoff higher than 100 mm, because of the decrease of E/ETP (besides other non-linearities). The inverse relationship between these two variables has not been very much investigated in the lit-erature, one exception being the work by Mudiare (1985).
re-lations between E/ETP and rainfall. Once this relationship exists, E/ETP time series are obtained by applying the re-gression equation with the precipitation time series as input.
Recently, the Brazilian National Institute of Meteorology (INMET) has put its daily hydrometeorological time series available for research purposes. Data since 1961 over 290 stations around the country can be obtained through the inter-net after registering, attending a long-time demand of water managers and research community in Brazil.
In the present work, some statistics were calculated using this database, in order to identify a more physical explanation for the inverse relationship between rainfall and E/ETP, by quantifying the magnitude of the underlying meteorological variables both in dry and wet days.
Moreover, regression equations between monthly E/ETP and rainfall at each station were derived. The goal is to ob-tain a better comprehension of the relationship, as well as generating anE/ETP database for the refinement of water re-sources studies, as an alternative of the use of averaged data.
2 Rainfall andE/ETP
The Penman-Monteith equation, which is considered to be the most suited method for quantifying E/ETP (Smith, 1991), can be rewritten as a function of five meteorological variables:
E/ETP=f(Tmed,UR,PA,VV,RAD) (1)
whereTmed is the mean air temperature, UR is the relative
humidity, PA is the atmospheric pressure, VV is the mean wind speed, and RAD is the incident solar radiation. In our work, incident radiation is calculated from sunshine duration, in hours.
The inverse relationship between rainfall andE/ETP can be explained physically, through the variation of its explain-ing variables. First, rainy days are necessarily cloudy, reduc-ing the incomreduc-ing radiation. This is the main factor explain-ing the inverse relationship, since solar radiation (or sunshine duration) is the main driver of the process of evaporation and evapotranspiration (Shuttleworth, 2012).
Rainy days also generally show higher relative humid-ity. This leads to a decrease ofE/ETP, since higher humid-ity causes an increase in vapour pressure (neighbouring air moisture is closer to saturation).
The effects of the remaining variables are not so evi-dent. Mean temperature, for example, is positively correlated withE/ETP, since increases vapour saturation pressure (the amount of moisture that can be stored in the surrounding air). However, FAO’s recommendation is to use the average be-tween the minimum and maximum daily temperature as an estimate of mean temperature. In rainy days, lower radia-tion tend to decrease maximum temperatures, but during the night, outgoing longwave radiation is retained in the atmo-sphere by the clouds, actually increasing minimum tempera-tures (Allen et al., 1998), at least in temperate climates. Thus,
the relevance of mean air temperature in the rainfall-E/ETP relationship is relative.
In the case of the other variables (atmospheric pressure and wind velocity), it is harder to establish a correlation intu-itively, as made above. The magnitude of each meteorologi-cal variable in dry and wet years were statistimeteorologi-cally tested as follows.
3 Statistical analysis of ETP’s explaining variables
For each station, daily time series were separated between dry and rainy days, the latter defined as days with precipita-tion lower or equal than 5 mm. For each of the five variables, we tested the hypothesis that the mean of the variable in dry days is equal to the mean in rainy days (null hypothesis), us-ing Student’sttest of the means implemented in Matlab®for a 5 % significance level. If the null hypothesis was rejected, it was verified that the mean in rainy days was higher or lower than in dry days.
Seasonality was also accounted for, by performing the tests for each month of the year. Months where less than 5 % of the days were rainy were discarded (typically the period between July and September in the Southern Hemisphere), in order to avoid non-rejection of the null hypothesis only because of the small size of samples.
INMET stations were grouped according to the five Brazil-ian climate zones (IBGE, 2013). For each zone, we calcu-lated the frequency of months/stations where magnitude was higher in dry and rainy days, as well as the percentage of months were the null hypothesis could not be rejected (in this case, we considered that no significant difference exists).
Results – statistical correspondence
Wind speed (or: “do rainy days have stronger wind?”)
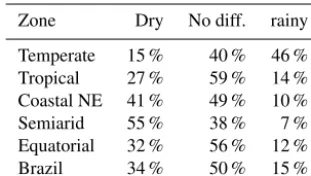
Table 1 shows the condensed results of the hypothesis test for wind velocity. For each climate zone, we calculated the fre-quency of months/stations where wind was stronger during rainy and dry days, as well as no significant difference.
In most regions, there is no difference between wind ve-locity during rainy and dry days. In the semi-arid and coastal northeast, stronger wind occurs slightly more frequently dur-ing dry days. In the more temperate south, it is the other way round. In general, it was observed that coastal stations showed stronger wind during dry weather, while stations in hillier regions have stronger winds more frequently during rainy days.
Table 1.Frequency of stronger wind during dry and rainy days.
Zone Dry No diff. rainy
Temperate 15 % 40 % 46 % Tropical 27 % 59 % 14 % Coastal NE 41 % 49 % 10 % Semiarid 55 % 38 % 7 % Equatorial 32 % 56 % 12 % Brazil 34 % 50 % 15 %
Table 2.Frequency of higher maximum temperature during dry and rainy days.
Zone Dry No diff. rainy
Temperate 98 % 2 % 0 % Tropical 95 % 5 % 0 % Coastal NE 80 % 20 % 0 % Semiarid 79 % 20 % 1 % Equatorial 60 % 38 % 2 % Brazil 85 % 15 % 1 %
Temperature (or: “are dry days warmer?”)
Statistical analyses were performed considering minimum, maximum and mean daily temperature. Table 2 shows the analysis for the maximum temperature. In almost 90 % of the cases, maximum temperature was significantly higher during dry days than during rainy days, more so in the temperate south and less so in the equatorial amazon. It confirms the intuitive notion, also stated by Allen (1998), that dry days have maximum temperatures higher than rainy days.
For minimum temperatures, aggregate results are shown in Table 3. Its results show that the assumption by Allen (1998), that rainy/cloudy days have higher minimum temperatures, is valid for temperate climates, but not necessarily for trop-ical/equatorial regions. Here, very often minimum tempera-tures were higher in dry days.
In the average, results shown in Table 4 allow the conclu-sion that dry days tend to be warmer in all regions of the country. As seen, this is in part due to higher maximum tem-peratures, as expected, but in some parts also due to higher minimum temperatures even in dry days, contrary to some literature, notably Allen et al. (1998).
This also helps to explain the negative relationship be-tween rainfall andE/ETP, since, as seen, temperature is pos-itively correlated withE/ETP.
Radiation/Sunshine duration and relative humidity
In the case of sunshine duration (used here to estimate in-coming radiation), the correlation is quite intuitive, and is confirmed by the statistical analysis: in almost 100 % of the months/stations, mean sunshine duration was higher in dry
Table 3.Frequency of higher minimum temperature during dry and rainy days.
Zone Dry No diff. rainy
Temperate 3 % 18 % 79 % Tropical 27 % 38 % 36 % Coastal NE 24 % 60 % 16 % Semiarid 26 % 60 % 14 % Equatorial 43 % 51 % 6 % Brazil 26 % 44 % 30 %
Table 4.Frequency of higher mean temperature during dry and rainy days.
Zone Dry No diff. rainy
Temperate 61 % 34 % 5 % Tropical 79 % 18 % 2 % Coastal NE 46 % 53 % 1 % Semiarid 46 % 51 % 2 % Equatorial 42 % 56 % 2 % Brazil 61 % 37 % 3 %
Table 5.Frequency of higher mean sunshine duration during dry and rainy days.
Zone Dry No diff. rainy
Temperate 100 % 0 % 0 % Tropical 100 % 0 % 0 % Coastal NE 100 % 0 % 0 % Semiarid 100 % 0 % 0 % Equatorial 98 % 2 % 0 %
Brazil 99 % 1 % 0 %
days, as seen in Table 5. This is the main factor explaining the inverse relationship between rainfall andE/ETP.
The same happens for relative humidity. Table 6 shows that in 100 % of the cases, relative humidity is higher dur-ing rainy days. Since relative humidity is negatively corre-lated withE/ETP, this also explains the inverse relationship investigated in this paper.
Table 6.Frequency of higher relative humidity during dry and rainy days.
Zone Dry No diff. rainy
Temperate 0 % 0 % 100 % Tropical 0 % 0 % 100 % Coastal NE 0 % 0 % 100 % Semiarid 0 % 0 % 100 % Equatorial 0 % 0 % 100 % Brazil 0 % 0 % 100 %
Table 7.Frequency of higher atmospheric pressure during dry and rainy days.
Zone Dry No diff. rainy
Temperate 88 % 7 % 5 % Tropical 65 % 27 % 8 % Coastal NE 9 % 60 % 31 % Semiarid 18 % 57 % 24 % Equatorial 8 % 71 % 21 % Brazil 44 % 41 % 15 %
4 Relations between rainfall and ETP
Daily time series for ETP were calculated through the Penman-Monteith, based on Shuttleworth (2012) and syn-thetized by Collischonn et al. (2007), using the meteorolog-ical data recently made available by INMET in 290 meteo-rological stations in Brazil. Incident radiation data was esti-mated based on sunshine duration. Reference evapotranspi-ration was calculated adopting an albedo of 0.23 m, surface resistance of 70 s m−1and crop height of 0.12 m (Allen et al., 1998).
During time intervals where one or more of the variables were missing, ETP was not calculated, the only exception be-ing missbe-ing atmospheric pressure. In this case, pressure was estimated based on a seasonal correlation between monthly mean pressure and station elevation. This is considered to be acceptable, given the low influence of this variable over the variability of ETP and the large number of missing data for atmospheric pressure.
ETP data where then accumulated into monthly totals. If missing data accounted for less than 5 days, missing data were filled using the mean ETP of the remaining days. Other-wise, the month was not included in the regression. The same was done for monthly rainfall.
Regression equations were then derived from the paired ETP/rainfall monthly data. Regressions were done for each month of the year, in order to account for seasonality. Given the expected inverse relationship between these variables, the slope of the regression should be negative.
Figure 1.Example of regression for Brasilia, month of January.
Results – relations between rainfall and ETP
Figure 1 shows an example of the resulting regressions, for the meteorological station of Brasilia (tropical Brasil cen-tral zone), for the month of January. It can be observed that, as expected, rainfall variability is in general much higher than that of ETP. In this case, while rainfall varied be-tween 29 and 577 mm month−1, ETP varied between 85 and 145 mm month−1. The negative slope shown in this example was also obtained for all remaining regressions, emphasizing the inverse relationship between rainfall and ETP.
Although data dispersion is relatively high (also expressed in the low coefficient of determinationR2, it should be re-membered that these regressions are an alternative for the use of long-term averages of ETP for hydrological simula-tion, i.e. when no time series are available.
This kind of regression is particularly useful during tran-sition months between the dry and rain seasons in tropical regions (typically April/May and September/October in the Southern Hemisphere), which can be either very rainy or very dry, depending on the year. It is also useful in regions where the rain season presents periodical breaks, or periods of 10 to 15 days without rainfall. These periods, usually be-tween December and March, can have very high ETP given the higher extraterrestrial radiation during summer months.
Only during very dry months, like July and August, ETP can have a higher variability, since rainfall is hardly larger than zero. In this case, the regressions are less useful, and the use of ETP averages seem to be more practical.
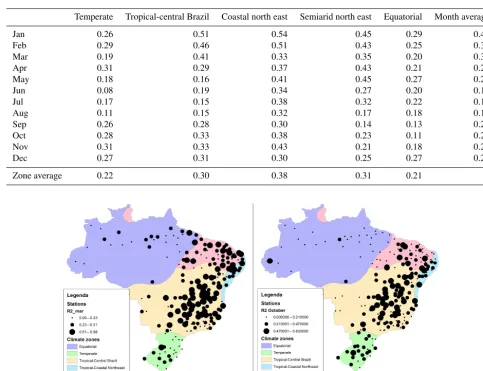
Figure 2 shows the spatialized values of theR2coefficient for the regression in two months of transition between rainy and dry seasons.
Table 8.Monthly averages ofR2statistics for the regressions in each climate zone.
Temperate Tropical-central Brazil Coastal north east Semiarid north east Equatorial Month average
Jan 0.26 0.51 0.54 0.45 0.29 0.41
Feb 0.29 0.46 0.51 0.43 0.25 0.37
Mar 0.19 0.41 0.33 0.35 0.20 0.32
Apr 0.31 0.29 0.37 0.43 0.21 0.29
May 0.18 0.16 0.41 0.45 0.27 0.23
Jun 0.08 0.19 0.34 0.27 0.20 0.18
Jul 0.17 0.15 0.38 0.32 0.22 0.19
Aug 0.11 0.15 0.32 0.17 0.18 0.15
Sep 0.26 0.28 0.30 0.14 0.13 0.23
Oct 0.28 0.33 0.38 0.23 0.11 0.26
Nov 0.31 0.33 0.43 0.21 0.18 0.28
Dec 0.27 0.31 0.30 0.25 0.27 0.28
Zone average 0.22 0.30 0.38 0.31 0.21
Figure 2.Spatialized values ofR2statistic for transition months: March (left) and October (right).
Finally, Table 8 shows the average ofR2statistics for each zone and month.
As mentioned, the winter months in the Southern Hemi-sphere (June to August) showed the lowest average regres-sion performance, because of the low variability of rainfall during these months in most regions of Brazil.
5 Conclusions
This work is a first attempt to further explore the meteorolog-ical time series recently made available by INMET, based on a hydrological point of view. In the following sections, the main specific conclusions are presented.
5.1 Statistical correspondence between explaining meteorological variables
The statistical analysis performed over the meteorologi-cal variables explaining the evapotranspiration process
sup-ported the comprehension of the mechanisms behind the in-verse relationship between rainfall and ETP. Incoming radia-tion, which is the main driver of ETP, is clearly higher during dry days than in rainy days. Relative humidity, which also strongly influences ETP, is clearly higher during rainy days. Both results are intuitive and are supported by the statistical analysis.
Mean air temperature, which is also positively correlated with ETP, is generally higher during dry days, in comparison to rainy days. The results also showed that minimum tem-peratures very often were higher during dry days, mostly in the tropics. This result shows that one very popular premise of hydrometeorology is not necessarily true for tropical re-gions, namely the belief that minimum temperatures should be lower during clear weather due to less heat retention in the lower atmosphere.
could not be rejected, thus not allowing further conclusions. One singular fact that was observed is a tendency for stronger wind during dry days in coastal places, while in hilly loca-tions wind was stronger in rainy days.
Thus, the inverse relationship between rainfall and ETP is explained mostly by the higher incoming radiation (or sun-shine duration) and lower relative humidity in dry days, and by a lesser part, by higher mean air temperature in these con-ditions.
5.2 Regressions between rainfall and ETP
In general, the results of the regressions confirmed the in-verse relationship between rainfall and ETP, since regression slopes were negative in most cases.
Although the numerical values of the coefficient of deter-minationR2were low, it must be remembered that these re-gressions are an alternative to the use of ETP averages, i.e. monotonical ETP values, in order to take at least a share of temporal variability into account. Thus, while the obtained regressions explain around 50 % of ETP’s variability, the us-age of long-term averus-ages would explain 0 %.
The obtained relations are particularly useful in tropical regions, during months of transition between rain and dry seasons, which can be either very wet or very dry, thus show-ing varyshow-ing ETP.
These indirect estimates of ETP can be useful, for exam-ple, for extending ETP series into the past, in regions or pe-riods where rainfall data is more abundant than meteorologi-cal data. As mentioned, the Brazilian hydropower network is planned and operated to supply energy demand, at a low risk, even in the case of a repetition of a critical hydrological pe-riod occurred in the 1950s, when hydrometeorological data was scarce nationwide (and even more so in low-populated areas like the amazon, where hydropower was expanded in recent years). More accurate ETP estimates would be help-ful both for a better assessment of inflows during that period (given the need of proper rainfall-runoff modelling) and for a better estimation of evaporation losses.
Other potential areas of usage are reservoir design and reservoir yield estimation, where long-term ETP averages are still widely used, leading to an overestimation of reservoir yields. Irrigation management would also be an area for ap-plication, through a better estimation of crop water needs, based only on rainfall measurements and the regressions ob-tained. Finally, assessment of future hydrological conditions would also benefit, since ETP conditions could be easily es-timated based only on rainfall predictions.
6 Data availability
Meteorological data used in this paper belongs to the Brazil-ian Meteorological Institute and is available (after reg-istration) at http://www.inmet.gov.br/projetos/rede/pesquisa/ inicio.php.
Acknowledgements. The authors thank the Brazilian National Institute of Meteorology (INMET) for making the hydrometerolog-ical time series available for academic purposes.
References
Allen, R., Pereira, L., Raes, D., and Smith, M.: Guidelines for computing crop water requirements. Rome: FAO, 310 pp. (FAO-Irrigation and Drainage Paper, 56), 1998.
Brazilian Meteorological Institute: BDMEP: Meteoro-logical Database for Research Purposes, available at: http://www.inmet.gov.br/projetos/rede/pesquisa/inicio.php, last access: December 2013.
Collischonn, W., Allasia, D., Silva, B., and Tucci, C. The MGB-IPH model for large-scale rainfall-runoff modelling, Hydrol. Sci. J., 52, 878–895, 2007.
Instituto Brasileiro de Geografia e Estatística: Map of Brazilian Cli-mate Zones, available at: ftp://geoftp.ibge.gov.br/informacoes_ ambientais/climatologia/mapas/brasil/clima.pdf, last access: De-cember 2013.
Mudiare, O. J.: Influence of light rainfall and cloud cover on evapo-transpiration demands, PhD Thesis, University of Saskatchewan, 1985.
Shuttleworth, W. J.: Terrestrial Hydrometeorology, Wiley-Blackwell, 448 pp., 2012.
Smith, M.: Report on the expert consultation on revision of FAO methodologies for crop water requirements, Technical Report, FAO/AGL, Rome, 1991.