Khumukcham Stina
1, A. Sarkar
2, Ram Singh
3and R. Josmee Singh
4 1School of Social Sciences, College of Post Graduate Studies, Central Agricultural University, Umiam, Meghalaya-793 103, India 2Department of Extension and Social Sciences, College of Fisheries, Central Agricultural University, Lembucherra, Tripura – 799 210, India3School of Social Sciences, College of Post Graduate Studies, Central Agricultural University, Umiam, Meghalaya-793 103, India 4 School of Social Sciences, College of Post Graduate Studies, Central Agricultural University, Umiam, Meghalaya-793 103, India
ABSTRACT
Being premised on the planks of inclusive growth, livelihood security and democratic empowerment as envisaged in the Mahatma Gandhi National Rural Employment Guarantee Act (MGNREGA), the state of Manipur is implementing the scheme with the mandate to provide at least 100 days of demand based guaranteed wage employment in a financial year to every rural household whose adult members volunteer to do unskilled manual work and creation of durable social assets in the process. In this backdrop, the present study examined the performance of the scheme in that state with respect to extent of employment generation, efficiency in work completion rate and efficiency in fund utilization through analyzing official records of 7 years between 2008-09 and 2014-15. During the period under study, a total of 3228861 number of job cards were issued of which the share of backward communities (ST and SC) was 53.83 per cent. In terms of social category wise employment generation, the shares of backward communities and women were 69.58 per cent and 42.37 per cent respectively. However, there remained a gap of around 5.39 per cent in the matter of employment provisioning as against actual number of job card holding households deserving the benefit of employment. The shabbiest parts of the scheme were detected in the forms of provisioning of 100 days employment to only 7.39 per cent of job card holders and failure to complete 95.55 per cent of the undertaken works by scheduled time. This calls for playing of more responsive role by the state authority so that very purpose of MGNREGA is not defeated.
Keywords: MGNREGA, manipur, performance, employment generation, work completion rate.
Address for correspondence
Khumukcham Stina: Central Agricultural University, Umiam, Meghalaya-793 103, India E-mail: [email protected]
Access this article online
Publisher Website:
http://www.ndpublisher.in
DOI: 10.5958/2321-5771.2016.00007.7
deprivations and thus the poor often pass on their poverty to subsequent generations (Hulme and Shepherd, 2003). Ever since the inception of planning in India, the policies and the programmes have been designed and redesigned to formulate one or the other poverty alleviation programmes to usher economic betterment of poor people for their greater social transformation. And one such vital one was the National Rural Employment Guarantee Act (NREGA) that came into being on September 7, 2005 and subsequently renamed as the Mahatma Gandhi National Rural Employment Guarantee Act (MGNREGA) since October 2, 2009. It was proclaimed that unlike any other wage employment programme, this distinct and unprecedented bottom-up, people-centred, demand-driven, self-selecting as well as rights-based design has given rise to the largest employment programme in human history in terms of its scale, architecture and thrust (Anonymous, 2005). The genesis of National Rural Employment Guarantee Act (NREGA) may be traced back from the policy of creating guaranteed employment through public works by the Maharashtra government which introduced Employment Guarantee Scheme under the aegis of Maharashtra Employment Guarantee Act, 1977 to offer statutory support to the right to work for the rural poor. The programme was made effective since January 26, 1979 with the principal aim to provide gainful and productive employment to the people ready to offer unskilled manual work in the rural areas. The guarantee to provide work was restricted to unskilled manual work only. The delineation of the scheme suggested that on completion of the works undertaken, some durable community assets should be created and the wages paid to the workers should be linked with the quantity of work done. Another feature of the scheme was to ban contractors. It was also treated as a powerful tool for drought management and drought proofing (Singh, 2012). The MGNREGA was made effective in the form of Mahatma Gandhi National Rural Employment Guarantee Scheme (MGNREGS). The basic purpose of introducing MGNREGA was to enhance livelihood security in rural areas by way of mandatorily providing at least 100 days demand based guaranteed wage employment in a year to every deserving rural household whose adult members volunteer to do unskilled manual work. Creation of durable assets at local levels based
upon people’s consensus and strengthening livelihood resource base of the rural poor were also constituted to be its vital objectives. In other way to say that inclusive growth through ensuring social protection, livelihood security, democratic empowerment and sustainable community development are the all important planks on which the MGNREGA has been premised.
Manipur, one of the eight states of the North-East India, is inhabited by 7 Scheduled Caste (SC) communities and 33 Scheduled Tribe (ST) communities (Economic Survey, 2008-09). About 90 per cent of the total area of Manipur is covered by hills which comprise five of its nine constituent districts viz., Senapati, Tamenglong, Churachandpur, Chandel and Ukhrul. The remaining 10 per cent is a valley constituting four districts viz., Imphal East, Imphal West, Bishnupur and Thoubal. The proportion of rural population living below poverty line in Manipur during 2004-05 was estimated to be 39.28 per cent against national average of around 41.8 per cent (Pathak and Mishra, 2011) to signify occupying of its 10th
position from the bottom among 29 states and 7 union territories of the country. As MGNREGA has primarily been triggered at generating certain minimal level of income through enhanced wage earning of the rural poor, it may be presumed that proper execution of this flagship programme might really contribute a great way in providing those poverty stricken vulnerable people of Manipur with greater access to employment, income and, of course, food in a sustainable manner. And there lies the importance of the present study to analyze and understand the performance of the scheme across North-Eastern state of Manipur in terms of its promised deliverables.
d
ataB
aSeandm
ethodology2008-09 when all the remaining districts of the state were brought under its fold. For getting a comprehensive understanding of MGNREGA, therefore, the analysis of performance was made relating to the years 2008-09 to 2014-15. The study was based on published secondary data of 7 years i.e., from 2008-09 to 2014-15 of the Department of Rural Development and Panchayati Raj, Govt. of Manipur with necessary interpolation by way of utilizing the official on-line sources of MIS manager of MGNREGA (http://nrega.nic.in/netnrega/home.aspx and http://nrega.nic.in/netnrega/ homestciti. aspx? state_code=20).
In order to fully understand the extent, nature and pattern of employment generation through MGNREGA, a critical analysis of the issuance of job cards, demand for employment by job card holders, share of social category and gender in employment, the proportion of households completing 100 days of employment and, thereby, creation of man days under MGNREGA activities during study period was done through tabular analysis of the recorded data. In the similar way, efficiency of work completion rate in terms of number of works undertaken and efficiency in fund utilization contextual to demand based employment generation were also analysed and interpreted.
r
eSultSandd
iScuSSionThe single most important and distinguishing feature of Mahatma Gandhi NREGA (MGNREGA), from employment programmes of the past, is making the provision of work on demand by wage-seekers as to be their legal right. Under this demand driven public wage employment programme, works are opened and jobs offered whenever there is a demand for work (Anonymous, 2013). Here, the Job Card is considered to be a key document that records workers’ entitlements under MGNREGA and the Gram Panchayats are to issue the job cards free of cost within 15 days of receipt of such applications in writing or orally.
The status of seven years’ physical achievement in issuance of job cards for the periods between 2008-09 and 2014-15 has been presented through Table-1. It is being revealed from the table that in Manipur a total of 3228861 job cards have been issued during the period under study. Among those, 84693 (2.62%) were
from Scheduled Caste background, 1653562 (51.21%) were from Scheduled Tribe background and 1490606 (46.17%) were from ‘others’ background. Notably, out of the seven years under consideration, the year 2013-14, with issuance of 525791 job cards (i.e., 16.28% of the total job cards issued in the state), turns out to be the year when highest number of job cards were issued. And it is followed in next orders by 2014-15 and 2012-13 with 514603 (15.94%) and 474926 (14.71%) respectively. Here, 2008-09 has been observed to be the year in which least number of job cards was issued. It was 380910 in number (i.e., 11.8% of the total job cards issued in the state). This is possibly because 2008-09 was the take off year in terms of implementation of the scheme in six out of nine districts of the state of Manipur.
Table 1: Issuance of job cards under MGNREGA in Manipur during 2008-09 to 2014-15
Year Number of households issued with job cards SCs1 STs1 Others1 Total2
2008-09 (1.47)5592 206574 (54.23) 168744 (44.30) 380910 (11.80)
2009-10 12188
(2.86) 226993 (53.21) 187401 (43.93) 426582 (13.21)
2010-11 13752
(3.10) 235298 (53.07) 194331 (43.83) 443381 (13.73)
2011-12 14300
(3.09) 251117 (54.28) 197251 (42.63) 462668 (14.33)
2012-13 14333
(3.02) 255831 (53.87) 204762 (43.11) 474926 (14.71)
2013-14 11119
(2.11) 240676 (45.77) 273996 (52.11) 525791 (16.28)
2014-15 13409
(2.61) 237073 (46.07) 264121 (51.33) 514603 (15.94)
Total 84693 (2.62) 1653562 (51.21) 1490606 (46.17) 3228861 (100.00)
Source: Authors’ own calculation based on Annual Administration Reports of 2008-09 to 2014-15.of the Department of Rural Development and Panchayati Raj, Govt. of Manipur.
Note: 1. Figures in the parenthesis indicate percentage to the total of respective year.
2. Figures in the parenthesis indicate percentage to
Table-1 has further been revealing of the fact that although till 2012-13 the proportion of job card recipients in the state was dominated by the households from Scheduled Tribe (ST) communities, during the remaining two years i.e. 2013-14 and 2014-15, nevertheless, households from ‘others’ social categories emerged to be the dominant ones with their shares being 52.11 per cent and 51.33 per cent for the earlier and later year respectively. In fact, the explaining reason behind this might be due to the manner in which the execution of the scheme has taken place across various districts of the state. As indicated earlier, Manipur comprises of five hill districts which are dominated by the tribal communities. And in case of three out of those five ST dominated hill districts, MGNREGS had started getting implemented by the first two phases (i.e., 2006 in Tamenglong district and 2007 in Chandel and Churachandpur districts) as against all the four ‘others’ community dominated valley districts wherein the scheme had started at the third phase of implementation of the scheme (i.e., since 2008) and, therefore, presumably the tempo was yet to occur for
those later included districts.
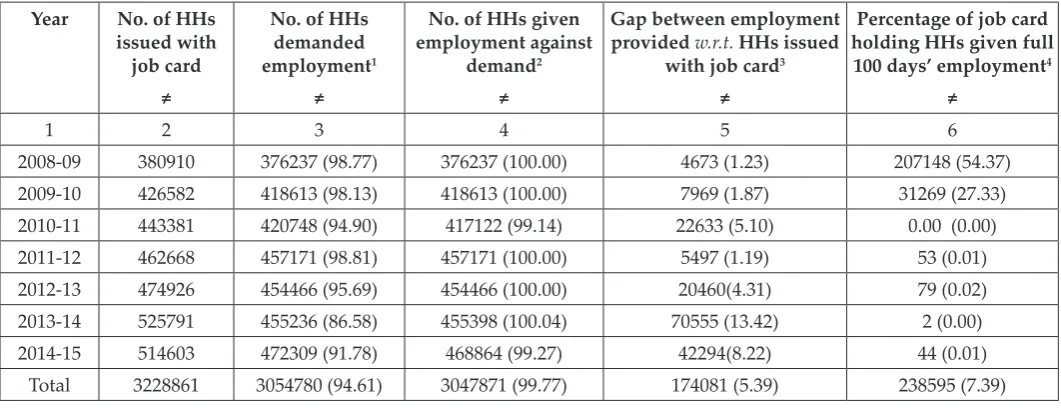
Being a demand driven employment guarantee Act, any endeavour to gain insight on the performance of MGNREGA critically requires development of comprehension about the extent of provisioning of jobs to the deserving households. From a glance at Table-2, it is revealing that in Manipur during the seven years under study (i.e. 2008-09 to 2014-15), almost cent percent (truly to express 99.77%) of the households were provided employment in response to demand raised by them. By all means, this may be considered to be one of the creditable tangible performance indicators of the scheme for the state under reference. Especially for the year 2013-14, there was even 100.04 per cent achievement in this regard to mean that the extent of provisioning of employment was made from amongst those job card holding households who even didn’t demand for any job may be due to incomplete awareness regarding procedural part of getting employment under the aegis of the scheme or otherwise.
Table 2: Employment provided under MGNREGA in Manipur during 2008-09 to 2014-15
Year No. of HHs issued with job card
≠
No. of HHs demanded employment1
≠
No. of HHs given employment against
demand2 ≠
Gap between employment provided w.r.t. HHs issued
with job card3 ≠
Percentage of job card holding HHs given full
100 days’ employment4 ≠
1 2 3 4 5 6
2008-09 380910 376237 (98.77) 376237 (100.00) 4673 (1.23) 207148 (54.37)
2009-10 426582 418613 (98.13) 418613 (100.00) 7969 (1.87) 31269 (27.33)
2010-11 443381 420748 (94.90) 417122 (99.14) 22633 (5.10) 0.00 (0.00)
2011-12 462668 457171 (98.81) 457171 (100.00) 5497 (1.19) 53 (0.01)
2012-13 474926 454466 (95.69) 454466 (100.00) 20460(4.31) 79 (0.02)
2013-14 525791 455236 (86.58) 455398 (100.04) 70555 (13.42) 2 (0.00)
2014-15 514603 472309 (91.78) 468864 (99.27) 42294(8.22) 44 (0.01)
Total 3228861 3054780 (94.61) 3047871 (99.77) 174081 (5.39) 238595 (7.39)
≠ HHs - Households
Source: Authors’ own calculation based on Annual Administration Reports of 2008-09 to 2014-15 of the Department of Rural Development and Panchayati Raj, Govt. of Manipur.
Note: 1. Figure in parenthesis indicates percentage to Col. 2 of corresponding year.
Even though the overall achievement towards issuance of job cards in Manipur apparently seems commendable to, in turn, indicate encouraging performance of the implementing agency, it has nevertheless been transpiring simultaneously from Table-2 that still there remained a gap of around 5.39 per cent at aggregate level in the state concerning the matter of employment provisioning with respect to the actual number of households which were issued with job cards during the entire span of seven years under study and, hence, were otherwise deserving to have the benefit of employment as per the laid down provision of the Act. By number, around 1.74 lakh job card holding households are found to have not provided with employment during the period in reference. Further, for the years of 2010-11, 2012-13, 2013-14 and 2014-15 the so explained gaps between employment provisioningwith respect to the actual number of job card holding households have been observed to the tune of 22.63 thousand (5.10%), 20.46 thousand (4.31%), 70.55 thousand (13.42%), and 42.30 thousand (8.22%) respectively. This revelation thus warrants discharging of some proactive and responsive function from the part of implementing functionary of the scheme in matters of more awareness building of the deserving poor people in general and job card holders in particular on the procedural part of getting jobs after they are delivered with the job cards. This is more so because the poor people are to take recourse to diversified subsistence livelihood strategy by compulsion and
social exclusion is a typical feature for that section of social class. And for that, often are they found to remain deprived of mainstream information network even if that information basket remains concerned with the matter of rights and privileges of those poor people themselves like the present case of MGNREGA. Even the Operational Guidelines of MGNREGA advocated that the implementers should pay very close attention to generating awareness among potential wage-seekers (Anonymous, 2013). A thoroughly deplorable revelation is also being made out of perusal of the Table-2 which is indicative that despite MGNREGA is committed to provide 100 days’ guaranteed wage employment in a year in terms of unskilled manual work to every deserving household, there has been wide deviation in terms of provisioning of actual employment to this effect in case of Manipur. Out of the seven financial years under study, the year 2008-09 could provide highest number of 207148 households with full 100 days of employment which was again only 54.37 percent of the total job cards issued in that particular year. And those were 31269 (27.33%) in 2009-10, and nil to virtually negligible during the remaining years. Thus, in sharp contrast to the laid down provision of the Act, Manipur has been found to be far lagging with respect to committed provisioning of 100 days’ employment in a year under the scheme and this requires adequate attention by the state authority.
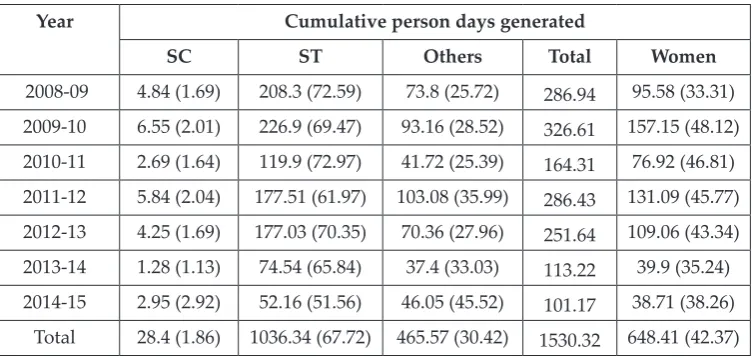
Table 3: Social category wise employment generation under MGNREGA
(in lakh person days)
Year Cumulative person days generated
SC ST Others Total Women
2008-09 4.84 (1.69) 208.3 (72.59) 73.8 (25.72) 286.94 95.58 (33.31)
2009-10 6.55 (2.01) 226.9 (69.47) 93.16 (28.52) 326.61 157.15 (48.12)
2010-11 2.69 (1.64) 119.9 (72.97) 41.72 (25.39) 164.31 76.92 (46.81)
2011-12 5.84 (2.04) 177.51 (61.97) 103.08 (35.99) 286.43 131.09 (45.77)
2012-13 4.25 (1.69) 177.03 (70.35) 70.36 (27.96) 251.64 109.06 (43.34)
2013-14 1.28 (1.13) 74.54 (65.84) 37.4 (33.03) 113.22 39.9 (35.24)
2014-15 2.95 (2.92) 52.16 (51.56) 46.05 (45.52) 101.17 38.71 (38.26)
Total 28.4 (1.86) 1036.34 (67.72) 465.57 (30.42) 1530.32 648.41 (42.37)
In terms of person days of employment generated under MGNREGA, Manipur is found to have generated a cumulative total of 1530.32 lakh person days during the seven years between 2008-09 and 2014-15. Out of that, Scheduled Tribes share 67.72 per cent (i.e., 1036.34 lakh person days) followed in descending order with 30.42 per cent (i.e., 465.57 lakh person days) by communities from ‘others’ background and with 1.86 per cent (i.e., 28.4 lakh person days) by Scheduled Castes. Moreover, cumulative employment generation for women under MGNREGA in case of the state has been observed to be 648.41person days which is 42.37 per cent of the gross wage opportunities created therein (Table-3). And this accomplishment happens to be in congruence with one of the important mandates of the Act that priority shall be given to women in such a way that at least one-third of the workers shall be from women for the
very purpose of creating an enabling environment for the women to be economically empowered so as to lay the basis for greater independence and self esteem for the poor women folk. At least, the stigma of gender discrimination in case of MGNREGS cannot be given on the state of Manipur.
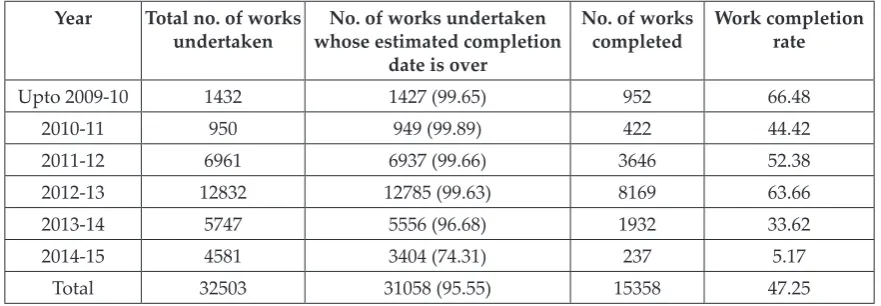
The performance of MGNREGA was also examined in the light of works undertaken and their completion rate. Table-4 is reflective of gross inefficiency in terms of work completion rate under MGNREGA in Manipur. Within the seven years between 2008-09 and 2014-15, only 47.25 per cent of the undertaken works in the state could be completed. Moreover, as high as 95.55 per cent of 32503 numbers of undertaken works remained incomplete despite their estimated completion dates were over.
Table 4: Works undertaken and completion rate under MGNREGA during 2008-09 to 2014-15
Year Total no. of works
undertaken whose estimated completion No. of works undertaken date is over
No. of works
completed Work completion rate
Upto 2009-10 1432 1427 (99.65) 952 66.48
2010-11 950 949 (99.89) 422 44.42
2011-12 6961 6937 (99.66) 3646 52.38
2012-13 12832 12785 (99.63) 8169 63.66
2013-14 5747 5556 (96.68) 1932 33.62
2014-15 4581 3404 (74.31) 237 5.17
Total 32503 31058 (95.55) 15358 47.25
Source: http://nrega.nic.in/netnrega/home.aspx
It requires a further mention that whereas more than 99 per cent of the works undertaken in Manipur during the years 2009-10, 2010-11, 2011-12 and 2012-13 could not be completed within their respective estimated dates of completion, in the best performing year of 2014-15 to this effect even the rate of work completion by scheduled completion date was found to be only 25.69 per cent and thus left 74.31 per cent of the undertaken works incomplete within the dateline (Table-4).
Though it is evident from Table-3 that altogether 1530.32 lakh person days of employment could be generated in
Table 5: Average person days of employment generation per household under MGNREGA during 2008-09 to 2014-15
Av. person days
of employment generation 2008-09 2009-10 2010-11 Financial Year2011-12 2012-13 2013-14 2014-15 Overall person days Per job demanding household 76.27 78.02 39.05 62.65 55.37 24.87 21.42 50.10
Perjob card holding
household 75.33 76.56 37.06 61.91 52.99 21.53 19.66 47.40
Source: Authors’ own calculation based on Annual Administration Reports of 2008-09 to 2014-15 of the Department of Rural Development and Panchayati Raj, Govt. of Manipur.
Despite the scenario became bit brighter in 2011-12 when employment of little over 60 person days per household was made, again there occurred a steady decline in the person days of employment per household across the years of 2012-13, 2013-14 and 2014-15. And it was so much so that in the last two years of the period under reference (i.e., 2013-14 and 2014-15), average person days of employment generation per job card holding household in countryside Manipur was shockingly low in the form of 21.53 days and 19.66 days for the earlier year and the later year respectively. Such kind of slack performance has ultimately led the overall figure of average person days of employment generation per job card holding household under MGNREGA in Manipur to stand at 47.4 days a year. It requires a clarification here that if the calculation is done on the basis of job demanding households, as is customarily being done while preparing the Annual Performance Reports by the relevant State Department, the just mentioned overall figure would be little bit better with around 50 days a year (Table-5). But, in the backdrop of the need to objectively address rural poverty in the country which paved the way for introduction of MGNREGA and the purpose with which issuance of job cards was
thought of, it won’t perhaps be inappropriate, as being urged upon by the present researchers, to calculate the performance of person days of employment generation on the basis of job card holding households in lieu of job demanding households.
The financial performance of MGNREGA in the state has been summarized through Table-6. Here, going by the year wise proportion of fund utilization as against available fund of that year, apparently the financial performance may seem to be quite satisfactory as, during five out of the seven years under study, the proportion of fund utilization to total available fund of the corresponding year was around (or even over) 92 per cent and for the years 2010-11 and 2012-13, those were 80.91 per cent and 87.44 per cent respectively. As a cumulative effect, the overall fund utilization for entire seven years also stood to be 91.97 per cent. But, this apparent good looking performance tends to become gloomy when examined in the light of per household employment generation vis-a-vis poverty scenario of the state and the work completion rate under MGNREGA as well.
Table 6: Financial performance under MGNREGA during 2008-09 to 2014-15
(Rupees in lakh)
Year Opening balance Total available fund Total expenditure Unspent amount
1 2 3 4 5
2008-09 1253.03 38540.35 35592.21 (92.35) 2948.14 (7.65)
200910 3532.77 44704.97 43570.33 (97.46) 1134.64 (2.54)
2010-11 1766.95 27706.61 22417.8 (80.91) 5288.81 (19.09)
2012-13 2752.58 55820.24 48809.32 (87.44) 7010.92 (12.56)
2013-14 2303.93 30197.78 28048.95 (92.88) 2148.83 (7.12)
2014-15 2279.26 29066.71 26708.8 (91.89) 2357.93 (8.11)
TOTAL 16330.55 280890.6 256086.52 (91.17) 24804.07 (8.83) Source: 1. Department of Rural Development and Panchayati Raj, Govt. of Manipur for 2008-09 to 2014-15.
Note: Figure in the parenthesis indicates percentage to Column 3 of corresponding year.
In 2013-14 and 2014-15, whereas Table-5 indicates that Rs.52.89 crore in 2010-11, Rs.29.49 crore in 2013-14 and Rs.23.58 crore in 202013-14-15 remained unspent, a cross examination of the Table-5, nevertheless, unveils of the sorry state of performance of per household employment generation in those years. It was 37.06 person days corresponding to 2010-11, 21.53 person days corresponding to 2013-14 and even less of 19.66 person days corresponding to 2014-15. This apart, the figure of accumulated unspent amount for the entire span of seven years has been appearing to be to the tune of Rs. 248.04 crore, which could otherwise be spent towards much aggressive endeavour in considerable enhancement of employment generation per job card holding household in the state (less than 50 days a year) to make the same to act as at least a kind of short term negotiating tool against rural poverty. It is well accepted a fact that employment generation is necessary to raise the purchasing power and thereby to create demand in the economy. A decline in the level of employment adversely affects the purchasing power and thereby the process of demand creation falters. In 2009-10, along with few other north-eastern states, the poverty in Manipur has been increased (http://www.mdoner. gov.in/content/poverty-estimates).Still later, Reserve Bank of India (2013), observed that the state of Manipur has been occupying the third position from the bottom among 29 states and 7 union territories of India with 36.89 per cent of its population living below the poverty line as against the national average of 21.92 per cent. A portion of the unspent fund might also be utilized in adequate supervision and monitoring of undertaken works under MGNREGA so as to give a boost to the poor overall work completion rate (47.25%). But, these didn’t happen and in all individual years under consideration crores of rupees remained unspent as is being revealed from Table-6.
c
oncluSionr
eFerenceSAnonymous. 2005. NREGA Operational Guidelines. Ministry of Rural Development, Government of India. (http://nrega.nic. in/Nrega_guidelines.pdf. Accessed on 9th April 2014).
Anonymous. 2013. Mahatma Gandhi National Employment Guarantee Act, 2005: Operational Guidelines (Mahatma Gandhi NREGA). 4th edition. Ministry of Rural Development, Department of Rural Development, Govt. of India, New Delhi. (http://nrega.nic.in/netnrega/WriteReaddata/Circulars/ Operational_guidelines_4thEdition_eng_2013.pdf. Accessed on 10th November, 2015).
Department of Rural Development and Panchayati Raj, Govt. of Manipur. 2008-2009. Annual Administration Report for MGNREGA. Government of Manipur.
Department of Rural Development and Panchayati Raj, Govt. of Manipur. 2009-2010. Annual Administration Report for MGNREGA. Government of Manipur.
Department of Rural Development and Panchayati Raj, Govt. of Manipur. 2010-2011. Annual Administration Report for MGNREGA. Government of Manipur.
Department of Rural Development and Panchayati Raj, Govt. of Manipur. 2011-2012. Annual Administration Report for MGNREGA. Government of Manipur.
Department of Rural Development and Panchayati Raj, Govt. of Manipur. 2012-2013. Annual Administration Report for MGNREGA. Government of Manipur.
Department of Rural Development and Panchayati Raj, Govt. of Manipur. 2013-2014. Annual Administration Report for MGNREGA. Government of Manipur.
Department of Rural Development and Panchayati Raj, Govt. of Manipur. 2014-2015. Annual Administration Report for MGNREGA. Government of Manipur.
Economic Survey. 2008-09. Directorate of Economics & Statistics, Government of Manipur, Imphal.
Ghosh, J.K. 2011. Impact of NREGA on Wage Rates, Food Security and Rural Urban Migration in West Bengal. Agro-Economic Research Centre, Visva-Bharati Santiniketan.
Hulme, D. and Shepherd A. 2003. Conceptualizing Chronic Poverty. World Develop., 31: 403-423.
Jha, R. and Raghav, G. 2012. NREGS: Interpreting the Official Statistics, Economic & Political Weekly, XLVII 40: 18-22. Jha, R., Raghav, G. and Shankar, S. 2008. Reviewing the National
Rural Employment Guarantee Programme, Economic and Political Weekly 43(10): 44–48.
Pathak, D.C. and Mishra, S. 2011. Poverty Estimates in India: Old and New Methods, 2004-05. Working Paper- 2011-015. Indira Gandhi Inst. of Dev. Res, Mumbai. (http://www.igidr.ac.in/ pdf/publication/WP-2011-015.pdf accessed on 3.6.15)
Reserve Bank of India. 2013. Indian states and territories ranked by poverty.Table 162, Number and percentage of population below poverty line. Reserve Bank of India, Government of India. 2013. Retrieved April 20, 2014.
Sen, A. 1993. Capability and Well-being In: Nussbaum, M. and Sen, A. (Eds.), The Quality of Life. Claredon Press, Oxford, pp.30-53.
Singh, H. 2012. Mahatma Gandhi National Rural Employment Guarantee Act (MGNREGA): Issues and challenges, Int. J. Res. in Commer. Econ. Manage 1:136-140
o
nlined
ocumentShttp://nrega.nic.in/netnrega/home.aspx