Ribosome Profiling of
Synechocystis
Reveals Altered Ribosome
Allocation at Carbon Starvation
Jan Karlsen,a Johannes Asplund-Samuelsson,a Quentin Thomas,a* Michael Jahn,a Elton P. Hudsona
aSchool of Engineering Sciences in Chemistry, Biotechnology and Health, Science for Life Laboratory, KTH
Royal Institute of Technology, Solna, Sweden
ABSTRACT Cyanobacteria experience both rapid and periodic fluctuations in light and inorganic carbon (Ci) and have evolved regulatory mechanisms to respond to these,
in-cluding extensive posttranscriptional gene regulation. We report the first genome-wide ribosome profiling data set for cyanobacteria, where ribosome occupancy on mRNA is quantified with codon-level precision. We measured the transcriptome and translatome ofSynechocystisduring autotrophic growth before (high carbon [HC] condition) and 24 h after removing CO2from the feedgas (low carbon [LC] condition). Ribosome occupancy
patterns in the 5= untranslated region suggest that ribosomes can assemble there and slide to the Shine-Dalgarno site, where they pause. At LC, total translation was reduced by 80% and ribosome pausing was increased at stop and start codons and in untrans-lated regions, which may be a sequestration mechanism to inactivate ribosomes in re-sponse to rapid Ci depletion. Several stress response genes, such as thioredoxin M
(sll1057), a putative endonuclease (slr0915), protease HtrA (slr1204), and heat shock pro-tein HspA (sll1514) showed marked increases in translational efficiency at LC, indicating translational control in response to Ci depletion. Ribosome pause scores within open
reading frames were mostly constant, though several ribosomal proteins had signifi-cantly altered pause score distributions at LC, which might indicate translational regula-tion of ribosome biosynthesis in response to Cidepletion. We show that ribosome
profil-ing is a powerful tool to decipher dynamic gene regulation strategies in cyanobacteria.
IMPORTANCE Ribosome profiling accesses the translational step of gene expression via deep sequencing of ribosome-protected mRNA footprints. Pairing of ribosome profiling and transcriptomics data provides a translational efficiency for each gene. Here, the translatome and transcriptome of the model cyanobacterium Synechocystis were com-pared under carbon-replete and carbon starvation conditions. The latter may be experi-enced when cyanobacteria are cultivated in poorly mixed bioreactors or engineered to be product-secreting cell factories. A small fraction of genes (⬍200), including stress re-sponse genes, showed changes in translational efficiency during carbon starvation, indi-cating condition-dependent translation-level regulation. We observed ribosome occu-pancy in untranslated regions, possibly due to an alternative translation initiation mechanism inSynechocystis.The higher proportion of ribosomes residing in untranslated regions during carbon starvation may be a mechanism to quickly inactivate superfluous ribosomes. This work provides the first ribosome profiling data for cyanobacteria and re-veals new regulation strategies for coping with nutrient limitation.
KEYWORDS cyanobacteria, gene regulation, light stress, translational control
C
yanobacteria experience large fluctuations in the availability of inorganic carbon (Ci). The partial pressures of CO2 in lakes and rivers vary significantly on a daily,weekly, and seasonal scale (1). Due to the importance of cyanobacteria as primary producers, the Ciresponse has been examined in detail at the biochemical and system
levels (reviewed in reference 2). The response to Ci limitation is also relevant for
Received13 July 2018Accepted11 September 2018 Published16 October 2018
CitationKarlsen J, Asplund-Samuelsson J, Thomas Q, Jahn M, Hudson EP. 2018. Ribosome profiling ofSynechocystisreveals altered ribosome allocation at carbon starvation. mSystems 3:e00126-18.https://doi.org/10 .1128/mSystems.00126-18.
EditorDavid F. Savage, University of California, Berkeley
Copyright© 2018 Karlsen et al. This is an open-access article distributed under the terms of theCreative Commons Attribution 4.0 International license.
Address correspondence to Elton P. Hudson, paul.hudson@biotech.kth.se.
*Present address: Quentin Thomas, Department of Plant and Environmental Sciences, Copenhagen Plant Science Centre, University of Copenhagen, Frederiksberg, Denmark.
J.K. and J.A.-S. contributed equally to this work. Novel Systems Biology Techniques
crossm
on September 8, 2020 by guest
http://msystems.asm.org/
biotechnological applications, as insufficient gas transfer and mixing in large microal-gae cultivations can reduce productivity (3–4). Furthermore, cyanobacterial strains engineered for biofuel or biochemical production may encounter a Cilimitation as core
metabolites are converted to product, resulting in reduced photosynthetic capacity over time (5).
The regulatory network and transcriptional regulators governing theSynechocystis Ci limitation response were elucidated mostly by using gene expression microarrays
(6–8). Complexity was added with the discovery that cyanobacteria have a higher quantity of noncoding RNAs (ncRNAs) than other bacteria and that several prominent ncRNAs are involved in gene regulation during nutrient shifts, including Ciand light (9).
Further evidence of posttranscriptional regulation in cyanobacteria can be inferred from reports showing that the transcriptome oscillates strongly during the day/night cycle, while proteome oscillations are weak or nonexistent (10–11).
Ribosome profiling quantifies the translation step of gene expression through deep sequencing of ribosome-protected RNA fragments (RPFs, or “footprints”) (12). Aligning and counting RPFs allows estimation of protein synthesis rates throughout the genome, thus providing a measure of cellular resource allocation at the time of sampling. Additionally, the distribution of RPFs mapped within an open reading frame (ORF) indicates ribosome pausing during elongation (13). Comparative ribosome profiling can reveal time- or condition-dependent translational gene regulation. For example, anti-biotic biosynthesis pathways inStreptomyces coelicolorwere found to be “translation-ally induced” as cells enter stationary phase, as evidenced by increases in translational efficiency for genes in secondary metabolism (14). Also working with Streptomyces coelicolor, Bucca et al. reported an increase in translational efficiency of several genes upon temperature shift from 30°C to 42°C (15). Ribosome profiling of Synechocystis during Cidepletion might, thus, reveal new mechanisms for how carbon limitation is
ultimately transduced to an altered proteome.
Here we used genome-wide ribosome profiling to examine the response of Syn-echocystissp. strain PCC6803 (Synechocystis) to Cidepletion. By comparing data from
ribosome profiling and transcriptomics, we found that 7% of genes showed enrichment or depletion of relative ribosome density on mRNAs after Ci depletion, suggesting
translational regulation. Ribosome profiling revealed ribosome pausing during transla-tion, which increased at Ci starvation on start and stop codons and in 5= and 3=
untranslated regions (UTRs). Enhanced ribosome occupancy in UTRs at Ci starvation
suggests that these regions may serve as sequestration sites for excess ribosomes in response to rapid loss of nutrient.
RESULTS
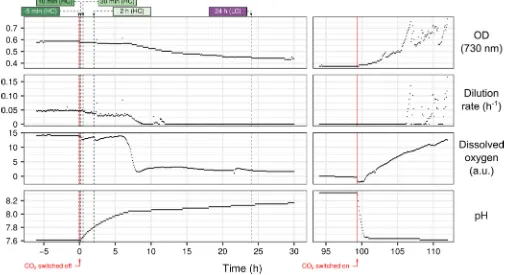
Ci starvation reduces global protein synthesis and alters the allocation of translating ribosomes.Synechocystiswas grown in a turbidostat photobioreactor fed with CO2-enriched air (3%) for 6 days to achieve steady state. A Cidepletion phase was
initiated by switching off the CO2component of the inlet gas (Fig. 1). A simultaneous
rise in culture pH, drop in photosynthetic activity (80% decrease), and arrest in cell growth rate indicated transition to a Ci-limited condition after 6 h. However, protein
synthesis did not stop completely; a puromycin incorporation assay showed 20% of overall translational activity remained 24 h after CO2switch-off (Fig. S1). Cells were also
still viable and resumed growth upon addition of CO2back to the feed gas after 4 days.
Samples were collected at five time points relative to the CO2 switch-off; ⫺5 min,
⫹10 min,⫹30 min,⫹2 h, and⫹24 h. Ribosome profiling reads of the first four samples correlated strongly with each other (r⬎0.997) (Fig. S2) but significantly more weakly to the⫹24-h sample. We therefore considered the first four samples technical replicates of cells growing under conditions of replete Ci(high Ci[HC]) and considered the⫹24-h
sample under Ci-starved conditions (low Ci[LC]).
The number of RPF reads that map to an ORF (RPF reads per million mapped reads [RPF RPM]) corresponds to the number of ribosomes translating that gene’s transcripts (Fig. 2A). Normalization of a gene RPF RPM to gene length gives the RPF read density
Karlsen et al.
on September 8, 2020 by guest
http://msystems.asm.org/
(RPF RPKM). The RPF RPM and RPF RPKM are proportional to protein synthesis rate by mass and number, respectively, assuming that the average specific elongation rate is constant (16). The change in protein synthesis (RPF RPKM) between HC and LC was significant for 750 genes (304 up, 446 down; absolute log2-fold change⬎1;q⬍0.05
in Grubbs’ test for outliers) (Fig. 2B;Table S1). We used CyanoBase functional categories to interpret changes (Fig. 2C). At HC, protein synthesis within Photosynthesis and Respiration and Translation was prioritized, with 34% and 12% of total RPF RPKM allocated, respectively. At LC, the priority of protein synthesis shifted to the functional categoriesHypothetical,Cellular Processes, andRegulatory Functions, though the large reallocation was due mainly to the change of a few genes:slr0376in theHypothetical category (46% of RPF RPKM in this category at LC, 7% at HC),gifAin the Regulatory category (58% at LC, 2% at HC), andpilA1inCellular Processes(83% at LC and 47% at HC). Theslr0376operon (slr0373-slr0376) has been implicated previously in Cistarvation
(17–18) and provides an example of potential translational control. While the mRNA abundance increased similarly (⬃10-fold) for all three genes, the protein synthesis rate increased 3.2-, 10.7-, and 18.3-fold for slr0373,slr0374, andslr0376, respectively, sug-gesting thatslr0373andslr0376are regulated at both the transcriptional and transla-tional levels (Fig. S3). Overall, 69% (53/77) and 36% (19/53) of genes reported to be upregulated in response to Cilimitation in previous transcriptomics (8) and proteomics
(19) data sets, respectively, were also upregulated in our data set. Discrepancies may be attributed to differences in translational efficiency, protein degradation, coverage, and experimental setups. Our analysis also includes several hypothetical proteins that were only recently annotated by the NCBI Prokaryotic Genome Annotation Pipeline (2017). Among these, SGL_RS18840, SGL_RS18795 and SGL_RS10635 were more prominently expressed at LC (fold changes of 46, 6.4, and 6.0, respectively).
We also compared ribosome profiling-derived mass protein synthesis rates at HC (89% coverage; 3,207/3,594 ORFs) to relative protein mass fractions measured with liquid chromatography-mass spectrometry (LC-MS) shotgun proteomics (58%
cover-FIG 1 Cistarvation slows photosynthesis. Illustration of the experimental conditions in the photobioreactor. CO2supply was switched off at time zero, and
samples were taken at⫺5 min,⫹10 min,⫹30 min,⫹2 h (representing HC conditions), and⫹24 h (LC condition), indicated by dashed vertical lines. CO2supply
was switched on again at⫹4 days. Dissolved oxygen is normalized so that 0 represents oxygen concentration of air-saturated media. a.u., arbitrary units.
on September 8, 2020 by guest
http://msystems.asm.org/
age; 2,116/3,672 proteins). The correlation was positive but weak (r⫽0.54) (Fig. 2D). Discrepancies can be due to biases in protein isolation and purification and in peptide fragmentation and ionization in the MS, active degradation of some proteins, the possibility that the ribosome elongation rate is not constant across all genes, or slight differences in cultivation conditions.
FIG 2 Protein synthesis rates probed by ribosome profiling. (A) Transcription level (mRNA) and protein synthesis rate (ribosome-protected footprints [RPFs]) of the RuBisCO operon under the HC sample at⫺5 min (HC*) and LC conditions. Black vertical lines indicate ORF boundaries. Red vertical bars indicate RPMs greater than 250. (B) Comparison of RPF RPKMs under HC*and LC conditions. Each point is one ORF passing filtration cutoffs. (C) Total RPF RPKM for ORFs grouped by CyanoBase functional categories (1st level). “No annotation” indicates that no information was available for the feature ID. (D) Comparison of protein synthesis rates to protein abundances. Points represent matching ORFs in the HC*RPF sample and the proteomes of cells under 100mol photons m⫺2s⫺1with aof 0.0485 h⫺1(45).*HC, sample at⫺5 min.
Karlsen et al.
on September 8, 2020 by guest
http://msystems.asm.org/
Gene-specific translational regulation of several genes at LC.Protein synthesis in prokaryotes is known to be regulated globally by controlling the number of active ribosomes (20) and locally by riboswitches or binding of regulatory proteins or RNAs (21). The translational efficiency (TE) of a gene is a measure of protein synthesis per mRNA (TE⫽RPF RPKM/mRNA RPKM). Gene-specific translational regulation in response to Cidepletion changes TE between HC and LC conditions. Most genes fell within a
2-order of magnitude range of TE at HC and LC (Fig. 3A and B), and TEs were generally conserved between HC and LC as changes in RPF RPKM were concomitant with changes in mRNA for most genes (Fig. 3C and D). However, TE increased or decreased more than 2-fold for 94 and 72 ORFs (7% of ORFs), respectively (Table S2). Glutamine synthetase-inactivating factor IF7 (gifA,ssl1911) had the highest increase in TE at LC (12.6-fold). The increase in translation (80-fold increase in RPF RPKM) exceeded tran-scriptional amplification (6.4-fold increase in mRNA RPKM). Several genes associated with a high-light stress response, including a putative endonuclease (slr0915), thiore-doxin M (sll1057), protease HtrA (slr1204), and heat shock protein HspA (sll1514), were amplified only at the translational level. The heat shock protein HspA is translationally activated via a thermosensitive 5=UTR (22).
The TE of a gene is relative to the TE of other genes measured at the same condition, since RPF RPKM and mRNA RPKM are relative measures of protein synthesis rate and mRNA abundance. Changes in TEs between HC and LC are, thus, not affected by changes in total cellular protein synthesis rate and mRNA abundance, which are globally regulated.
Ribosome occupancy in the 5=UTR suggests translation preinitiation upstream of the Shine-Dalgarno (SD) ribosome binding site.Mapped RPF reads within a gene are typically unevenly distributed due to ribosome pausing during elongation (Fig. 2A).
FIG 3 Inferring gene-specific translational regulation from changes in translational efficiency (TE). (A) mRNA (transcription) and RPF RPKM under HC*and LC conditions. Each point is one ORF passing filtration cutoffs. (B) Distribution of TE (RPF RPKM divided by mRNA RPKM) under HC*and LC conditions. (C) TE under HC*and LC conditions. Specific genes with a higher TE under LC than under HC*(see Results) are emphasized in red. (D) Log2-transformed fold changes (FC)
in mRNA and RPF RPKM between HC*and LC conditions.*HC, sample at⫺5 min.
on September 8, 2020 by guest
http://msystems.asm.org/
We calculated the average ribosome pause score (PS) at each nucleotide position over ORFs (3,206 ORFs) (Fig. 4A; see also Materials and Methods). The PS was defined as the RPF read density at a gene position normalized to the average RPF read density on the ORF and is indicative of the time ribosomes spend at that position. Thus, the average
FIG 4 Ribosome pausing and sequestration during Cistarvation. Pause score (PS) describes the propensity of ribosomes to slow down at a certain feature
(nucleotide, codon), normalized to the ORF to which the feature is associated (see Materials and Methods). (A) Average nucleotide PSs at gene 5=and 3=ends for each sample, color coded as described below. Note thatslr1474was removed from the data set for plotting in order to avoid noise associated with the upstream noncoding sequence SGL_RS18415, making the total number of contributing ORFs 3,206. (B) Fraction of ORFs with a 5=UTR average read density above AIRD or not (see Materials and Methods) in different CyanoBase functional categories (1st level). “No annotation” indicates that a function was not available for the feature ID. (C) Composition of the first 50 nucleotides upstream of the start codon represented as sequence logos (see Materials and Methods). Letter height indicates above background information content and is scaled so that the tallest stack (position⫺2 in the bottom logo) corresponds to 0.31. (D) Median codon PS under HC*and LC conditions. Stop codons (TAA, TAG, and TGA) are emphasized in red.*HC, sample at⫺5 min.
Karlsen et al.
on September 8, 2020 by guest
http://msystems.asm.org/
PS over each ORF is equal to 1 and independent of expression level. Mapped RPF reads were assigned to the genome position corresponding to the first nucleotide in the A site of the ribosome. The PS was elevated at start and stop codons (⫹3 nucleotides [nt] in the 5= end and ⫺2 nt in the 3= end, respectively) since translation initiation and termination are generally slower than one elongation cycle (23, 24). There was a sharp decrease in PS downstream of initiation, followed by a ramping from⫹3 to⫹125 nt (diminished at LC), suggesting faster elongation in 5=ends. Three-nucleotide periodicity in the average PS along ORFs reflects codon-by-codon movement of elongating ribosomes and that resolution is approximately one codon. We note that while there were differences in the median PSs of all 64 codons across the genome, a large variation in PS within each codon precluded correlation of the PS to amino acid type or tRNA abundance (Fig. S4).
We also observed ribosome occupancy in many 5=and 3=UTRs (see Materials and Methods for classification and filtering). The average 5=UTR PS showed a sharp peak around⫺10 nt (Fig. 4A); this peak was evident in many genes (Fig. S5) and indicates that the anti-SD and the SD sequence are not aligned. We looked for patterns in genes with a high 5=UTR PS, defined as a 5=UTR RPF read density higher than the average intergenic read density (AIRD) (27% of ORFs, 810/2,971). These genes were overrepre-sented in the categories Photosynthesis and Respiration and Translation (Fig. 4B), categories that demand high protein synthesis rates (Fig. 2B). Consensus sequence analysis revealed that an SD motif (AG rich) was enriched in the 5=UTRs of these genes but not in low-density 5=UTR genes. An AU-rich region (⫺40 to⫺12 nt) was apparent in both gene sets (Fig. 4C).
The PS pattern in 5= UTRs might arise within operons if some ribosomes do not disassemble at the stop codon and instead scan for downstream ORFs, where they pause (25). However, when we examined genes whose 5=UTRs were more than 150 nt away from other ORFs and, thus, likely to be the first gene in a transcriptional unit, the average PS in 5=UTRs did not change significantly and the peak at⫺10 nt remained evident (Fig. 4A;Fig. S6). This indicates that the observed ribosome occupancy in 5= UTRs is due not only to 70S scanning but also to the possibility that mechanisms for 70S assembly in the 5=UTR exist. Several genes with very high PSs at the⫺10 nt are known to be the first genes in transcriptional units (gifA,psaA, andpsaK) (Fig. S7).
At the LC condition, the PS at start and stop codons increased (Fig. 4A and D), indicating that translation initiation and termination are slowed. The PS ramping in the 5= ends of ORFs was diminished at LC, suggesting a reduced elongation rate in this region. It is unlikely that the reduced ramping pattern at LC is due to the conditions during cell harvest since no elongation inhibitors were added and the time periods to filter and freeze cells were short and similar for all collected samples (35 to 45s). Furthermore, dramatic increases in PS at the 5=ends of ORFs were seen inEscherichia coliwhen aminoacyl tRNAs were depleted (26). Among all genes, the average PS in both UTRs was elevated approximately 2-fold at LC. Changes in 5= UTR ribosome occupancy upon shift to LC correlated only weakly (r⫽0.4) with changes in protein synthesis, indicating that increased ribosome abundance in the 5= UTR does not necessarily lead to more translation (Fig. S8).
Ribosome pause score within ribosomal protein genes is altered at Ci starva-tion. The intragenic PS distributions were remarkably consistent among samples (compare, e.g., the patterns of RPF peaks in Fig. 2A). We calculated per-gene Pearson correlation coefficients for intragenic PS as a metric for how PS at each nucleotide position changed between two samples. A low correlation coefficient would indicate a significant change in PS at multiple positions within that gene. We focused on highly expressed genes (RPF RPKM ⱖ 100 under all conditions) to exclude variations in intragenic PS due to technical or biological noise (Fig. S9). The PS correlation coeffi-cients were high (mean, 0.95) and narrowly distributed when the four HC samples were compared and only slightly reduced (mean, 0.89) when HC was compared to LC (Fig. 5A). The PS distribution and local elongation rates are, thus, largely conserved within genes during shift from HC to LC. However, 31 genes had PS correlation
on September 8, 2020 by guest
http://msystems.asm.org/
coefficients of ⬍0.80 between HC and LC (Table S3). Interestingly, this gene set contained four ribosomal proteins (Fig. 5B). Ribosome biogenesis requires coordinated assembly of protein and rRNA subunits and ribosome demand is clearly reduced at LC. InE. coli, there is extensive mRNA-based, autogenous regulation of ribosomal proteins that control ribosome assembly, where ribosomal proteins bind their own mRNA to prevent translation (27). In light of reports that local mRNA structure and cotransla-tional events can hinder translation elongation (28–30), the observed increases in PS in ribosomal genes inSynechocystismay be at sites of autogenous or small RNA (sRNA) binding.
DISCUSSION
The translational efficiency (TE) of genes was largely constant between HC and LC, despite large changes in mRNA abundance. This suggests that most ncRNA-mediated regulation during Cistarvation does not specifically affect ribosome binding or
elon-gation. Accordingly, genes known to be regulated by the high-light-responsive ncRNA PsrR1 (cpcA,chiN,psaJ) did not show TE changes in our data, even though PsrR1 is also upregulated during Ci downshift (31). However, 7% of genes did exhibit a TE fold
change of⬎2. The mechanisms of how translational control is effected are difficult to decipher from ribosome profiling data alone, though some clues can be found. For example, thegifAprotein product IF7 is an inhibitor of glutamine synthase and, thus, contributes to balancing N and C assimilation during nutrient shifts (32). At LC, the expression ofgifAwas strongly upregulated both at the transcriptional (6-fold increase in RNA RPKM) and translational (13-fold increase in TE) levels. Thetrans-acting sRNA NsiR4, induced primarily during nitrogen starvation, coregulatesgifAthrough imperfect hybridization to the 5=UTR, resulting in double-stranded RNA (dsRNA) degradation (33). The downregulation of NsiR4 at LC (34) might explain the observed elevation ingifA
FIG 5 Condition-dependent changes in ribosome pause score within genes. Nucleotide pause scores, including those for 5=and 3=UTRs, were inverse hyperbolic sine transformed and used to calculate Pearson correlation coefficients for each gene at each time point. (A) Histogram of PS correlation coefficients showing very high correlations for all genes among HC samples (mean, 0.95) and lower correlations between HC samples and LC (mean, 0.89). (B) Pause score changes from HC*to LC mapped onto four ribosomal genes that showed correlation coefficients of⬍0.80. Black vertical lines indicate start and stop codons. *HC, sample at⫺5 min.
Karlsen et al.
on September 8, 2020 by guest
http://msystems.asm.org/
mRNA as well as the increase in gifA TE, since improved ribosome binding and translation initiation can be expected as NsiR4 no longer blocks the ribosome binding site. An increased rate of ribosome binding may further explain the elevated 5=UTR PS ofgifAat LC.
Several translationally controlled genes reported here can be considered part of a common stress response; an endonuclease, a protease, and thioredoxin M all exhibited increases in protein synthesis without a corresponding increase in mRNA. Translational control of these genes may be a faster way of coordinating their expression than a transcription program (15, 22). It is not known whether these genes have a common effector; Cidepletion induces many ncRNAs with unknown targets (34).
The observed RPF read density in 5= UTRs indicates the presence of bound 70S ribosomes and that ribosome assembly may occur upstream of the classical SD-dependent ribosome assembly site. One possibility is 70S scanning, first reported inE. coli, where preassembled 70S ribosomes slide to the start codon from the stop codon of the upstream ORF (25). This mechanism also explains the read density observed in the 3=UTR. Furthermore, a 55% downregulation of the ribosome release factor (sll0145) (Table S2) is consistent with increased UTR read density at LC. However, the 5=UTR read density was not significantly lower for genes lacking an upstream ORF (Fig. 4A;Fig. S6) which suggests that additional mechanisms of ribosome assembly upstream of the SD binding site exist in Synechocystis, possibly in the AU-rich region (⫺15 to ⫺45 nt) (Fig. 4C). In line with this hypothesis, the AU-rich region has been shown to bind the 30S ribosomal protein S1 (slr1356andslr1984inSynechocystis) and to be necessary for efficient translation ofSynechococcus rbcS in vitro (35). 70S assembly in the AU-rich region would further require a subsequent slide in the 5=-to-3=direction to position the E-site over the start codon. The average PS in 5=UTRs had 3 nt periodicity, albeit with lower regularity, which might indicate a stepwise movement of ribosomes. The strong peak in average PS at the ⫺10 nt position indicates that ribosomes pause before reaching the start codon, possibly due to ribosome interaction with the SD motif. The presence of novel initiation mechanisms in cyanobacteria has also been proposed based on phylogenetic analysis (36). However, orthogonal analyses are required to validate the mechanism proposed from our data set.
Though Cidepletion resulted in a rapid decrease in growth rate and total translation,
the total ribosomal content did not change significantly (total RNA abundance in RNA extracts as proxy), implying that HC ribosomes may be inactivated at LC, as recently described forE. coliduring nutrient limitation (20). We observed dimerization of 70S ribosomes into inactive 100S particles (Fig. S10). A second possible inactivation mech-anism is stabilization of unproductive 70S particles by a protein factor that binds the 30S and 50S interface and blocks the mRNA channel, such as YfiA in E. coli (37). However, we did not observe a large increase in 70S particles at LC. Furthermore, the YfiA homolog LrtA (sll0947) (38) was not significantly changed at LC (Table S1). The increased ribosome occupancy in UTRs at LC may represent an alternative form of ribosome “inactivation,” namely, sequestration at noncoding regions of mRNA. This type of ribosome inactivation could be beneficial for cells in response to nutrient stress, as the regulation of total translational capacity can be coupled to the regulation of certain metabolic pathways. For example, strong upregulation of thegifAmRNA at LC not only results in reduced nitrogen uptake but also reduces the number of active ribosomes due to its high ribosome occupancy in the 5=UTR relative to the translated region.
MATERIALS AND METHODS
Cultivation and experimental setup.Synechocystissp. PCC 6803 was cultivated in turbidostat mode (optical density at 730 nm [OD730] set point⫽ 0.54) in BG-11 medium (1.6 liters; pH 7.8; 30°C) in a
cylindrical photobioreactor (d⫽100 mm; modified JENNY; Belach Bioteknik AB). Irradiance (200mol photons m⫺2s⫺1) was supplied by a red/blue LED jacket (90% red, 10% blue). Inlet gas flow and stirrer
rate was 0.2 liters min⫺1and 150 rpm, respectively. The pH was automatically regulated to 7.6 by the
concentration of CO2in the inlet gas to provide stable and unlimited availability of Ciin the medium
(3.4% CO2at stable pH). After 6 days, Cidepletion was initiated by switching off the CO2supply and
sparging the culture with CO2-free air. Samples for ribosome profiling were collected at ⫺5 min,
on September 8, 2020 by guest
http://msystems.asm.org/
⫹10 min,⫹30 min,⫹2 h, and⫹24 h after switch-off. Samples for mRNA sequencing were collected at
⫺5 min and⫹24 h. Temperature, pH, dissolved oxygen, medium feed rate, and OD880were continuously
monitored throughout the cultivation time course. OD730was measured externally at specific time points
in order to convert online OD880measurements.
Ribosome profiling.A detailed protocol is available in Supplemental Methods (Text S1). Cells from 110 ml culture were rapidly harvested by vacuum filtration and snap-frozen in liquid nitrogen (stored at
⫺80°C). The time to transfer cells from culture to liquid nitrogen was typically around 45 s. Lysis was performed by cryogenic grinding together with frozen droplets of lysis buffer. The pulverized lysate was thawed in additional lysis buffer, and cell debris was removed by centrifugation. The nucleic acid concentration in the cleared lysate was calculated from OD260 measurements. A volume corresponding to 1 mg of nucleic acids was digested with 3,000 U of micrococcal nuclease (New England Biolabs; M0247) on a thermoshaker for 1 h at 25°C and 450 rpm. The digest was subsequently loaded on top of a 10 to 50% sucrose gradient and centrifuged for 2.5 h at 217,000⫻gand 4°C. The 70S fraction was selected, and a hot phenol-chloroform method was used to extract the RNA. RPFs were isolated by size selection on a denaturing polyacrylamide gel. Around 50g RNA was loaded, and fragments ranging between 25 and 45 nt were cut out. Following T4 PNK treatment, RPFs were converted to a cDNA sequencing library using the NEBNext small RNA library prep set (New England Biolabs; E7300). Around 40 ng of RNA was used as starting material, and 16 PCR cycles were run in the amplification step. Sequencing was performed on an Illumina NextSeq 500 platform (75-bp read length, single end).
mRNA sequencing.Samples for mRNA sequencing (25 ml) were collected 5 min before the CO2
switch-off and 24 h after. Total RNA was extracted and depleted of rRNA before fragmentation and conversion into cDNA sequencing libraries following protocols provided by kit manufacturers. See the supplemental methods (Text S1) for details. Libraries were sequenced on an Illumina MiniSeq platform (75-bp read length, single end).
Puromycin incorporation assay. The total translational activity was measured by puromycin incorporation in biological duplicates at⫺5 min,⫹2 h, and⫹24 h relative to a CO2switch-off in a
replicated cultivation setup. See the supplemental methods (Text S1) for details.
Quality control, filtering, and mapping of sequencing reads to the genome.Data analysis was performed using Python v.3.5.2 and R v.3.4.4, Bash commands parallelized using GNU Parallel v.20141022 (39), and Python v.2.7.12 scripts adapted from reference 40. The quality and general properties of the sequence data sets were initially analyzed using FastQC (Babraham Bioinformatics). Adapter sequences were removed with Cutadapt (41). Reads with an average quality score lower than 25 were removed using seqmagick v.0.6.2 (https://github.com/fhcrc/seqmagick/). Bowtie v.1.1.2 (42) was used to remove reads mapping to rRNA or tRNA sequences (31 to 49% and 89% of the reads in the ribosome profiling and mRNA sequencing data set, respectively). Remaining reads were mapped to the genome (NC_000911.1) using Bowtie. A maximum of two alignment mismatches were allowed. In case of multiple mappings of a read, the one with the fewest mismatches was selected. The read was discarded if a unique location could not be mapped in this manner. The total number of non-rRNA/tRNA reads mapped to the genome was 39 to 63 million and 3 million per sample in the ribosome profiling and RNA sequencing (RNA-seq) data set, respectively. The per-sample read length distributions for all mapped footprints are shown inFig. S11. Assigning read counts to the 3=end of mapped RPF reads provides superior accuracy and is compatible with a P-site placement 15 nt upstream of the 3=edge of the translated mRNA (23), confirming the distance established by structural experiments (43, 44). Thus, we assumed that the A site is situated 12 nt from the 3=edge. In order to apply 3=assignment and A-site mapping, the genome position aligning to the 3=end of each mapped RPF read was first assigned a read count of 1. Only 25-nt or longer reads were accepted. The signal was then aligned to the first nucleotide position in the A site of ribosomes by shifting all 3=-end-assigned read counts 12 positions upstream, a distance that is supported by an abrupt drop in read counts 12 nt after the stop codon if the shift is not applied (Fig. S12). In contrast, the count for each RNA-seq read was distributed evenly over all its aligning genome positions. The numbers of reads mapped to annotated ORFs (coding DNA sequences [CDSs] defined in the GenBank file for NCBI reference sequence NC_000911.1) were subsequently counted. The expression level of a gene (RPKM) was calculated by dividing the ORF read count by the total number of reads (in millions) mapped to ORFs for ribosome profiling or the whole genome for RNA-seq and the length (in thousand base pairs) of the ORF. RPM at single genome positions were calculated by dividing the assigned read count by the total number of reads mapped to the genome (in million reads). Analyses focused on genes were limited to those withⱖ128 andⱖ32 mapped reads at all time points for the ribosome profiling and RNA-seq data set, respectively.
Comparison of ribosome profiling to RNA-seq and proteomics.Per-gene RPKM values at time points⫺5 min and⫹24 h were used for Pearson correlation of the ribosome profiling and RNA-seq data sets. Translational efficiency was calculated for each gene and each of the two time points as RPF RPKM divided by mRNA RPKM. Furthermore, per-gene RPM values at time point⫺5 min were used for Pearson correlation of the ribosome profiling data to proteome mass fraction determined by LC-MS shotgun proteomics of cells under 100mol photons m⫺2s⫺1and aof 0.0485 h⫺1(45).
Differential gene expression analysis.The four initial time points showed highly similar gene RPKM values (mean Pearsonr2, 0.996), while the 24-h time point was divergent (mean Pearsonr2, 0.757). RPKM
values were inverse hyperbolic sine transformed and then subjected to a per-gene Grubbs outlier test (R
functions asinh and grubbs.test). Significant differential expression in the last time point was assumed if it was identified as an outlier with a Benjamini-Hochberg adjustedqvalue of⬍0.05 (Rfunction p.adjust) and an absolute log2-fold change of⬎1 compared to the mean of the first four time points.
Karlsen et al.
on September 8, 2020 by guest
http://msystems.asm.org/
PS calculation for analysis of ribosome pausing.Pause score (PS) was calculated by dividing the number of reads mapped to a feature by the length of the feature and then dividing by the same metric for the associated ORF (excluding UTR reads). Excluding genes not meeting the read count requirement above, PS was calculated for all non-pseudo-ORF codons and for all nucleotides in positions⫺50 from the start codons (5=end) to⫹50 from the stop codons (3=end) of ORFs. Note that single nucleotide PS values were not calculated for positions within other genes and that positions outside the ORF were not included in the length or read count of the gene used for PS calculation.
Evaluation of 5=UTR read densities.Here we define the 5=UTR as the region encompassing positions⫺50 to⫺1 relative to the start codon, excluding positions within other ORFs. In order to identify genes with a high 5=UTR PS, the read density was calculated for all 5=UTRs and was considered significant if it exceeded the average intergenic read density (AIRD) for each time point. AIRD was calculated as the average read count per nucleotide and time point for positions outside ORFs with at least one mapped mRNA read, including 5=UTRs.
5=UTRs with lengths ofⱖ6 nt were extracted from the genome nucleotide FASTA file and aligned so that their 3=end corresponded to the closest nucleotide upstream of the ORF. The alignments were used to create sequence logos for significantly high PS 5=UTRs and other 5=UTRs, usinghttp://skylign.org/, displaying above-background information content based on observed counts.
Accession number(s).Raw sequencing data are available at the European Nucleotide Archive under accession numberPRJEB28203. LC-MS shotgun proteomics data are available at the PRIDE Archive under accession numberPXD009582(45).
ACKNOWLEDGMENTS
We thank Vicent Pelechano (Karolinska Institutet), A. Amunts (Stockholm University), Lukas Käll (KTH), Ton van Maris (KTH), and the Bakau Lab (University of Heidelberg) for valuable discussions and technical assistance.
This work was supported by the Swedish Research Council Formas (grant 2015-939), the Swedish Foundation for Strategic Research SSF (grant RBP14-0013), and the Swed-ish Research Council Vetenskapsrådet (grant 2016-06160).
J.K., J.A.-S., Q.T., and E.P.H. conceived the project. J.K. and Q.T. performed cultivations and sequencing. J.A.-S. performed data analysis. M.J. performed proteomics and pro-vided technical assistance. J.K., J.A.-S., and E.P.H. wrote the manuscript with contribu-tions from all authors.
REFERENCES
1. Morales-Pineda M, Cózar A, Laiz I, Úbeda B, Gálvez JÁ. 2014. Daily, biweekly, and seasonal temporal scales of pCO2 variability in two strat-ified Mediterranean reservoirs. J Geophys Res Biogeosci 119:509 –520.
https://doi.org/10.1002/2013JG002317.
2. Burnap R, Hagemann M, Kaplan A. 2015. Regulation of CO2
concentrat-ing mechanism in cyanobacteria. Life (Basel) 5:348 –371.https://doi.org/ 10.3390/life5010348.
3. Silva TL, Reis A. 2015. Scale-up problems for the large scale production of algae, p 125–149.In Das D (ed), Algal biorefinery: an integrated approach. Springer International Publishing, Basel, Switzerland. 4. Tamburic B, Evenhuis CR, Suggett DJ, Larkum AWD, Raven JA, Ralph PJ.
2015. Gas transfer controls carbon limitation during biomass production by marine microalgae. ChemSusChem 8:2727–2736.https://doi.org/10 .1002/cssc.201500332.
5. Kopka J, Schmidt S, Dethloff F, Pade N, Berendt S, Schottkowski M, Martin N, Dühring U, Kuchmina E, Enke H, Kramer D, Wilde A, Hagemann M, Friedrich A. 2017. Systems analysis of ethanol production in the genetically engineered cyanobacterium Synechococcus sp. PCC 7002. Biotechnol Biofuels 10:56.https://doi.org/10.1186/s13068-017-0741-0. 6. Wang HL, Postier BL, Burnap RL. 2004. Alterations in global patterns of
gene expression in Synechocystis sp. PCC 6803 in response to inorganic carbon limitation and the inactivation of ndhR, a LysR family regulator. J Biol Chem 279:5739 –5751.https://doi.org/10.1074/jbc.M311336200. 7. Eisenhut M, von Wobeser EA, Jonas L, Schubert H, Ibelings BW, Bauwe H,
Matthijs HCP, Hagemann M. 2007. Long-term response toward inorganic carbon limitation in wild type and glycolate turnover mutants of the Cyanobacterium Synechocystis sp. strain PCC 6803. Plant Physiol 144: 1946 –1959.https://doi.org/10.1104/pp.107.103341.
8. Orf I, Schwarz D, Kaplan A, Kopka J, Hess WR, Hagemann M, Klähn S. 2016. CyAbrB2 contributes to the transcriptional regulation of low CO2
acclimation in Synechocystis sp. PCC 6803. Plant Cell Physiol 57: 2232–2243.https://doi.org/10.1093/pcp/pcw146.
9. Kopf M, Hess WR. 2015. Regulatory RNAs in photosynthetic
cyanobac-teria. FEMS Microbiol Rev 39:301–315.https://doi.org/10.1093/femsre/ fuv017.
10. Guerreiro ACL, Benevento M, Lehmann R, van Breukelen B, Post H, Giansanti P, Maarten Altelaar AF, Axmann IM, Heck AJR. 2014. Daily rhythms in the cyanobacterium Synechococcus elongatus probed by high-resolution mass spectrometry-based proteomics reveals a small defined set of cyclic proteins. Mol Cell Proteomics 13:2042–2055.https:// doi.org/10.1074/mcp.M113.035840.
11. Waldbauer JR, Rodrigue S, Coleman ML, Chisholm SW. 2012. Tran-scriptome and proteome dynamics of a light-dark synchronized bac-terial cell cycle. PLoS One 7:e43432.https://doi.org/10.1371/journal .pone.0043432.
12. Ingolia NT, Ghaemmaghami S, Newman JRS, Weissman JS. 2009. Genome-wide analysis in vivo of translation with nucleotide resolution using ribosome profiling. Science 324:218 –223.https://doi.org/10.1126/ science.1168978.
13. Brar GA, Weissman JS. 2015. Ribosome profiling reveals the what, when, where and how of protein synthesis. Nat Rev Mol Cell Biol 16:651– 664.
https://doi.org/10.1038/nrm4069.
14. Jeong Y, Kim JN, Kim MW, Bucca G, Cho S, Yoon YJ, Kim BG, Roe JH, Kim SC, Smith CP, Cho BK. 2016. The dynamic transcriptional and translational landscape of the model antibiotic producer Streptomy-ces coelicolor A3(2). Nat Commun 7:11605.https://doi.org/10.1038/ ncomms11605.
15. Bucca G, Pothi R, Hesketh A, Moller-Levet C, Hodgson DA, Laing EE, Stewart GR, Smith CP. 2018. Translational control plays an important role in the adaptive heat-shock response of Streptomyces coelicolor. bioRxiv 46:5692.https://doi.org/10.1093/nar/gky335.
16. Li GW, Burkhardt D, Gross C, Weissman JS. 2014. Quantifying absolute protein synthesis rates reveals principles underlying allocation of cellular resources. Cell 157:624 – 635.https://doi.org/10.1016/j.cell.2014.02.033. 17. Singh AK, Sherman LA. 2002. Characterization of a stress-responsive
on September 8, 2020 by guest
http://msystems.asm.org/
operon in the cyanobacterium Synechocystis sp. strain PCC 6803. Gene 297:11–19.https://doi.org/10.1016/S0378-1119(02)00888-0.
18. Jiang HB, Song WY, Cheng HM, Qiu BS. 2015. The hypothetical protein Ycf46 is involved in regulation of CO2utilization in the cyanobacterium
Synechocystis sp. PCC 6803. Planta 241:145–155. https://doi.org/10 .1007/s00425-014-2169-0.
19. Battchikova N, Vainonen JP, Vorontsova N, Kera¨Nen M, Carmel D, Aro E-M. 2010. Dynamic changes in the proteome of synechocystis 6803 in response to CO2limitation revealed by quantitative proteomics. J
Pro-teome Res 9:5896 –5912.https://doi.org/10.1021/pr100651w.
20. Dai X, Zhu M, Warren M, Balakrishnan R, Patsalo V, Okano H, Williamson JR, Fredrick K, Wang YP, Hwa T. 2017. Reduction of translating ribosomes enables Escherichia coli to maintain elongation rates during slow growth. Nat Microbiol 2:1–9. https://doi.org/10.1038/nmicrobiol.2016 .231.
21. Duval M, Simonetti A, Caldelari I, Marzi S. 2015. Multiple ways to regulate translation initiation in bacteria: mechanisms, regulatory circuits, dy-namics. Biochimie 114:18 –29. https://doi.org/10.1016/j.biochi.2015.03 .007.
22. Kortmann J, Sczodrok S, Rinnenthal J, Schwalbe H, Narberhaus F. 2011. Translation on demand by a simple RNA-based thermosensor. Nucleic Acids Res 39:2855–2868.https://doi.org/10.1093/nar/gkq1252. 23. Woolstenhulme CJ, Guydosh NR, Green R, Buskirk AR. 2015.
High-precision analysis of translational pausing by ribosome profiling in bacteria lacking EFP. Cell Rep 11:13–21.https://doi.org/10.1016/j.celrep .2015.03.014.
24. Shah P, Ding Y, Niemczyk M, Kudla G, Plotkin JB. 2013. XRate-limiting steps in yeast protein translation. Cell 153:1589 –1601.https://doi.org/ 10.1016/j.cell.2013.05.049.
25. Yamamoto H, Wittek D, Gupta R, Qin B, Ueda T, Krause R, Yamamoto K, Albrecht R, Pech M, Nierhaus KH. 2016. 70S-scanning initiation is a novel and frequent initiation mode of ribosomal translation in bacteria. Proc Natl Acad Sci U S A 113:E1180 –E1189. https://doi.org/10.1073/pnas .1524554113.
26. Subramaniam AR, Zid BM, O’Shea EK. 2014. An integrated approach reveals regulatory controls on bacterial translation elongation. Cell 159: 1200 –1211.https://doi.org/10.1016/j.cell.2014.10.043.
27. Fu Y, Deiorio-Haggar K, Anthony J, Meyer MM. 2013. Most RNAs regu-lating ribosomal protein biosynthesis in Escherichia coli are narrowly distributed to Gammaproteobacteria. Nucleic Acids Res 41:3491–3503.
https://doi.org/10.1093/nar/gkt055.
28. Tyystjärvi T, Herranen M, Aro EM. 2001. Regulation of translation elon-gation in cyanobacteria: membrane targeting of the ribosome nascent-chain complexes controls the synthesis of D1 protein. Mol Microbiol 40:476 – 484.https://doi.org/10.1046/j.1365-2958.2001.02402.x. 29. Burkhardt DH, Rouskin S, Zhang Y, Li GW, Weissman JS, Gross CA. 2017.
Operon mRNAs are organized into ORF-centric structures that predict translation efficiency. Elife 6:1–23.https://doi.org/10.7554/eLife.22037. 30. Gawron´ski P, Jensen PE, Karpin´ski S, Leister D, Scharff LB. 2018. Plastid
ribosome pausing is induced by multiple features and is linked to protein complex assembly. Plant Physiol 176:2557. https://doi.org/10 .1104/pp.17.01564.
31. Georg J, Dienst D, Schurgers N, Wallner T, Kopp D, Stazic D, Kuchmina E, Klahn S, Lokstein H, Hess WR, Wilde A. 2014. The small regulatory RNA
SyR1/PsrR1 controls photosynthetic functions in cyanobacteria. Plant Cell 26:3661–3679.https://doi.org/10.1105/tpc.114.129767.
32. García-Domínguez M, Reyes JC, Florencio FJ. 2000. NtcA represses tran-scription of gifA and gifB, genes that encode inhibitors of glutamine synthetase type I from Synechocystis sp. PCC 6803. Mol Microbiol 35: 1192–1201.https://doi.org/10.1046/j.1365-2958.2000.01789.x. 33. Klähn S, Schaal C, Georg J, Baumgartner D, Knippen G, Hagemann M,
Muro-Pastor AM, Hess WR. 2015. The sRNA NsiR4 is involved in nitrogen assimilation control in cyanobacteria by targeting glutamine synthetase inactivating factor IF7. Proc Natl Acad Sci U S A 112:E6243–E6252.
https://doi.org/10.1073/pnas.1508412112.
34. Klähn S, Orf I, Schwarz D, Matthiessen JKF, Kopka J, Hess WR, Hagemann M. 2015. Integrated transcriptomic and metabolomic characterization of the low-carbon response using an ndhR mutant of Synechocystis sp. PCC 6803. Plant Physiol 169:114.254045.https://doi.org/10.1104/pp.114 .254045.
35. Mutsuda M, Sugiura M. 2006. Translation initiation of cyanobacterial rbcS mRNAs requires the 38-kDa ribosomal protein S1 but not the Shine-Dalgarno sequence: development of a cyanobacterial in vitro translation system. J Biol Chem 281:38314 –38321. https://doi.org/10 .1074/jbc.M604647200.
36. Nakagawa S, Niimura Y, Miura KI, Gojobori T. 2010. Dynamic evolution of translation initiation mechanisms in prokaryotes. Proc Natl Acad Sci U S A 107:6382– 6387.https://doi.org/10.1073/pnas.1002036107.
37. Polikanov YS, Blaha GM, Steitz TA. 2012. How hibernation factors RMF, HPF, and YfiA turn off protein synthesis. Science 336:915–918.https:// doi.org/10.1126/science.1218538.
38. Galmozzi CV, Florencio FJ, Muro-Pastor MI. 2016. The cyanobacterial ribosomal-associated protein LrtA is involved in post-stress survival in Synechocystis sp. PCC 6803. PLoS One 11:e0159346 – e0159324.https:// doi.org/10.1371/journal.pone.0159346.
39. Tange O. 2011. GNU Parallel: the command-line power tool. Login USENIX Mag 36:42– 47.
40. Becker AH, Oh E, Weissman JS, Kramer G, Bukau B. 2013. Selective ribosome profiling as a tool for studying the interaction of chaperones and targeting factors with nascent polypeptide chains and ribosomes. Nat Protoc 8:2212–2239.https://doi.org/10.1038/nprot.2013.133. 41. Martin M. 2011. Cutadapt removes adapter sequences from
high-throughput sequencing reads. EMBnet J 17:10.https://doi.org/10.14806/ ej.17.1.200.
42. Langmead B, Trapnell C, Pop M, Salzberg SL. 2009. Ultrafast and memory-efficient alignment of short DNA sequences to the human genome. Genome Biol 10:R25.https://doi.org/10.1186/gb-2009-10-3-r25. 43. Hartz D, McPheeters DS, Traut R, Gold L. 1988. Extension inhibition analysis of translation initiation complexes. Methods Enzymol 164: 419 – 425.https://doi.org/10.1016/S0076-6879(88)64058-4.
44. Beyer D, Skripkin E, Wadzack J, Nierhaus KH. 1994. How the ribosome moves along the mRNA during protein synthesis. J Biol Chem 269: 30713–30717.
45. Jahn M, Vialas V, Karlsen J, Maddalo G, Edfors F, Forsström B, Uhlen M, Käll L, Hudson EP. 2018. Growth of cyanobacteria is constrained by the abundance of light and carbon assimilation proteins. Cell Reports 25: 1–9.https://doi.org/10.1016/j.celrep.2018.09.040.
Karlsen et al.
![FIG 2 Protein synthesis rates probed by ribosome profiling. (A) Transcription level (mRNA) and protein synthesis rate (ribosome-protectedfootprints [RPFs]) of the RuBisCO operon under the HC sample at �5 min (HC*) and LC conditions](https://thumb-us.123doks.com/thumbv2/123dok_us/8650136.1726357/4.594.45.494.69.608/protein-synthesis-proling-transcription-synthesis-ribosome-protectedfootprints-conditions.webp)


