Iran J Public Health, Vol. 46, No.6, Jun 2017, pp.724-732
Review Article
A Comprehensive Meta-analysis on Intra Ocular Pressure and
Central Corneal Thickness in Healthy Children
Majid FARVARDIN ¹, *Fatemeh HEIDARY ¹
,², Kourosh SAYEHMIRI ³, *Reza
GHA-REBAGHI ¹, Mahmoud JABBARVAND BEHROOZ ²
1. Poostchi Eye Research Center, Dept. of Ophthalmology, Shiraz University of Medical Sciences, Shiraz, Iran 2. Eye Research Center, Farabi Eye Hospital, Tehran University of Medical Sciences, Tehran, Iran
3. Dept. of Biostatistics and Epidemiology, Ilam University of Medical Sciences, Ilam, Iran
*Corresponding Authors: Emails: [email protected], [email protected]
(Received 10 Sep 2016; accepted 21 Feb 2017)
Introduction
Glaucoma is a major ophthalmic public health issue that affects hundreds of millions of patients may consider as one of the prominent causes of blindness (1). Intraocular pressure (IOP) is regu-larly calculated and documented to monitor the progress of glaucoma while positive linear corre-lation between central corneal thickness (CCT) and IOP has been described in the literature (2).
Additionally, CCT is a significant value for understanding morphology of the cornea as well as for the development of various ophthalmic diseases including glaucoma. Numerous researches in children and adults revealed that IOP might be affected by the CCT measurement. Normally, a thin cornea underestimates whereas a thick cornea overestimates the IOP (3). CCT is a Abstract
Background: Glaucoma is the major ophthalmic public health issue and a leading basis of blindness. Elevated intra-ocular pressure (IOP) is still a foremost risk factor in development and progression of glaucoma. Central corneal thickness (CCT) may play as the risk factor for the progression of glaucoma, closely associated with IOP especially in pediatric age group. This study performed a pioneering investigation combining the outcomes of multiple studies us-ing a meta-analytic approach.
Methods: Nineteen published articles between 1980 and 2015 were designated by searching Scopus, PubMed, and Google Scholar and analyzed with random effects model while I² statistics employed to find out heterogeneity. Subse-quently, the information statistically analyzed by Stata software ver. 11.20.
Results: The mean IOP has been documented to 16.22 mmHg (95% CI: 15.48-16.97) in all races subgroups. Analyz-ing the data by race-based subgroups revealed the lowest IOP of 12.02 mmHg (95% CI: 11.40-12.64) in Indian child-ren while IOP of 17.38 mmHg (95% CI: 15.77-18.98) documented in black childchild-ren as the highest measurement. The mean CCT was 553.69 micrometer (95% CI: 551.60-555.78) among all races. Lowest CCT of 536.60 mm (95% CI: 531.82-541.38) has been documented in mixed Malay-Indian children whereas Chinese children ought to the highest CCT value of 557.68 mm (95% CI: 553.10-562.25).
Conclusion: Findings of published studies were inconsistent when considered independently; however, meta-analysis of these results showed a significant correlation between CCT and IOP. Owing to non-uniform methods used to measure IOP and CCT in studies, data were stratified into various subgroups according to the instruments used to measure IOP and CCT.
significant factor in the glaucoma diagnosis and treatment since having low CCT value may indi-cate to under-diagnosis and under-treatment of glaucoma, while a high CCT may cause to over-diagnosis and overtreatment of diseases (3). The results of some studies have indicated a relation-ship between IOP and ethnicity. Moreover, CCT might differ among subjects from different ethnic groups (3).
The main purpose of the current study was to reveal a meta-analysis to shed light on the rela-tionship between CCT and IOP in children from different ethnic subgroups. To the best of our knowledge such, a meta-analysis has not been formerly performed in this field.
Methods
Databases including PubMed, PubMed Central, SCOPUS, and Google Scholar searched for pub-lished studies related to CCT and IOP in child-ren. The search strategy has been limited to Eng-lish language publications prior to Nov 2015. Subsequently, the publication bias test performed independently. Two authors individualistically assessed the titles of all publications, eliminating duplicate papers and classifying theoretically ap-plicable researches to be included in analysis. Two authors for additional relevancy appraised abstracts from designated studies whereas full-text publications recovered. In the case of dissi-milarity, a third appraiser corresponded to as an authority. Just in case, if the full text of a publica-tion was not found, endeavors were made to con-tact directly to corresponding author by Email. Nevertheless, if this was ineffective the publica-tion was ignored.
The following information obtained from in-cluded researches: first author, year of study, age distribution, CCT, IOP, ethnicity, relationship between CCT and IOP, and instruments used to measure CCT and IOP. The principal outcome measures of interest for this manuscript were the mean CCT and IOP, as well as 95% confidence interval and relationship between CCT and IOP.
By Mantel-Haenszel, random effect modeling data was analyzed and presented in a Forest plot. The standard error of the mean for each paper was designed using the normal distribution. For pooled correlation coefficients, the effect size defined. Following this transformation, by using random effects model effect size pooled. Hetero-geneity determined by the chi-square test with a P-value less than 0.1 at significant level combined with an I² statistic for approximations of incon-sistency within the analyses. The I² statistic esti-mated the percent of observed between study variability because of heterogeneity rather than because of chance and ranged from 0 which de-fined as no heterogeneity to 100% as described to noteworthy heterogeneity. Statistically, I² values exceeding 75% were revealing of significant hete-rogeneity warranting investigation with a random effect model as opposed to the fixed effect model to adjust for the observed variability. Hetero-geneity was explored through subgroup meta-regression. Univariate and multivariate approach-es employed to consider the reasons for hetero-geneity among the selected included publications, and subsequently the Egger test performed to inspect bias. Statistical analyses performed using Stata software ver. 11.20.
Results
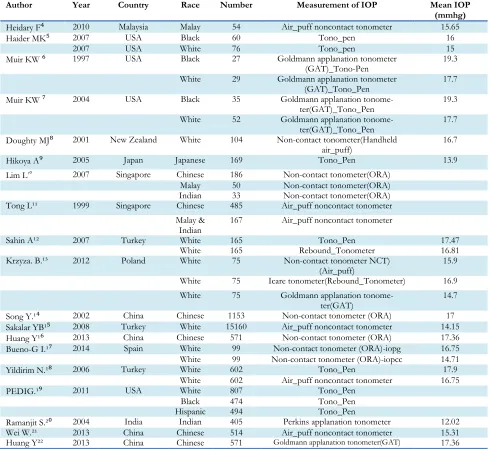
Table 1: Study characteristics of intra ocular pressure (IOP) in children
Author Year Country Race Number Measurement of IOP Mean IOP
(mmhg)
Heidary F⁴ 2010 Malaysia Malay 54 Air_puff noncontact tonometer 15.65
Haider MK⁵ 2007 USA Black 60 Tono_pen 16
2007 USA White 76 Tono_pen 15
Muir KW ⁶ 1997 USA Black 27 Goldmann applanation tonometer
(GAT)_Tono-Pen 19.3
White 29 Goldmann applanation tonometer
(GAT)_Tono_Pen 17.7
Muir KW ⁷ 2004 USA Black 35 Goldmann applanation
tonome-ter(GAT)_Tono_Pen 19.3
White 52 Goldmann applanation
tonome-ter(GAT)_Tono_Pen
17.7
Doughty MJ⁸ 2001 New Zealand White 104 Non-contact tonometer(Handheld
air_puff) 16.7
Hikoya A⁹ 2005 Japan Japanese 169 Tono_Pen 13.9
Lim L¹⁰ 2007 Singapore Chinese 186 Non-contact tonometer(ORA)
Malay 50 Non-contact tonometer(ORA)
Indian 33 Non-contact tonometer(ORA)
Tong L¹¹ 1999 Singapore Chinese 485 Air_puff noncontact tonometer
Malay &
Indian 167 Air_puff noncontact tonometer
Sahin A¹² 2007 Turkey White 165 Tono_Pen 17.47
White 165 Rebound_Tonometer 16.81
Krzyza. B.¹³ 2012 Poland White 75 Non-contact tonometer NCT)
(Air_puff) 15.9
White 75 Icare tonometer(Rebound_Tonometer) 16.9
White 75 Goldmann applanation
tonome-ter(GAT)
14.7
Song Y.¹⁴ 2002 China Chinese 1153 Non-contact tonometer (ORA) 17
Sakalar YB¹⁵ 2008 Turkey White 15160 Air_puff noncontact tonometer 14.15
Huang Y¹⁶ 2013 China Chinese 571 Non-contact tonometer (ORA) 17.36
Bueno-G I.¹⁷ 2014 Spain White 99 Non-contact tonometer (ORA)-iopg 16.75
White 99 Non-contact tonometer (ORA)-iopcc 14.71
Yildirim N.¹⁸ 2006 Turkey White 602 Tono_Pen 17.9
White 602 Air_puff noncontact tonometer 16.75
PEDIG.¹⁹ 2011 USA White 807 Tono_Pen
Black 474 Tono_Pen
Hispanic 494 Tono_Pen
Ramanjit S.²⁰ 2004 India Indian 405 Perkins applanation tonometer 12.02
Wei W.²¹ 2013 China Chinese 514 Air_puff noncontact tonometer 15.31
Huang Y²² 2013 China Chinese 571 Goldmann applanation tonometer(GAT) 17.36
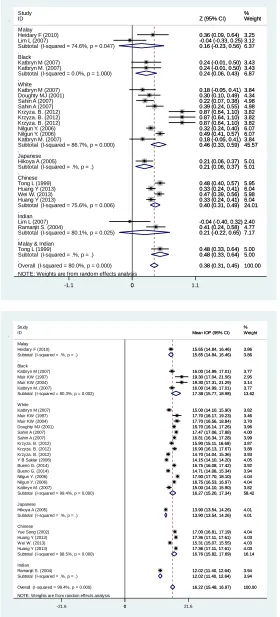
The mean IOP from included studies was 16.22 mmHg (95% CI: 15.48-16.97) in all races (Fig. 2). Instrument-based subgroups analysis for mea-surement of IOP, revealed that Rebound tono-meter had highest IOP measurements with mean IOP of 16.83 mmHg and Goldmann applanation tonometer(GAT) had lowest IOP measurements with mean IOP of 13.36 mmHg (Fig. 3).
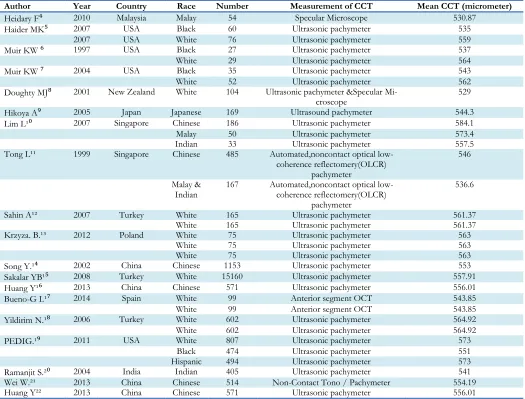
The mean CCT from all articles was 553.69 micrometer (95% CI: 551.60-555.78) (Fig. 4). Race-based subgroup analysis revealed that mixed
Malay-Indian children revealed the lowest CCT of 536.60 mm (95% CI: 531.82-541.38), whereas Chinese children had the highest CCT of 557.68 mm (95% CI: 553.10-562.25).
We presented the subgroups based on instru-ments used for measurement of CCT and IOP in Fig. 3 and 5.
Table 2: Study characteristics of central corneal thickness (CCT) in children
Author Year Country Race Number Measurement of CCT Mean CCT (micrometer)
Heidary F⁴ 2010 Malaysia Malay 54 Specular Microscope 530.87
Haider MK⁵ 2007 USA Black 60 Ultrasonic pachymeter 535
2007 USA White 76 Ultrasonic pachymeter 559
Muir KW ⁶ 1997 USA Black 27 Ultrasonic pachymeter 537
White 29 Ultrasonic pachymeter 564
Muir KW ⁷ 2004 USA Black 35 Ultrasonic pachymeter 543
White 52 Ultrasonic pachymeter 562
Doughty MJ⁸ 2001 New Zealand White 104 Ultrasonic pachymeter &Specular
Mi-croscope 529
Hikoya A⁹ 2005 Japan Japanese 169 Ultrasound pachymeter 544.3
Lim L¹⁰ 2007 Singapore Chinese 186 Ultrasonic pachymeter 584.1
Malay 50 Ultrasonic pachymeter 573.4
Indian 33 Ultrasonic pachymeter 557.5
Tong L¹¹ 1999 Singapore Chinese 485 Automated,noncontact optical
low-coherence reflectomery(OLCR) pachymeter
546
Malay &
Indian 167 Automated,noncontact optical low-coherence reflectomery(OLCR)
pachymeter
536.6
Sahin A¹² 2007 Turkey White 165 Ultrasonic pachymeter 561.37
White 165 Ultrasonic pachymeter 561.37
Krzyza. B.¹³ 2012 Poland White 75 Ultrasonic pachymeter 563
White 75 Ultrasonic pachymeter 563
White 75 Ultrasonic pachymeter 563
Song Y.¹⁴ 2002 China Chinese 1153 Ultrasonic pachymeter 553
Sakalar YB¹⁵ 2008 Turkey White 15160 Ultrasonic pachymeter 557.91
Huang Y¹⁶ 2013 China Chinese 571 Ultrasonic pachymeter 556.01
Bueno-G I.¹⁷ 2014 Spain White 99 Anterior segment OCT 543.85
White 99 Anterior segment OCT 543.85
Yildirim N.¹⁸ 2006 Turkey White 602 Ultrasonic pachymeter 564.92
White 602 Ultrasonic pachymeter 564.92
PEDIG.¹⁹ 2011 USA White 807 Ultrasonic pachymeter 573
Black 474 Ultrasonic pachymeter 551
Hispanic 494 Ultrasonic pachymeter 573
Ramanjit S.²⁰ 2004 India Indian 405 Ultrasonic pachymeter 541
Wei W.²¹ 2013 China Chinese 514 Non-Contact Tono / Pachymeter 554.19
Huang Y²² 2013 China Chinese 571 Ultrasonic pachymeter 556.01
Discussion
Our results revealed that the mean IOP and CCT documented to 16.22 mmHg and 553.69 mm, respectively. The final analysis disclosed ethnici-ty-based differences in IOP and CCT measure-ment. Analyzing race-based subgroups showed Indian children with lowest IOP of 12.02 mmHg whereas black children with the highest IOP of 17.38 mmHg. Mixed Malay-Indian children pre-sented with the lowest CCT of 536.60 mm whe-reas Chinese children with the highest CCT of 557.68 mm. Our research is the meta-analysis approach of CCT and IOP in children; however,
since CCT and IOP measurements performed with different instruments, we were unable to compare outcomes across studies.
NOTE: Weights are from random effects analysis . . . . . . .
Overall (I-squared = 80.0%, p = 0.000) Subtotal (I-squared = 86.7%, p = 0.000) Katbryn M (2007)
Huang Y (2013) Nilgun Y. (2006)
Malay & Indian Tong L (1999) Huang Y (2013) Krzyza. B. (2012) Nilgun Y. (2006)
Subtotal (I-squared = 0.0%, p = 1.000)
Lim L (2007)
Subtotal (I-squared = .%, p = .)
Subtotal (I-squared = 75.6%, p = 0.006)
Subtotal (I-squared = 80.1%, p = 0.025) Katbryn M (2007)
Chinese ID
Indian White Katbryn M. (2007)
Katbryn M. (2007)
Wei W. (2013)
Ramanjit S. (2004) Krzyza. B. (2012) Krzyza. B. (2012) Doughty MJ (2001)
Japanese Study
Hikoya A (2005)
Tong L (1999) Lim L (2007)
Subtotal (I-squared = .%, p = .) Sahin A (2007)
Heidary F (2010)
Black
Subtotal (I-squared = 74.6%, p = 0.047)
Sahin A (2007) Malay
0.38 (0.31, 0.45) 0.46 (0.33, 0.59) 0.24 (-0.01, 0.50)
0.33 (0.24, 0.41) 0.49 (0.41, 0.57)
0.48 (0.40, 0.57) 0.33 (0.24, 0.41) 0.87 (0.64, 1.10) 0.32 (0.24, 0.40) 0.24 (0.06, 0.43)
-0.04 (-0.40, 0.32) 0.21 (0.06, 0.37)
0.40 (0.31, 0.49)
0.21 (-0.22, 0.65) 0.18 (-0.05, 0.41) Z (95% CI)
0.24 (-0.01, 0.50)
0.18 (-0.05, 0.41)
0.47 (0.39, 0.56)
0.41 (0.24, 0.58) 0.87 (0.64, 1.10) 0.87 (0.64, 1.10) 0.30 (0.10, 0.49)
0.21 (0.06, 0.37)
0.48 (0.33, 0.64) -0.04 (-0.33, 0.25)
0.48 (0.33, 0.64) 0.39 (0.24, 0.55) 0.36 (0.09, 0.64) 0.16 (-0.23, 0.56)
0.22 (0.07, 0.38)
100.00 45.57 3.43 6.04 6.07 5.95 6.04 3.82 6.07 6.87 2.40 5.01 24.01 7.17 3.84 Weight 3.43 3.84 5.98 4.77 3.82 3.82 4.34 % 5.01 5.00 3.12 5.00 4.98 3.25 6.37 4.98
0.38 (0.31, 0.45) 0.46 (0.33, 0.59) 0.24 (-0.01, 0.50)
0.33 (0.24, 0.41) 0.49 (0.41, 0.57)
0.48 (0.40, 0.57) 0.33 (0.24, 0.41) 0.87 (0.64, 1.10) 0.32 (0.24, 0.40) 0.24 (0.06, 0.43)
-0.04 (-0.40, 0.32) 0.21 (0.06, 0.37)
0.40 (0.31, 0.49)
0.21 (-0.22, 0.65) 0.18 (-0.05, 0.41) Z (95% CI)
0.24 (-0.01, 0.50)
0.18 (-0.05, 0.41)
0.47 (0.39, 0.56)
0.41 (0.24, 0.58) 0.87 (0.64, 1.10) 0.87 (0.64, 1.10) 0.30 (0.10, 0.49)
0.21 (0.06, 0.37)
0.48 (0.33, 0.64) -0.04 (-0.33, 0.25)
0.48 (0.33, 0.64) 0.39 (0.24, 0.55) 0.36 (0.09, 0.64) 0.16 (-0.23, 0.56)
0.22 (0.07, 0.38)
100.00 45.57 3.43 6.04 6.07 5.95 6.04 3.82 6.07 6.87 2.40 5.01 24.01 7.17 3.84 Weight 3.43 3.84 5.98 4.77 3.82 3.82 4.34 % 5.01 5.00 3.12 5.00 4.98 3.25 6.37 4.98 0
-1.1 0 1.1
NOTE: Weights are from random effects analysis . . . . . .
Overall (I-squared = 99.4%, p = 0.000) Heidary F (2010)
Sahin A (2007)
Subtotal (I-squared = 99.4%, p = 0.000) Katbryn M (2007)
Muir KW (1997) Subtotal (I-squared = .%, p = .) Study
Subtotal (I-squared = 98.5%, p = 0.000) Nilgun Y. (2006)
Doughty MJ (2001) Sahin A (2007)
Wei W. (2013) Katbryn M. (2007)
Indian Huang Y (2013) Yue Song (2002)
Huang Y (2013) Bueno G. (2014)
Nilgun Y. (2006) Muir KW (2004)
Muir KW (2004) Black
Subtotal (I-squared = .%, p = .) Ramanjit S. (2004) Krzyza. B. (2012)
Bueno G. (2014) Y B Saklar (2008) Krzyza. B. (2012) ID
Japanese Hikoya A (2005) Krzyza. B. (2012) Katbryn M. (2007) Malay
Muir KW (1997) White
Chinese
Subtotal (I-squared = .%, p = .) Subtotal (I-squared = 80.3%, p = 0.002) Katbryn M (2007)
16.22 (15.48, 16.97) 15.65 (14.84, 16.46)
16.81 (16.34, 17.28)
16.27 (15.20, 17.34) 15.00 (14.10, 15.90) 19.30 (17.04, 21.56) 15.65 (14.84, 16.46)
16.76 (15.82, 17.69) 17.90 (17.70, 18.10) 16.70 (16.14, 17.26) 17.47 (17.06, 17.88)
15.31 (15.07, 15.55) 15.00 (14.10, 15.90)
17.36 (17.11, 17.61) 17.00 (16.81, 17.19)
17.36 (17.11, 17.61) 16.75 (16.08, 17.42)
16.75 (16.53, 16.97) 19.30 (17.31, 21.29)
17.70 (16.56, 18.84)
12.02 (11.40, 12.64) 12.02 (11.40, 12.64) 16.90 (16.13, 17.67)
14.71 (14.08, 15.34) 14.15 (14.10, 14.20) 14.70 (14.04, 15.36) Mean IOP (95% CI)
13.90 (13.54, 14.26) 15.90 (15.11, 16.69) 16.00 (14.99, 17.01)
17.70 (16.17, 19.23)
13.90 (13.54, 14.26) 17.38 (15.77, 18.98) 16.00 (14.99, 17.01)
100.00 3.86 3.99 58.42 3.82 2.95 3.86 % 16.14 4.04 3.96 4.00 4.03 3.82 4.03 4.04 4.03 3.92 4.04 3.14 3.70 3.94 3.94 3.88 3.94 4.05 3.93 Weight 4.01 3.87 3.77 3.46 4.01 13.62 3.77
16.22 (15.48, 16.97) 15.65 (14.84, 16.46)
16.81 (16.34, 17.28)
16.27 (15.20, 17.34) 15.00 (14.10, 15.90) 19.30 (17.04, 21.56) 15.65 (14.84, 16.46)
16.76 (15.82, 17.69) 17.90 (17.70, 18.10) 16.70 (16.14, 17.26) 17.47 (17.06, 17.88)
15.31 (15.07, 15.55) 15.00 (14.10, 15.90)
17.36 (17.11, 17.61) 17.00 (16.81, 17.19)
17.36 (17.11, 17.61) 16.75 (16.08, 17.42)
16.75 (16.53, 16.97) 19.30 (17.31, 21.29)
17.70 (16.56, 18.84)
12.02 (11.40, 12.64) 12.02 (11.40, 12.64) 16.90 (16.13, 17.67)
14.71 (14.08, 15.34) 14.15 (14.10, 14.20) 14.70 (14.04, 15.36) Mean IOP (95% CI)
13.90 (13.54, 14.26) 15.90 (15.11, 16.69) 16.00 (14.99, 17.01)
17.70 (16.17, 19.23)
13.90 (13.54, 14.26) 17.38 (15.77, 18.98) 16.00 (14.99, 17.01)
100.00 3.86 3.99 58.42 3.82 2.95 3.86 % 16.14 4.04 3.96 4.00 4.03 3.82 4.03 4.04 4.03 3.92 4.04 3.14 3.70 3.94 3.94 3.88 3.94 4.05 3.93 Weight 4.01 3.87 3.77 3.46 4.01 13.62 3.77 0
-21.6 0 21.6
Fig. 1: Logarithm transformation of
correlation coefficients between IOP and CCT. Squares corresponded to effect estimate of outcomes with 95% confidence intervals as the size of the squares proportional to the weight al-located to the included publications. Diamonds reveal the overall outcomes and 95% confidence interval of the random effect. Lines reveal the confi-dence interval. Publications that do not cross the zero line show a meaningful correlation between CCT and IOP. The outcomes show a significant cor-relation between CCT and IOP (r=0.0,
P=00)
NOTE: Weights are from random effects analysis . . . . .
Overall (I-squared = 99.4%, p = 0.000) Subtotal (I-squared = 97.5%, p = 0.000)
Bueno G. (2014) Huang Y (2013) Yue Song (2002) Muir KW (1997)
Subtotal (I-squared = 97.0%, p = 0.000) Study
ID
Katbryn M. (2007)
Krzyza. B. (2012)
Subtotal (I-squared = 94.9%, p = 0.000)
Ramanjit S. (2004) Huang Y (2013)
Subtotal (I-squared = 99.3%, p = 0.000)
Sahin A (2007) Y B Saklar (2008)
Bueno G. (2014) Muir KW (2004)
Rebound_Tonometer Air_puff noncontact tonometer
Katbryn M (2007) Katbryn M (2007) Krzyza. B. (2012)
Sahin A (2007)
Subtotal (I-squared = 0.0%, p = 0.845) Nilgun Y. (2006)
Nilgun Y. (2006)
Muir KW (1997)
Goldmann applanation tonometer(GAT) Wei W. (2013)
Krzyza. B. (2012) non-contact tonometer(ORA) Katbryn M. (2007)
Goldmann applanation tonometer(GAT)_Tono-Pen/Tono-Pen Doughty MJ (2001)
Heidary F (2010)
Muir KW (2004) Hikoya A (2005)
16.22 (15.48, 16.97) 16.76 (15.82, 17.70)
16.75 (16.08, 17.42) 17.36 (17.11, 17.61) 17.00 (16.81, 17.19) 17.70 (16.17, 19.23)
13.36 (10.73, 15.98) Mean IOP (95% CI)
16.00 (14.99, 17.01)
16.90 (16.13, 17.67) 16.51 (15.75, 17.27)
12.02 (11.40, 12.64) 17.36 (17.11, 17.61) 15.74 (14.56, 16.91)
17.47 (17.06, 17.88) 14.15 (14.10, 14.20)
14.71 (14.08, 15.34) 17.70 (16.56, 18.84) 15.00 (14.10, 15.90) 16.00 (14.99, 17.01) 15.90 (15.11, 16.69)
16.81 (16.34, 17.28) 16.83 (16.43, 17.24) 17.90 (17.70, 18.10) 16.75 (16.53, 16.97)
19.30 (17.04, 21.56) 15.31 (15.07, 15.55)
14.70 (14.04, 15.36) 15.00 (14.10, 15.90) 16.70 (16.14, 17.26) 15.65 (14.84, 16.46)
19.30 (17.31, 21.29) 13.90 (13.54, 14.26)
100.00 44.51 3.92 4.03 4.04 3.46 7.87 % Weight 3.77 3.88 15.93 3.94 4.03 23.82 4.00 4.05 3.94 3.70 3.82 3.77 3.87 3.99 7.87 4.04 4.04 2.95 4.03 3.93 3.82 3.96 3.86 3.14 4.01
16.22 (15.48, 16.97) 16.76 (15.82, 17.70)
16.75 (16.08, 17.42) 17.36 (17.11, 17.61) 17.00 (16.81, 17.19) 17.70 (16.17, 19.23)
13.36 (10.73, 15.98) Mean IOP (95% CI)
16.00 (14.99, 17.01)
16.90 (16.13, 17.67) 16.51 (15.75, 17.27)
12.02 (11.40, 12.64) 17.36 (17.11, 17.61) 15.74 (14.56, 16.91)
17.47 (17.06, 17.88) 14.15 (14.10, 14.20)
14.71 (14.08, 15.34) 17.70 (16.56, 18.84) 15.00 (14.10, 15.90) 16.00 (14.99, 17.01) 15.90 (15.11, 16.69)
16.81 (16.34, 17.28) 16.83 (16.43, 17.24) 17.90 (17.70, 18.10) 16.75 (16.53, 16.97)
19.30 (17.04, 21.56) 15.31 (15.07, 15.55)
14.70 (14.04, 15.36) 15.00 (14.10, 15.90) 16.70 (16.14, 17.26) 15.65 (14.84, 16.46)
19.30 (17.31, 21.29) 13.90 (13.54, 14.26)
100.00 44.51 3.92 4.03 4.04 3.46 7.87 % Weight 3.77 3.88 15.93 3.94 4.03 23.82 4.00 4.05 3.94 3.70 3.82 3.77 3.87 3.99 7.87 4.04 4.04 2.95 4.03 3.93 3.82 3.96 3.86 3.14 4.01 0
-21.6 0 21.6
NOTE: Weights are from random effects analysis . . . . . . .
Overall (I-squared = 96.0%, p = 0.000) Tong L (1999)
Katbryn M. (2007)
Subtotal (I-squared = 97.3%, p = 0.000) Huang Y (2013)
Muir KW (2004)
Subtotal (I-squared = .%, p = .) Subtotal (I-squared = 87.4%, p = 0.005) Doughty MJ (2001)
Subtotal (I-squared = 0.0%, p = 0.729)
Nilgun Y. (2006) Muir KW (2004)
Lim L (2007) Sahin A (2007)
Nilgun Y. (2006)
Japanese Krzyza. B. (2012)
Subtotal (I-squared = .%, p = .)
Ramanjit S. (2004) Katbryn M (2007) Malay
Katbryn M. (2007)
Chinese Study
Huang Y (2013) Y B Saklar (2008) Krzyza. B. (2012) Katbryn M (2007) Heidary F (2010) Lim L (2007)
Malay & Indian Sahin A (2007)
Tong L (1999) Muir KW (1997)
Indian
Subtotal (I-squared = 91.9%, p = 0.000) Hikoya A (2005)
Bueno G. (2014) Muir KW (1997)
Wei W. (2013) Yue Song (2002) Black
Krzyza. B. (2012)
Subtotal (I-squared = 97.9%, p = 0.000)
Lim L (2007) ID
Bueno G. (2014) White
553.69 (551.60, 555.78) 536.60 (531.82, 541.38) 559.00 (550.46, 567.54)
557.68 (553.10, 562.25) 556.01 (553.63, 558.39) 562.00 (552.49, 571.51)
536.60 (531.82, 541.38) 548.58 (532.46, 564.69) 529.00 (522.47, 535.53) 536.71 (531.55, 541.86)
564.92 (562.36, 567.48) 543.00 (530.74, 555.26)
584.10 (579.31, 588.89) 561.37 (555.72, 567.02)
564.92 (562.36, 567.48) 563.00 (556.21, 569.79)
544.30 (538.74, 549.86)
541.00 (536.20, 545.80) 559.00 (550.46, 567.54) 535.00 (526.14, 543.86)
556.01 (553.66, 558.36) 557.91 (557.36, 558.46) 563.00 (556.21, 569.79) 535.00 (526.14, 543.86) 530.87 (522.66, 539.08) 573.40 (564.36, 582.44)
561.37 (555.72, 567.02)
546.00 (543.17, 548.83) 564.00 (553.81, 574.19)
557.45 (553.79, 561.11) 544.30 (538.74, 549.86) 543.85 (536.83, 550.87) 537.00 (523.42, 550.58)
554.19 (553.89, 554.49) 553.00 (551.11, 554.89) 563.00 (556.21, 569.79) 552.09 (510.41, 593.77)
557.50 (547.09, 567.91) Mean CCT (95% CI)
543.85 (536.83, 550.87)
100.00 3.69 2.59 25.50 4.31 2.34 3.69 5.82 3.15 8.34 4.28 1.77 3.68 3.42 4.28 3.08 3.45 3.68 2.59 2.51 % 4.32 4.56 3.08 2.51 2.68 2.46 3.42 4.22 2.19 48.07 3.45 3.01 1.56 4.57 4.40 3.08 5.14 2.14 Weight 3.01
553.69 (551.60, 555.78) 536.60 (531.82, 541.38) 559.00 (550.46, 567.54)
557.68 (553.10, 562.25) 556.01 (553.63, 558.39) 562.00 (552.49, 571.51)
536.60 (531.82, 541.38) 548.58 (532.46, 564.69) 529.00 (522.47, 535.53) 536.71 (531.55, 541.86)
564.92 (562.36, 567.48) 543.00 (530.74, 555.26)
584.10 (579.31, 588.89) 561.37 (555.72, 567.02)
564.92 (562.36, 567.48) 563.00 (556.21, 569.79)
544.30 (538.74, 549.86)
541.00 (536.20, 545.80) 559.00 (550.46, 567.54) 535.00 (526.14, 543.86)
556.01 (553.66, 558.36) 557.91 (557.36, 558.46) 563.00 (556.21, 569.79) 535.00 (526.14, 543.86) 530.87 (522.66, 539.08) 573.40 (564.36, 582.44)
561.37 (555.72, 567.02)
546.00 (543.17, 548.83) 564.00 (553.81, 574.19)
557.45 (553.79, 561.11) 544.30 (538.74, 549.86) 543.85 (536.83, 550.87) 537.00 (523.42, 550.58)
554.19 (553.89, 554.49) 553.00 (551.11, 554.89) 563.00 (556.21, 569.79) 552.09 (510.41, 593.77)
557.50 (547.09, 567.91) Mean CCT (95% CI)
543.85 (536.83, 550.87)
100.00 3.69 2.59 25.50 4.31 2.34 3.69 5.82 3.15 8.34 4.28 1.77 3.68 3.42 4.28 3.08 3.45 3.68 2.59 2.51 % 4.32 4.56 3.08 2.51 2.68 2.46 3.42 4.22 2.19 48.07 3.45 3.01 1.56 4.57 4.40 3.08 5.14 2.14 Weight 3.01 0
-594 0 594
Fig. 3: Mean IOP based on the
in-strument that used. Squares corres-ponded to effect estimate of outcomes with 95% confidence intervals with the size of the squares proportional to the weight allocated to the included publi-cations. Diamonds reveal the overall outcomes and 95% confidence interval of the random effect.
Fig. 4: Mean CCT based on ethnicity
Fig. 5: Mean CCT based on instrument that used. Squares corresponded to effect estimate of outcomes with 95% confidence intervals with the size of the squares proportional to the weight allocated to the included publications. Diamonds reveal the overall outcomes and 95% confidence interval of the random effect.
Former studies showed influence of socioeco-nomic status on CCT and IOP (4). The socioe-conomic backgrounds or effects of environmen-tal factors, as well as levels of malnutrition, were not documented in extracted studies, therefore, we were unable to analyze. This may merit fur-ther investigation in future studies as well as lon-gitudinal approach in order to categorize subjects based on their level of socioeconomic status and may measure effect of environmental factors on biophysics of ocular structure.
Different instruments may yield different docu-mentation in measurement of CCT in the same case, for instance, a measurement by specular
microscopy may result meaningfully lower values than ultrasound pachymeter measurement (23). In another study, CCT measurements of different instruments were compared while finding out contact specular microscopy was substantially documented lower than measured using other instruments (24).
There is controversial issue in relationship be-tween age and CCT. CCT gradually increases by 5 yr of age, upon which it may reach steady prior beginning to decrease at 10–14 yr of old (6). Relationship between CCT and IOP among children less than 10 yr of age was struggled, did not realize any difference in CCT among the
dif-NOTE: Weights are from random effects analysis .
. . .
.
Overall (I-squared = 96.0%, p = 0.000) Katbryn M. (2007)
Bueno G. (2014) Bueno G. (2014)
Subtotal (I-squared = .%, p = .) ID
Katbryn M. (2007)
Tong L (1999) Muir KW (1997)
Krzyza. B. (2012)
Subtotal (I-squared = 0.0%, p = 0.727)
Lim L (2007)
Subtotal (I-squared = 90.9%, p = 0.001)
Non Contact Tono / Pachymeter ultrasonic pachymeter
Muir KW (2004)
Huang Y (2013)
Wei W. (2013) Krzyza. B. (2012) Hikoya A (2005)
Nilgun Y. (2006) Lim L (2007)
Tong L (1999) Muir KW (1997)
Krzyza. B. (2012) Heidary F (2010)
Subtotal (I-squared = 0.0%, p = 1.000) Sahin A (2007)
Lim L (2007) Katbryn M (2007)
Huang Y (2013) Doughty MJ (2001)
Muir KW (2004)
Sahin A (2007)
Yue Song (2002)
Ramanjit S. (2004) Nilgun Y. (2006)
automated,noncontact optical low-coherence reflectomery(OLCR) pachymeter Subtotal (I-squared = 93.7%, p = 0.000)
Katbryn M (2007)
Y B Saklar (2008)
Anterior segment OCT
ultrasonic pachymeter & or Specular Microscope Study
553.69 (551.60, 555.78) 535.00 (526.14, 543.86)
543.85 (536.83, 550.87) 543.85 (536.83, 550.87)
554.19 (553.89, 554.49) Mean CCT (95% CI)
559.00 (550.46, 567.54)
546.00 (543.17, 548.83) 564.00 (553.81, 574.19)
563.00 (556.21, 569.79) 529.72 (524.61, 534.84)
557.50 (547.09, 567.91)
541.51 (532.30, 550.71) 543.00 (530.74, 555.26)
556.01 (553.66, 558.36)
554.19 (553.89, 554.49) 563.00 (556.21, 569.79) 544.30 (538.74, 549.86)
564.92 (562.36, 567.48) 584.10 (579.31, 588.89)
536.60 (531.82, 541.38) 537.00 (523.42, 550.58)
563.00 (556.21, 569.79) 530.87 (522.66, 539.08)
543.85 (538.88, 548.82) 561.37 (555.72, 567.02) 573.40 (564.36, 582.44) 535.00 (526.14, 543.86)
556.01 (553.63, 558.39) 529.00 (522.47, 535.53)
562.00 (552.49, 571.51)
561.37 (555.72, 567.02)
553.00 (551.11, 554.89)
541.00 (536.20, 545.80) 564.92 (562.36, 567.48)
557.33 (554.44, 560.23) 559.00 (550.46, 567.54)
557.91 (557.36, 558.46)
100.00 2.51
3.01 3.01
4.57 Weight
2.59
4.22 2.19
3.08 5.83
2.14
7.90 1.77
4.32
4.57 3.08 3.45
4.28 3.68
3.69 1.56
3.08 2.68
6.02 3.42 2.46 2.51
4.31 3.15
2.34
3.42
4.40
3.68 4.28
75.68 2.59
4.56 %
553.69 (551.60, 555.78) 535.00 (526.14, 543.86)
543.85 (536.83, 550.87) 543.85 (536.83, 550.87)
554.19 (553.89, 554.49) Mean CCT (95% CI)
559.00 (550.46, 567.54)
546.00 (543.17, 548.83) 564.00 (553.81, 574.19)
563.00 (556.21, 569.79) 529.72 (524.61, 534.84)
557.50 (547.09, 567.91)
541.51 (532.30, 550.71) 543.00 (530.74, 555.26)
556.01 (553.66, 558.36)
554.19 (553.89, 554.49) 563.00 (556.21, 569.79) 544.30 (538.74, 549.86)
564.92 (562.36, 567.48) 584.10 (579.31, 588.89)
536.60 (531.82, 541.38) 537.00 (523.42, 550.58)
563.00 (556.21, 569.79) 530.87 (522.66, 539.08)
543.85 (538.88, 548.82) 561.37 (555.72, 567.02) 573.40 (564.36, 582.44) 535.00 (526.14, 543.86)
556.01 (553.63, 558.39) 529.00 (522.47, 535.53)
562.00 (552.49, 571.51)
561.37 (555.72, 567.02)
553.00 (551.11, 554.89)
541.00 (536.20, 545.80) 564.92 (562.36, 567.48)
557.33 (554.44, 560.23) 559.00 (550.46, 567.54)
557.91 (557.36, 558.46)
100.00 2.51
3.01 3.01
4.57 Weight
2.59
4.22 2.19
3.08 5.83
2.14
7.90 1.77
4.32
4.57 3.08 3.45
4.28 3.68
3.69 1.56
3.08 2.68
6.02 3.42 2.46 2.51
4.31 3.15
2.34
3.42
4.40
3.68 4.28
75.68 2.59
4.56 %
0
ferent age subgroups (4). In our meta-analysis, most of included publications did not classify their participants into subgroups; therefore, we were unable to formulate age-based comparisons. A modification factor of 2.5 mmHg was recom-mended for each 50-micrometer difference in CCT (25). Actually, evidence regarding the link between CCT and IOP are controversial. Al-though a few studies observed no meaningful relationship between mean IOP and CCT among either African American (R = 0.24) or White (R = 0.18) children (5) others demonstrated the positive relationship like our analysis revealed a very significant relationship between IOP and CCT (P=0.00), as conclusion.
The limitation of the current study was largely associated with the methodology approach of the reviewed publications, individually. Lack of a uni-form method of the measurements were the pri-mary limitation; however, such a meta-analysis has not been formerly performed in this field considered as the strength of this research in or-der to summarize the findings of all related stu-dies and reach the final conclusion regarding the mean CCT and IOP and their relationship. Discovering of racial differences in normal ocular structures may establish invaluable reference value and may promote further understanding of various ocular disorders(26), therefore, future meta-analysis on normal ocular structure are also required.
Conclusion
Findings of published studies were inconsistent when considered independently; however, meta-analysis of these results showed a significant cor-relation between CCT and IOP. Owing to non-uniform methods used to measure IOP and CCT in studies, data were stratified into various sub-groups according to the instruments used to measure IOP and CCT.
Ethical considerations
Ethical issues (Including plagiarism, informed consent, misconduct, data fabrication and/or fal-sification, double publication and/or submission,
redundancy, etc.) have been completely observed by the authors.
Acknowledgments
This Meta-analysis was supported by Deputy Dean of School of Medicine and Deputy Chan-cellor of Shiraz University of Medical Sciences, Shiraz, Iran, project number 14244. The funders had no contribution in data collection, analysis, design, manuscript preparation or ruling to pub-lish.
Conflict of Interests
The authors declare that there is no conflict of interest.
References
1. Heidary F, Heidary R, Jamali H, Gharebaghi R (2015). Afraid of the Dark; Raising Awareness of Societies Each Year during World Glau-coma Week. Iran J Public Health, 44(5):716-7. 2. Copt RP, Thomas R, Mermoud A (1999).
Cor-neal thickness in ocular hypertension, primary open-angle glaucoma, and normal tension glaucoma. Arch Ophthalmol, 117(1):14-6. 3. Aghaian E, Choe JE, Lin S, Stamper RL (2004).
Central corneal thickness of Caucasians, Chi-nese, Hispanics, Filipinos, African Americans, and Japanese in a glaucoma clinic. Ophthalmol-ogy, 111(12):2211-9.
4. Heidary F, Gharebaghi R, Wan Hitam WH, Naing NN, Wan-Arfah N, Shatriah I (2011). Central corneal thickness and intraocular pressure in Malay children. PLoS One, 6(10):e25208.
5. Haider KM, Mickler C, Oliver D, Moya FJ, Cruz OA, Davitt BV (2008). Age and racial varia-tion in central corneal thickness of preschool and school-aged children. J Pediatr Ophthalmol Strabismus, 45(4):227-33.
6. Muir KW, Jin J, Freedman SF (2004). Central corneal thickness and its relationship to intra-ocular pressure in children. Ophthalmology, 111(12):2220-3.
Racial differences (black vs. white) and corre-lation with measured intraocular pressure. J Glaucoma, 15(6):520-3.
8. Doughty MJ, Laiquzzaman M, Müller A, Oblak E, Button NF (2002). Central corneal thick-ness in European (white) individuals, especial-ly children and the elderespecial-ly, and assessment of its possible importance in clinical measures of intra-ocular pressure. Ophthalmic Physiol Opt, 22(6):491-504.
9. Hikoya A, Sato M, Tsuzuki K, Koide YM, Asao-ka R, Hotta Y (2009). Central corneal thick-ness in Japanese children. Jpn J Ophthalmol, 53(1):7-11.
10. Lim L, Gazzard G, Chan YH, Fong A, Kotecha A, Sim EL, Tan D, Tong L, Saw SM (2008). Cornea biomechanical characteristics and their correlates with refractive error in Singa-porean children. Invest Ophthalmol Vis Sci, 49(9):3852-7.
11. Tong L, Saw SM, Siak JK, Gazzard G, Tan D (2004). Corneal thickness determination and correlates in Singaporean schoolchildren. In-vest Ophthalmol Vis Sci, 45(11):4004-9.
12. Sahin A, Basmak H, Yildirim N (2008). The in-fluence of central corneal thickness and cor-neal curvature on intraocular pressure meas-ured by tono-pen and rebound tonometer in children. J Glaucoma, 17(1):57-61.
13. Krzyżanowska-Berkowska P, Asejczyk-Widlicka M, Pierscionek B (2012). Intraocular pressure in a cohort of healthy eastern European schoolchildren: variations in method and cor-neal thickness. BMC Ophthalmol, 12:61. 14. Song Y, Congdon N, Li L, Zhou Z, Choi K,
Lam DS, Pang CP, Xie Z, Liu X, Sharma A, Chen W, Zhang M (2008). Corneal hysteresis and axial length among Chinese secondary school children: the Xichang Pediatric Refrac-tive Error Study (X-PRES) report no. 4. Am J Ophthalmol, 145(5):819-26.
15. Sakalar YB, Keklikci U, Unlu K, Alakus MF, Yildirim M, Dag U (2012). Distribution of central corneal thickness and intraocular pres-sure in a large population of Turkish school children. Ophthalmic Epidemiol, 19(2):83-8. 16. Huang Y, Lin S, Ma D, Wang Z, Du Y, Lu X,
Zhang M (2013). Corneal biomechanical
properties and associated factors in school-age children. Eye Sci, 28(1):34-9.
17. Bueno-Gimeno I, Gene-Sampedro A, Piñero-Llorens DP, Lanzagorta-Aresti A, España-Gregori E (2014). Corneal biomechanics, re-tinal nerve fiber layer, and optic disc in child-ren. Optom Vis Sci, 91(12):1474-82.
18. Yildirim N, Sahin A, Basmak H, Bal C (2007). Effect of central corneal thickness and radius of the corneal curvature on intraocular pres-sure meapres-sured with the Tono-Pen and non-contact tonometer in healthy schoolchildren. J Pediatr Ophthalmol Strabismus, 44(4):216-22. 19. Pediatric Eye Disease Investigator Group (2011).
Central corneal thickness in children. Arch Ophthalmol, 129(9):1132-8.
20. Sihota R1, Tuli D, Dada T, Gupta V, Sachdeva MM (2006). Distribution and determinants of intraocular pressure in a normal pediatric population. J Pediatr Ophthalmol Strabismus, 43(1):14-8; quiz 36-7.
21. Wei W, Fan Z, Wang L, Li Z, Jiao W, Li Y (2014). Correlation analysis between central corneal thickness and intraocular pressure in juveniles in Northern China: the Jinan city eye study. PLoS One, 22;9(8):e104842.
22. Huang Y, Lin S, Ma D, Wang Z, Du Y, Lu X, Zhang M (2013). Corneal biomechanical properties and associated factors in school-age children. Eye Sci, 28(1):34-9.
23. Bovelle R, Kaufman SC, Thompson HW, Ha-mano H (1999). Corneal thickness measure-ments with the Topcon SP-2000P specular microscope and an ultrasound pachymeter.
Arch Ophthalmol, 117:868–870.
24. Suzuki S, Oshika T, Oki K, Sakabe I, Iwase A, Amano S, Araie M (2003). Corneal thickness measurements: scanning-slit corneal topogra-phy and noncontact specular microscopy ver-sus ultrasonic pachymetry. J Cataract Refract Surg, 29(7):1313-8.
25. Doughty MJ, Zaman ML (2000). Human corneal thickness and its impact on intraocular pres-sure meapres-sures: a review and meta-analysis ap-proach. Surv Ophthalmol, 44(5):367-408. 26. Heidary F, Gharebaghi R, Wan Hitam WH,
Sha-triah I (2010). Nerve fiber layer thickness.