R E V I E W
Enhancer variants: evaluating functions in
common disease
Olivia Corradin
1and Peter C Scacheri
1,2*Abstract
Gene enhancer elements are noncoding segments of DNA that play a central role in regulating transcriptional programs that control development, cell identity, and evolutionary processes. Recent studies have shown that noncoding single nucleotide polymorphisms (SNPs) that have been associated with risk for numerous common diseases through genome-wide association studies frequently lie in cell-type-specific enhancer elements. These enhancer variants probably influence transcriptional output, thereby offering a mechanistic basis to explain their association with risk for many common diseases. This review focuses on the identification and interpretation of disease-susceptibility variants that influence enhancer function. We discuss strategies for prioritizing the study of functional enhancer SNPs over those likely to be benign, review experimental and computational approaches to identifying the gene targets of enhancer variants, and highlight efforts to quantify the impact of enhancer variants on target transcript levels and cellular phenotypes. These studies are beginning to provide insights into the mechanistic basis of many common diseases, as well as into how we might translate this knowledge for improved disease diagnosis, prevention and treatments. Finally, we highlight five major challenges often associated with interpreting enhancer variants, and discuss recent technical advances that may help to surmount these challenges.
Introduction
Transcriptional enhancer elements are noncoding stretches of DNA that have a central role in controlling gene expres-sion programs in cells. Rather than on-off switches, en-hancers are hypothesized to function as transcriptional rheostats to fine-tune target transcript levels. Higher-order
* Correspondence:pxs183@case.edu
1Department of Genetics and Genome Sciences, Case Western Reserve
University, Cleveland, OH 44122, USA
2Case Comprehensive Cancer Center, Case Western Reserve University,
Cleveland, OH 44106, USA
three-dimensional organization of chromatin facilitates physical interactions between enhancers and their target promoters. Interactions between enhancers and their
tar-gets may occur on the same chromosome (in cis) or on
different chromosomes (in trans) (Figure 1) [1-3]. In any given mammalian cell type, the number of putative enhan-cer elements ranges from 50,000 to 100,000, and therefore far exceeds the number of protein-coding genes.
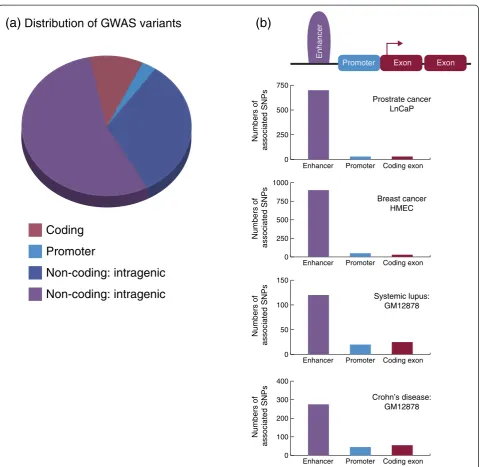
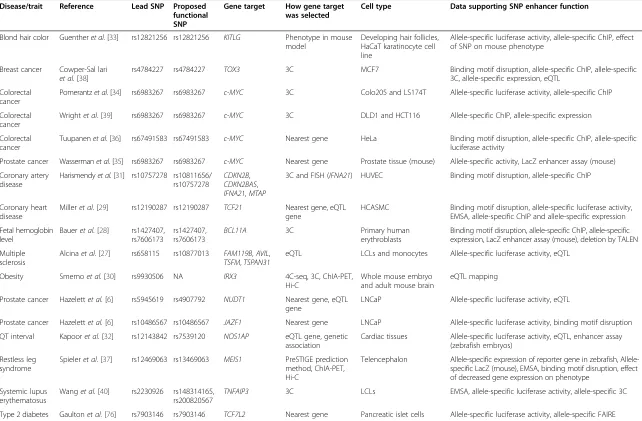
In the last decade, more than 1,900 genome-wide associ-ation studies (GWASs) have been published, identifying loci associated with susceptibility to over 1,000 unique traits and common diseases [4]. With the eventual goal of finding new therapies and preventative measures for com-mon diseases, efforts are now focused on determining the functional underpinnings of these associations. Several groups have associated GWAS risk variants, mostly SNPs, with newly annotated cell-type-specific gene enhancer ele-ments identified through epigenomic profiling studies. These enhancer variants probably play an important part in common disease susceptibility by influencing transcrip-tional output. Of all the genetic risk variants discovered to date, the number that impact enhancer function is esti-mated to far exceed the number that affect protein-coding genes or disrupt promoter function (Figure 2). Additionally, disease-associated variants in noncoding regions, particu-larly those that lie in cell-type-specific enhancer elements, have been estimated to explain a greater proportion of the heritability for some disorders than variants in coding regions [5]. This review focuses on the identification and interpretation of disease-associated variants that affect en-hancer function. We consider the latest approaches for evaluating enhancer variants and identifying their gene tar-gets, and highlight successful cases in which risk variants have been shown to alter gene expression by disrupting enhancer function. In addition, we discuss the remaining challenges to delineating the impact of noncoding variants, such as the identification of enhancer activity, validation of causal variants and identification of responsible genes. Future efforts to surmount these challenges should help to remove the barrier between the discovery of disease
associations and the translation of this knowledge for improved diagnosis and treatment of many common diseases.
Genetic risk variants are enriched in cell-type-specific enhancer elements defined by signature chromatin features
The locations of enhancer elements coincide with DNase I hypersensitive regions of open chromatin flanked by nu-cleosomes marked with the mono- and/or di-methylated forms of lysine 4 at histone H3 (H3K4me1/2) [9,10]. En-hancers can be active or repressed, and each state generally correlates with the presence of additional histone marks, such as H3K27ac and H4K16ac which are associated with active chromatin, or H3K27me3 and H3K9me3 which are associated with repressed chromatin [11-14]. Active en-hancers are bi-directionally transcribed and capped at their 5′end [15,16]. Most enhancer elements are located in in-trons and intergenic regions, although some are exonic [17-19]. Relative to promoters, the distribution of en-hancers across the epigenome is highly cell-type specific. Some of the first studies to associate GWAS variants with enhancer elements integrated genetic risk variants with regulatory element maps generated through epigenomic profiling (using chromatin immunoprecipitation com-bined with massively parallel DNA sequencing (ChIP-seq) and the profiling of DNase I hypersensitive sites (DHSs)) [20-22]. Two major themes emerged from these studies. First, loci with signature enhancer features (DHSs, H3K4me1, H3K27ac) are highly enriched for genetic risk variants relative to other chromatin-defined elements such as promoters and insulators [21]. Second, risk variants preferentially map to enhancers specific to disease-relevant cell types in both cancer and other common diseases [21]. For example, type 2 diabetes-associated variants preferen-tially map to pancreatic islet enhancers [22-25], and SNPs predisposing to colon cancer are enriched in enhancer ele-ments in colon cancer cells and colon crypts, from which colon cancer is derived [26]. Further assessment of the
effects of enhancer risk variants has shown that they can alter transcription-factor-binding sites (TFBSs) and impact the affinity of transcription factors for chromatin, and/or induce allele-specific effects on target gene expression [6,27-40]. These studies illustrate the utility of epigenomic profiling for identifying risk variants that lie in putative en-hancer elements and for identifying disease-relevant cell types in which the enhancer variants could exert their regulatory effects.
Super-enhancers, stretch enhancers, and enhancer clusters: hotspots for genetic risk variants
Four studies recently demonstrated correlations between genetic risk variants and large clusters of active enhancers, similar to locus control regions. These features have been called ‘super-enhancers’ [41,42],‘stretch enhancers’ [24], ‘multiple enhancers’ [7] and‘enhancer clusters’ [23], and are similar but not identical between studies, although many of these features overlap. The methods used to identify these clusters are distinct. Super-enhancers, for example, are defined by identifying the top-ranking en-hancers on the basis of the levels of associated transcrip-tion factors or chromatin marks identified through ChIP studies. Stretch enhancers are defined by stretches of open chromatin more densely and more broadly marked with enhancer-histone modifications than typical enhancers. Despite these differences, many of the defined features overlap. These enhancer clusters are highly cell-type spe-cific and have been proposed to play a predominant role in regulating the cell-type-specific processes that define the biology of a given cell type. Moreover, they are dispro-portionally enriched for genetic risk variants compared to typical enhancers, and the enrichment is biased toward disease-relevant cell types. These results further support the notion that variants that influence cell-type-specific gene regulation are major contributors to common disease risk, and extend this concept to demonstrate that altering the expression of genes under exquisite regulation can frequently lead to increased risk. Enhancer cluster
H3K27ac H3K4me1
H3K27ac
H3K4me1
DNase I hypersensitivity
Gene
Figure 1Model of enhancer function.Transcriptional enhancer elements are noncoding stretches of DNA that regulate gene expression levels, most often incis. Active enhancer elements are located in open chromatin sensitive to DNase I digestion and flanked by histones marked with H3K4me1 and H3K27ac. Enhancers are often bound by a number of transcription factors (TF), such as p300 (blue). Mediator and cohesin are part of a complex (orange, green and purple) that mediates physical contacts between enhancers and their target promoters.
Corradin and ScacheriGenome Medicine2014,6:85 Page 2 of 14
identification provides a means of detecting highly regu-lated genes and may help to prioritize noncoding variants that are likely to be functional.
A typical locus identified through a GWAS contains dozens to thousands of SNPs in linkage disequilibrium (LD) with the‘lead’SNP that is reported to be associated with the disease in question. Any SNP in LD with the lead SNP may be causal, and the prevailing assumption is that only one is causal. Indeed, this scenario has been reported
to be the case for some risk loci involving enhancers [34,43], and there are several examples of Mendelian dis-orders in which a single enhancer variant causes congeni-tal disease [44-50]. However, it is equally plausible that more than one SNP is causal, particularly at GWAS loci harboring enhancer clusters. In these instances, several variants distributed among multiple enhancers throughout the locus, rather than a single SNP, may combine to affect expression of their gene targets and confer susceptibility
(a)
(b)
to common traits. This has been called the‘multiple
en-hancer variant’ (MEV) hypothesis. Corradin and
col-leagues provided support for the MEV hypothesis for six common autoimmune disorders, including rheuma-toid arthritis, Crohn’s disease, celiac disease, multiple sclerosis, systemic lupus erythematosus and ulcerative colitis. The extent of MEVs across additional common diseases is not yet known [7,28,37].
Interpreting enhancer variants
Given that risk variants lie in cell-type-specific enhancer elements, it is critical to utilize a disease-relevant cell type to identify potential enhancer variants. SNPs associated with a particular disease can be compared to enhancer ele-ments to identify cell types whose active enhancers are disproportionately enriched for disease variants. Variant set enrichment is a permutation-based method that com-pares the enrichment of genetic risk-variant sets within any functional element (such as H3K4me1-marked puta-tive enhancers) to randomly generated matched genetic risk-variant sets [26,38]. This type of analysis provides an unbiased way of evaluating the utility of a cell type for studying the impact of variants on enhancer elements.
Several computational programs are currently available to integrate chromatin landscapes with GWAS risk vari-ants to identify candidate regulatory SNPs and evaluate their disease-causing potential. These include IGR [38], RegulomeDB [51], HaploReg [52], FunciSNP [53] and FunSeq [54]. These programs are particularly useful for prioritizing SNPs for functional analyses, which may in-clude transcription factor ChIP or electrophoretic mobil-ity shift assays to test whether a given SNP influences a transcription factor’s ability to bind to the enhancer, and in vitroandin vivogene reporter assays to test the SNP’s effect on enhancer activity. Additionally, allele-specific expression can be utilized to quantify the impact of en-hancer variants within a specific cell type. Finally, DNA editing strategies involving CRISPR/Cas9-based methods can be employed to evaluate the effect of a variant. Fol-lowing the identification of a functional enhancer vari-ant, the next major challenge is to identify its target and to test the effect of the SNP(s) on target transcript levels. Many enhancer elements are located within 100 kilobases (kb) of the genes that they regulate, but can also be located more than a megabase away, or even on separate chromo-somes. Enhancers can regulate genes or long noncoding RNAs. Most genes are regulated by more than one enhan-cer, and many enhancers regulate more than one target gene [55,56]. The problem is further complicated by our limited knowledge of barrier elements, which block enhancer-gene interactions. The most common method of assigning an enhancer to its nearest gene is inaccurate, with false discovery rate (FDR) estimates ranging from 40% to 73% [55,57]. Refining methods for identifying the
nearest gene to looking for the ‘nearest expressed gene’ still results in a high FDR, with 53% to 77% [55,58] of dis-tal elements bypassing the nearest active transcription start site to interact with a distant gene. Clearly, proximity alone cannot be used to accurately identify the target of an enhancer SNP.
Methods of identifying gene targets of enhancer variants
To identity enhancer targets, DNA fluorescence in situ hybridization (FISH) [59,60], as well as chromatin associ-ation methods (chromosome conformassoci-ation capture (3C)) [61], can be employed. These are powerful approaches for evaluating whether a region of interest interacts with a specific genomic target, but they suffer from the limitation that the regions of interest must be pre-specified, that is, they are ‘one-by-one’ approaches. 4C (circular chromo-some conformation capture), an extension of 3C, can cap-ture all regions that physically contact a site of interest, without prior knowledge of the regions that contact that site being necessary [62] (that is, a‘one-to-all’approach). Higher-throughput methods include carbon-copy chro-mosome conformation capture (5C, many-to-many), a high-throughput expansion of 3C, Hi-C (all-to-all) and chromatin interaction analysis by paired-end tag se-quencing (ChIA-PET) (for detailed comparison of these methods, see reviews [63,64]). These global approaches can enable the identification of loci that directly and indir-ectly contact enhancers of interest, and can reveal com-plex interactions in which dozens to hundreds of loci aggregate, so-called transcriptional hubs or enhanceo-somes [65]. These types of high-order interactions have been recently described by several studies [55,56,58]. The extent by which they overlap risk loci remains unexplored. Unfortunately, these approaches tend to be expensive and difficult for most labs to execute, and their resolution often prohibits their use for interrogating GWAS loci. Until recently, for example, the resolution of Hi-C was limited to capturing interactions separated by more than one megabase; 5 to 10 times greater than the distance by which most enhancer-gene interactions occur. Despite the limitations,‘C’-based methods have been implemented to successfully identify targets of enhancer-risk variants and to quantify their functional effects. For example, Cowper-Sal lari and colleagues utilized 3C and allele-specific ex-pression to demonstrate the impact of the breast cancer
risk SNP rs4784227 on expression of TOX3, thought to
have a role in chromatin regulation [38]. Bauer and co-workers utilized 3C to identifyBCL11Aas the gene target of an erythroid enhancer, and then further demonstrated the impact of enhancer variants on transcription factor binding and expression. Gene editing strategies have also been employed to demonstrate that this enhancer is essen-tial for erythroid gene expression [28]. Finally, we highlight
Corradin and ScacheriGenome Medicine2014,6:85 Page 4 of 14
a study by Smemo and colleagues in which 4C-seq was used to identifyIRX3as the target of an enhancer SNP located in intron 1 of theFTOgene, which was originally thought to be the target and therefore the causal gene for increased risk of obesity. Functional studies in mice were used to verify thatIRX3is the most likely causal gene, notFTO[30].
Computational approaches to identify gene targets of enhancer elements
As alternatives to experimental approaches, several groups have developed computational techniques for determining the targets of enhancers [7,16,21,66-70]. These methods are similar in that they compare patterns of regulatory ac-tivity across multiple cell types to predict interactions between enhancers and genes. However, they vary signifi-cantly in the type of data required to generate enhancer-gene predictions, the specific approaches used to enhancer-generate and validate the predictions, and their availability (Table 1). The method described by Ernst and colleagues identifies H3K4me1/2 and H3K27ac sites that co-vary with expressed genes within 125 kb of the gene locus, and uses this to pre-dict enhancer-gene interactions [21]. Thurman and co-workers utilized DHS exclusively to predict interactions. Enhancers were assigned to genes by correlating the cross-cell-type DNase I signal at each DHS site with all pro-moters located within 500 kb [66]. The method developed by Sheffield and colleagues also uses DHS profiles, but add-itionally incorporates genome-wide expression data [70]. Rather than employing a fixed distance-based model, Shen and colleagues apply chromatin conformation data from Hi-C experiments to guide the association of enhancers to genes marked by H3K4me1, H3K27ac and RNA Pol II [67]. As an alternative to methods based on chromatin structure, Andersson and colleagues leverage cap analysis of gene expression (CAGE) data to correlate transcription at enhancers with gene expression [16]. There are two computational approaches that are publicly available and executable through website or command-line programs: predicting specific tissue interactions of genes and en-hancers (PreSTIGE) [7] and integrated methods for predict-ing enhancer targets (IM-PET) [69]. PreSTIGE identifies enhancers and genes that demonstrate quantitative cell-type specificity based on H3K4me1 and RNA sequencing (RNA-seq), and can process data from human and mouse cell types [68]. IM-PET, like previously discussed methods, considers the proximity of an enhancer to potential gene targets and the correlation of enhancer and promoter activ-ity, along with measures of transcription factor activity and evolutionary conservation.
When the appropriate datasets are available, compu-tational approaches can offer a relatively fast and cost-effective way of identifying putative enhancer-gene interactions in a given cell type. However, they are gener-ally limited to detecting a subset of enhancer-promoter
interactions within a given cell type, and none are capable of identifyingtransinteractions. Methods that rely on cell-type specificity or concordant changes in enhancers and genes across cell types may lack the sensitivity to predict interactions for ubiquitously expressed genes or to delin-eate interactions in domains with a high density of cell-type-specific genes. There is no standard or ‘reference’ dataset to validate the accuracy of gene-enhancer predic-tions. Thus, each study utilizes a different approach to evaluate accuracy, which makes it difficult to determine which method is most accurate. This necessitates experi-mental validation of enhancer-gene interactions deter-mined using prediction-based methods. Despite these limitations, computational approaches can help to identify the targets of enhancer-risk variants. The method devel-oped by Thurman and colleagues was applied to all GWAS loci and predicted gene targets of 419 disease-associated risk variants [20], most of which were located more than 100 kb from the risk SNP. PreSTIGE was utilized to predict gene targets of 122 noncoding loci as-sociated with six immune disorders: rheumatoid arthritis, Crohn’s disease, celiac disease, multiple sclerosis, lupus and ulcerative colitis. Furthermore, at several of the autoimmune-disease-associated loci, the effect of the risk allele on target gene expression was quantified.
Utilizing expression quantitative trait loci studies to evaluate the impact of enhancer variants
Expression quantitative trait loci (eQTL) studies enable the identification of genetic variants that influence gene expression. eQTL studies involve stratifying a panel of in-dividuals based on their particular SNP genotypes and then determining whether transcript levels differ between individuals based on the specific SNP genotypes. Genome-wide eQTL studies have identified transcripts that differ in expression on the basis of the genotype of the risk allele at GWAS loci. Alternatively, eQTL-based analyses can be applied to candidate interactions between SNPs and gene targets identified through the experimental or computa-tional approaches described above. In both instances, gen-etic variation inherent in the human population is utilized to reveal the quantitative and directional effect of SNPs on gene expression (that is, the degree to which expression is upregulated or downregulated).
Table 1 Computational approaches to predicting gene targets of enhancer elements
Reference or method Input data required Gene expression
Linear model Number of genes with predictions (per cell line)
FDR Species Publically available
Nearest gene None Not considered Nearest gene NA ~40% to 73% Any NA
Nearest expressed gene Gene expression Considered Nearest expressed gene NA ~53% to 77% Any NA
Ernstet al.[21] H3K4me1, H3K4me2, H3K27ac, RNA-seq
Considered Distance based (125 kb) NA Not determined Human No
Thurmanet al.[66] DNase I hypersensitivity Not considered Distance based (500 kb) NA Not determined Human No Sheffieldet al.[70] DNase I hypersensitivity
and RNA-seq
Considered 100 kb NA Not determined Human Predicted interactions: [http://dnase.genome.duke.edu/]
Shenet al.[67] H3K4me1, H3K27ac, RNA
Pol II
Not considered Topological domain based
5,000 to 8,000 Not determined Mouse No
Anderssonet al.[16] CAGE Considered 500 kb NA Not determined Human No
PreSTIGE [7] H3K4me1 Considered Distance (100 kb) and CTCF based
3,000 to 5,000 ~13% to 23% Human Predicted interactions:http://genetics.case.edu/prestige Method application:http://prestige.case.edu
PreSTIGEouse [68] H3K4me1 Considered Distance based (100 kb) 3,000 to 5,000 Not determined Mouse Predicted interactions:http://genetics.case.edu/prestige Method application:http://prestige.case.edu
IM-PET [69] H3K4me1, H3K27ac, H3K4me3 and RNA-seq*
Considered Distance (2 Mb) 7,000 to 10,000 ~1% Human Method application:http://www.healthcare.uiowa.edu/ labs/tan/IM-PET.html
*Input data utilized in publication, other input options exist. CAGE, cap analysis of gene expression; CTCF, CCCTC-binding factor (zinc finger protein demonstrated to function as an insulator protein); FDR, false discovery rate; Mb, megabases; NA, not applicable; RNA-seq, RNA sequencing.
Corradin
and
Scacheri
Genome
Medicine
2014,
6
:85
Page
6
o
f
1
4
http://geno
memedicin
e.com/conten
between SNPs and genes. Fourth, the effects on gene ex-pression must be robust in order to be identified over the confounding effects of the genetic background. This poses a challenge for detecting functional variants that have modest effects, as has been proposed for most enhancer variants [7,33,73,74]. Fifth, eQTL analyses rarely consider the combinatorial effects of multiple SNPs at a given locus. Last, because eQTL studies are typically performed on healthy individuals, the impact of the SNP on the quantitative trait may differ in response to disease-specific stimuli. This was observed in a survey of enhancer SNPs associated with prostate cancer. Here, the effect of a SNP on enhancer function was only observed in the presence of the androgen dihydrotestosterone [6]. Additionally, a study by Harismendy and co-workers demonstrated that the chromatin interaction between an enhancer locus as-sociated with coronary artery disease and the gene target IFNA21 was significantly remodeled by treatment with interferon-γ[31].
Transcriptional effects of enhancer variants
Studies that delineate the impact of disease-associated en-hancer variants (Table 2) reveal the relatively modest effect of enhancer variants on gene expression. The effect of en-hancer variants has also been evaluated with massively parallel reporter assays in which the impact of mutations in enhancer sequences is determined through heterologous barcoding and high-throughput sequencing (reviewed in [75]). These high-throughput assays show that most vari-ants that impact transcription induce 1.3- to 2-fold dif-ferences in target gene expression [73,74]. These findings align with the notion that enhancers modulate or fine-tune gene expression, analogous to a rheostat. Despite their modest transcriptional effects, enhancer variants can have large effects on downstream phenotypes. As an example, we highlight a SNP (rs12821256) associated with blond hair color in Europeans. This SNP lies in an enhancer that drives KITLGexpression in developing hair follicles [33]. The blond-hair-associated SNP was shown to reduce en-hancer activity by only 22%in vitro. Nonetheless, when the blond hair and ancestral alleles were evaluated in trans-genic mice, the reduction in enhancer activity associated with the blond hair allele was sufficient to yield mice of visibly lighter coat color than mice generated with the an-cestral allele [33]. Whether or not the blond-hair-associated SNP represents a special instance of a more general mech-anism in which enhancer variants with modest functional effects have robust phenotypic effects remains to be seen.
Implications for disease and medicine
The strategies discussed above (summarized in Figure 3) have been utilized to interpret the transcriptional effects of enhancer variants associated with several traits and common diseases. The continued application of these and
other emerging strategies will have important implications for disease and medicine. These studies should not only help to reveal the gene targets of noncoding risk variants, but also provide information on whether these risk vari-ants increase or decrease expression of the target gene. This information will be essential for identifying appropri-ate therapeutic targets and determining whether inhibitors or activators of these targets would be most effective. Knowledge of gene targets may also reveal pathways that are commonly altered among affected individuals, which could also guide treatment strategies and rational drug design.
Conclusions and future challenges
We have reviewed approaches for the identification and interpretation of common-disease-associated variants that impact enhancer function, citing examples in which these methods have been successfully implemented (Figure 3, Table 2). We highlight three main conclusions. First, cell-type-specific enhancer variants are highly prevalent among loci associated with the majority of common diseases iden-tified through GWASs. Second, GWAS-ideniden-tified enhan-cer variants are disproportionally enriched in enhanenhan-cer clusters, which control genes with highly specialized cell-type-specific functions. Third, these enhancer variants can have modest but significant effects on target gene expres-sion, which can have robust effects on phenotype. Thus, interpreting the functional effects of enhancer variants requires rational experiment design that takes these char-acteristics into account. Furthermore, although current methods have enabled the thorough characterization of enhancer variants at some GWAS loci, high-throughput methods are needed, given the huge number of disease-associated enhancer variants. Here, we discuss additional lessons learned from these studies, and note five remaining challenges (Figure 4).
Table 2 Functional enhancer studies of GWAS risk loci
Disease/trait Reference Lead SNP Proposed functional SNP
Gene target How gene target was selected
Cell type Data supporting SNP enhancer function
Blond hair color Guentheret al.[33] rs12821256 rs12821256 KITLG Phenotype in mouse model
Developing hair follicles, HaCaT karatinocyte cell line
Allele-specific luciferase activity, allele-specific ChIP, effect of SNP on mouse phenotype
Breast cancer Cowper-Sal lari et al.[38]
rs4784227 rs4784227 TOX3 3C MCF7 Binding motif disruption, allele-specific ChIP, allele-specific 3C, allele-specific expression, eQTL
Colorectal cancer
Pomerantzet al.[34] rs6983267 rs6983267 c-MYC 3C Colo205 and LS174T Allele-specific luciferase activity, allele-specific ChIP
Colorectal cancer
Wrightet al.[39] rs6983267 rs6983267 c-MYC 3C DLD1 and HCT116 Allele-specific ChIP, allele-specific expression
Colorectal cancer
Tuupanenet al.[36] rs67491583 rs67491583 c-MYC Nearest gene HeLa Binding motif disruption, allele-specific ChIP, allele-specific luciferase activity
Prostate cancer Wassermanet al.[35] rs6983267 rs6983267 c-MYC Nearest gene Prostate tissue (mouse) Allele-specific activity, LacZ enhancer assay (mouse) Coronary artery
disease
Harismendyet al.[31] rs10757278 rs10811656/
rs10757278 CDKN2B ,
CDKN2BAS,
IFNA21,MTAP
3C and FISH (IFNA21) HUVEC Binding motif disruption, allele-specific ChIP
Coronary heart disease
Milleret al.[29] rs12190287 rs12190287 TCF21 Nearest gene, eQTL gene
HCASMC Binding motif disruption, allele-specific luciferase activity, EMSA, allele-specific ChIP and allele-specific expression
Fetal hemoglobin level
Baueret al.[28] rs1427407, rs7606173
rs1427407, rs7606173
BCL11A 3C Primary human
erythroblasts
Binding motif disruption, allele-specific ChIP, allele-specific expression, LacZ enhancer assay (mouse), deletion by TALEN
Multiple sclerosis
Alcinaet al.[27] rs658115 rs10877013 FAM119B,AVIL,
TSFM,TSPAN31
eQTL LCLs and monocytes Allele-specific luciferase activity, eQTL
Obesity Smemoet al.[30] rs9930506 NA IRX3 4C-seq, 3C, ChIA-PET, Hi-C
Whole mouse embryo and adult mouse brain
eQTL mapping
Prostate cancer Hazelettet al.[6] rs5945619 rs4907792 NUDT1 Nearest gene, eQTL gene
LNCaP Allele-specific luciferase activity, eQTL
Prostate cancer Hazelettet al.[6] rs10486567 rs10486567 JAZF1 Nearest gene LNCaP Allele-specific luciferase activity, binding motif disruption QT interval Kapooret al.[32] rs12143842 rs7539120 NOS1AP eQTL gene, genetic
association
Cardiac tissues Allele-specific luciferase activity, eQTL, enhancer assay (zebrafish embryos)
Restless leg syndrome
Spieleret al.[37] rs12469063 rs13469063 MEIS1 PreSTIGE prediction method, ChIA-PET, Hi-C
Telencephalon specific expression of reporter gene in zebrafish, Allele-specific LacZ (mouse), EMSA, binding motif disruption, effect of decreased gene expression on phenotype
Systemic lupus erythematosus
Wanget al.[40] rs2230926 rs148314165,
rs200820567 TNFAIP3
3C LCLs EMSA, allele-specific luciferase activity, allele-specific 3C
Type 2 diabetes Gaultonet al.[76] rs7903146 rs7903146 TCF7L2 Nearest gene Pancreatic islet cells Allele-specific luciferase activity, allele-specific FAIRE
3C, chromosome conformation capture; 4C-seq, circular chromosome conformation capture followed by sequencing; ChIA-PET, chromatin interaction analysis by paired-end tag sequencing; ChIP, chromatin immunoprecipitation; EMSA, electrophoretic mobility shift assay; eQTL, expression quantitative trait loci; FAIRE, formaldehyde-assisted isolation of regulatory elements; FISH, fluorescencein situhybridization; LCLs, lymphoblastoid cell lines; NA, not applicable; SNP, single nucleotide polymorphism.
Corradin
and
Scacheri
Genome
Medicine
2014,
6
:85
Page
8
o
f
1
4
http://geno
memedicin
e.com/conten
that the impact of the variant is dependent on disease-specific environmental factors [80]. The effect of non-coding variants on expression was also observed to be strongly context dependent in a study of monocytes under diverse types and durations of stimuli. Fairfax and col-leagues demonstrated that 43% of identified eQTLs were
associated with an effect on expression only after treat-ment with immune response stimuli lipopolysaccharide or interferon-γ[81].
Second, there remains a gap between the prediction and functional validation of putative enhancer elements. Thus, if a risk SNP is localized to a putative enhancer Reporter assay
Experimental approaches Computational predictions
CRISPR/Cas9 Reporter Allele-specific binding
eQTL
Chromatin looping
Minimal promoter
Luciferase Region of
interest
Massively parallel reporter assay
Locus that
contains SNP
functions as
an enhancer
Association
of enhancers
with gene
targets
Investigating
the impact of
enhancer
SNPs
Fluorescence in situ hybridization
Chromosome conformation
capture
DNA template
X
T
G
G
T
T T
G
+ + + +
+ + +
+ +
+ –
G
T Enhancer-to-gene target
G
X
TX
Figure 3Interpreting enhancer variants.Various strategies for interpreting enhancer variants. (Top) Single- or high-throughput reporter assays can be used to test whether a putative enhancer is functional. (Middle) Gene targets of enhancers can be identified through experimental approaches such as fluorescencein situhybridization and chromosome conformation capture assays, or through computational methods. (Bottom) The impact of a single nucleotide polymorphism (SNP) on enhancer function can be evaluated through CRISPR/Cas9-based DNA editing approaches, followed by measures of enhancer activity or target gene expression. The effect of a risk SNP on transcriptional activity and chromatin architecture can be evaluated through reporter assays and chromosome-conformation-capture-based experiments. Effects of the risk SNP on allele-specific expression and
element defined through chromatin profiling, it is essen-tial that the putative enhancer is functionally validated. In vitro and in vivo reporter assays can help in this re-gard. However, these assays are relatively low throughput and usually involve the use of a general promoter such
as SV40 rather than the enhancer’s endogenous
pro-moter, which complicates the interpretation of negative results. Additionally, most genes are regulated by more than one enhancer, yet typically only one enhancer is tested in a reporter assay.
Third, at a given GWAS locus, the SNP with the most significant association (that is, the lowest P value) with the disease is usually reported as the ‘lead’ SNP. Except in rare instances, such as the SNP rs6983267, which in-fluences the MYC enhancer and confers risk for multiple
cancers [34,35], the SNP with the lowest P value is not necessarily causal. Any SNP in LD with the lead SNP may be causal, and there may be dozens to thousands of candidates. Fine mapping studies can help narrow the locus and reduce the number of candidates. Additionally, as discussed above, identifying SNPs that co-localize with enhancer-chromatin features or TFBSs in an appro-priate human cell type can help prioritize candidate functional variants [30,38]. Indeed, Claussnitzer and colleagues developed a method, phylogenetic module complexity analysis (PMCA), which utilizes conserved co-occurring TFBS patterns to identify functional regu-latory variants [82]. However, hundreds of candidate SNPs may remain even after prioritization, especially when the locus harbors an enhancer cluster. This was
20
201
201
700
0 3 1
5
1
2
3
4
H3K4me1: H1ES
H3K4me1: NHLF
H3K4me1: GM12878
DNase HS: GM12878
H3K27ac: GM12878
GWAS SNP SNPs in LD Other SNPs
137,600,000 | 137,550,000 |
137,500,000 |
50 kb hg18
Scale chr6:
Figure 4Future challenges for the functional evaluation of enhancer variants.The challenges described in the conclusion section are depicted in this hypothetical enhancer locus. Chromatin immunoprecipitation combined with massively parallel DNA sequencing (ChIP-seq) tracks from ENCODE [77] and linkage disequilibrium (LD) plots from HapMap [78,79] are displayed via the UCSC genome browser. Number 1 highlights the challenge of utilizing the proper cell type to assess enhancer activity. Enhancers at this locus are only active in one of the three cell lines depicted. Challenge number 2 is the discrepancy between predicted and validated enhancer function. Shown is a putative enhancer defined by chromatin state that requires experimental validation of its enhancer activity. Challenge number 3 illustrates the large number of single nucleotide polymorphisms (SNPs) in LD that lie in putative enhancer elements, any of which could be functional. Number 4 is the challenge of determining the gene impacted by the enhancer variant. Here, the target of the enhancers at this locus could beIL22RA2,IFNGR1, or a gene distal to this locus. Number 5 is the complexity of enhancer gene regulation. Here, multiple enhancers each with several associated variants are distributed across the locus. One or a combination of several of the enhancer variants could influence target gene expression. chr, chromosome; GWAS, genome-wide association study; kb, kilobases.
Corradin and ScacheriGenome Medicine2014,6:85 Page 10 of 14
illustrated in a recent survey of breast cancer risk loci, which showed that 921 SNPs co-localize with putative en-hancers in human mammary epithelial cells across 71 risk loci [8]. Similarly, 663 enhancer SNPs were identified for 77 prostate risk loci [6]. Furthermore, while some enhancer variants influence transcription factor binding [6,28,29,34], SNPs do not necessarily have to reside within a TFBS to influence transcription factor binding or enhancer activity [33,73,74,83]. It is clear that massively parallel reporter assays (discussed above) will be necessary to help distinguish functional variants from those that are passengers.
Fourth, in order to determine the phenotypic effect of an enhancer variant, it is essential that an enhancer vari-ant is demonstrated to influence the levels of its target transcript. The target may be a gene, or could alterna-tively be a noncoding RNA. However, enhancers fre-quently regulate multiple genes. Even if the levels of a given transcript correlate with the genotype of an enhan-cer risk variant, it does not necessarily mean that the correlated gene is causal. Functional assays, and ultim-atelyin vivomodels, are needed to verify that the gene is directly involved in the development of the disease. CRISPR/Cas9 technology would enable such studies by altering single SNPs in the genome of a model organism while maintaining the native genomic context of the variant. Alternatively, single-site integration of the risk or non-risk alleles into a model organism, as utilized for the enhancer variant associated with blond hair color [33], could be employed. Although CRISPR/Cas9 can be utilized to demonstrate the functional impact of a given variant, the complex phenotypes of many diseases are not easily modeled in vitro and thus the determination of causality will often not be trivial.
Lastly, genes are frequently regulated by multiple enhan-cer elements or clusters of enhanenhan-cer elements. Thus, the independent effect of a single enhancer or variant may be below the sensitivity threshold of standard assays. This, in addition to the demonstration that multiple enhancer SNPs can act in combination to impact gene expression, suggests that epistatic effects between noncoding variants may play a particularly important role for enhancer loci, especially when enhancer variants of the same gene are inherited independently. The impact of the interaction be-tween SNPs on transcription and ultimately on clinical risk for disease remains to be seen.
We have discussed the strategies for, and challenges as-sociated with, the interpretation of noncoding putative en-hancer SNPs as applied to the study of common variants identified by GWAS studies of common diseases and traits. As whole-genome sequencing becomes more preva-lent, these same strategies will be necessary to elucidate the impact of rare noncoding mutations and to distinguish damaging from innocuous enhancer alterations.
Abbreviations
3C:Chromosome conformation capture; 4C: Circular chromosome conformation capture; 5C: Carbon-copy chromosome conformation capture; CAGE: Cap analysis of gene expression; ChIA-PET: Chromatin interaction analysis by paired-end tag sequencing; ChIP-seq: Chromatin immunoprecipitation with massively parallel DNA sequencing; DHS: DNase I hypersensitivity site; eQTL: Expression quantitative trait loci; FDR: False discovery rate; FISH: Fluorescencein situhybridization; GWAS: Genome-wide association study; H3K27ac: Acetylation of lysine 27 on histone 3 [as an example]; H3K4me: Methylation of lysine 4 on histone 3 [as an example]; IM-PET: Integrated methods for predicting enhancer targets; kb: Kilobases; LD: Linkage disequilibrium; MEV: Multiple enhancer variant; PMCA: Phylogenetic module complexity analysis; PreSTIGE: Predicting specific tissue interactions of genes and enhancers; RNA-seq: RNA sequencing; SNP: Single nucleotide polymorphism; TFBS: Transcription-factor-binding site; VSE: Variant set enrichment.
Competing interests
The authors declare that they have no competing interests.
Acknowledgements
This work was supported by NIH grants R01CA160356, R01DC009410, R01DE018470 (PCS) and CWRU Cellular and Molecular Biology training grant T32GM008056 (OC).
References
1. Sasaki-Iwaoka H, Maruyama K, Endoh H, Komori T, Kato S, Kawashima H:A trans-acting enhancer modulates estrogen-mediated transcription of reporter genes in osteoblasts.J Bone Miner Res1999,14:248–255. 2. Muller HP, Schaffner W:Transcriptional enhancer can actin trans.Trends
Genet1990,6:300–304.
3. Muller HP, Sogo JM, Schaffner W:An enhancer stimulates transcriptionin transwhen attached to the promoter via a protein bridge.Cell1989,
58:767–777.
4. A Catalog of Published Genome-Wide Association Studies.[http://www. genome.gov/gwasstudies]
5. Gusev A, Hong Lee S, Neale BM, Trynka G, Vilhjalmsson BJ, Finucane H, Xu H, Zang C, Ripka S, Stahl E, Schizophrenia Working Group of the PGC, SWE-SCZ Consortium, Kahler AK, Hultman CM, Purcell SM, McCarroll SA, Daly M, Pasaniuc B, Sullivan PF, Wray NR, Raychaudhuri S, Price AL:Regulatory variants explain much more heritability than coding variants across 11 common diseases. bioRxiv2014, doi:10.1101/004309.
6. Hazelett DJ, Rhie SK, Gaddis M, Yan C, Lakeland DL, Coetzee SG, Henderson BE, Noushmehr H, Cozen W, Kote-Jarai Z, Eeles RA, Easton DF, Haiman CA, Lu W, Farnham PJ, Coetzee GA, Ellipse/GAME-ON consortium, Practical consortium:
Comprehensive functional annotation of 77 prostate cancer risk loci. PLoS Genet2014,10:e1004102.
7. Corradin O, Saiakhova A, Akhtar-Zaidi B, Myeroff L, Willis J, Cowper-Sal lari R, Lupien M, Markowitz S, Scacheri PC:Combinatorial effects of multiple enhancer variants in linkage disequilibrium dictate levels of gene expression to confer susceptibility to common traits.Genome Res2014,24:1–13.
8. Rhie SK, Coetzee SG, Noushmehr H, Yan C, Kim JM, Haiman CA, Coetzee GA:
Comprehensive functional annotation of seventy-one breast cancer risk loci.PLoS One2013,8:e63925.
9. Heintzman ND, Stuart RK, Hon G, Fu Y, Ching CW, Hawkins RD, Barrera LO, Van Calcar S, Qu C, Ching KA, Wang W, Weng Z, Green RD, Crawford GE, Ren B:Distinct and predictive chromatin signatures of transcriptional promoters and enhancers in the human genome.Nat Genet2007,
39:311–318.
10. Heintzman ND, Hon GC, Hawkins RD, Kheradpour P, Stark A, Harp LF, Ye Z, Lee LK, Stuart RK, Ching CW, Ching KA, Antosiewicz-Bourget JE, Liu H, Zhang X, Green RD, Lobanenkov VV, Stewart R, Thomson JA, Crawford GE, Kellis M, Ren B:Histone modifications at human enhancers reflect global cell-type-specific gene expression.Nature2009,459:108–112.
12. Rada-Iglesias A, Bajpai R, Swigut T, Brugmann SA, Flynn RA, Wysocka J:A unique chromatin signature uncovers early developmental enhancers in humans.Nature2011,470:279–283.
13. Zentner GE, Tesar PJ, Scacheri PC:Epigenetic signatures distinguish multiple classes of enhancers with distinct cellular functions.Genome Res
2011,21:1273–1283.
14. Taylor GC, Eskeland R, Hekimoglu-Balkan B, Pradeepa MM, Bickmore WA:
H4K16 acetylation marks active genes and enhancers of embryonic stem cells, but does not alter chromatin compaction.Genome Res2013,
23:2053–2065.
15. Kim TK, Hemberg M, Gray JM, Costa AM, Bear DM, Wu J, Harmin DA, Laptewicz M, Barbara-Haley K, Kuersten S, Markenscoff-Papadimitriou E, Kuhl D, Bito H, Worley PF, Kreiman G, Greenberg ME:Widespread transcription at neuronal activity-regulated enhancers.Nature2010,465:182–187. 16. Andersson R, Gebhard C, Miguel-Escalada I, Hoof I, Bornholdt J, Boyd M,
Chen Y, Zhao X, Schmidl C, Suzuki T, Ntini E, Arner E, Valen E, Li K, Schwarzfischer L, Glatz D, Raithel J, Lilje B, Rapin N, Bagger FO, Jørgensen M, Andersen PR, Bertin N, Rackham O, Burroughs AM, Baillie JK, Ishizu Y, Shimizu Y, Furuhata E, Maeda S,et al:An atlas of active enhancers across human cell types and tissues.Nature2014,507:455–461.
17. Birnbaum RY, Clowney EJ, Agamy O, Kim MJ, Zhao J, Yamanaka T, Pappalardo Z, Clarke SL, Wenger AM, Nguyen L, Gurrieri F, Everman DB, Schwartz CE, Birk OS, Bejerano G, Lomvardas S, Ahituv N:Coding exons function as tissue-specific enhancers of nearby genes.Genome Res2012,
22:1059–1068.
18. Stergachis AB, Haugen E, Shafer A, Wenqing F, Vernot B, Reynolds A, Raubitschek A, Ziegler S, LeProust EM, Akey JM, Stamatoyannopoulos JA:
Exonic transcription factor binding directs codon choice and affects protein evolution.Science2013,342:1367–1372.
19. Tumpel S, Cambronero F, Sims C, Krumlauf R, Wiedemann LM:A regulatory module embedded in the coding region of Hoxa2 controls expression in rhombomere 2.Proc Natl Acad Sci U S A2008,105:20077–20082. 20. Maurano MT, Humbert R, Rynes E, Thurman RE, Haugen E, Wang H,
Reynolds AP, Sandstrom R, Qu H, Brody J, Shafer A, Neri F, Lee K, Kutyavin T, Stehling-Sun S, Johnson AK, Canfield TK, Giste E, Diegel M, Bates D, Hansen RS, Neph S, Sabo PJ, Heimfeld S, Raubitschek A, Ziegler S, Cotsapas C, Sotoodehnia N, Glass I, Sunyaev SRet al.:Systematic localization of common disease-associated variation in regulatory DNA. Science2012,337:1190–1195.
21. Ernst J, Kheradpour P, Mikkelsen TS, Shoresh N, Ward LD, Epstein CB, Zhang X, Wang L, Issner R, Coyne M, Ku M, Durham T, Kellis M, Bernstein BE:
Mapping and analysis of chromatin state dynamics in nine human cell types.Nature2011,473:43–49.
22. Trynka G, Sandor C, Han B, Xu H, Stranger BE, Liu XS, Raychaudhuri S:
Chromatin marks identify critical cell types for fine mapping complex trait variants.Nat Genet2013,45:124–130.
23. Pasquali L, Gaulton KJ, Rodriguez-Segui SA, Mularoni L, Miguel-Escalada I, Akerman I, Tena JJ, Morán I, Gómez-Marín C, van de Bunt M, Ponsa-Cobas J, Castro N, Nammo T, Cebola I, García-Hurtado J, Maestro MA, Pattou F, Piemonti L, Berney T, Gloyn AL, Ravassard P, Gómez-Skarmeta JL, Müller F, McCarthy MI, Ferrer J:Pancreatic islet enhancer clusters enriched in type 2 diabetes risk-associated variants.Nat Genet2014,46:136–143. 24. Parker SC, Stitzel ML, Taylor DL, Orozco JM, Erdos MR, Akiyama JA, van
Bueren KL, Chines PS, Narisu N, Black BL, Visel A, Pennacchio LA, Collins FS, NISC Comparative Sequencing Program, National Institutes of Health Intramural Sequencing Center Comparative Sequencing Program Authors, NISC Comparative Sequencing Program Authors :Chromatin stretch enhancer states drive cell-specific gene regulation and harbor human disease risk variants.Proc Natl Acad Sci U S A2013,110:17921–17926. 25. Stitzel ML, Sethupathy P, Pearson DS, Chines PS, Song L, Erdos MR, Welch R,
Parker SC, Boyle AP, Scott LJ, Margulies EH, Boehnke M, Furey TS, Crawford GE, Collins FS, NISC Comparative Sequencing Program:Global epigenomic analysis of primary human pancreatic islets provides insights into type 2 diabetes susceptibility loci.Cell Metab2010,12:443–455.
26. Akhtar-Zaidi B, Cowper-Sal-lari R, Corradin O, Saiakhova A, Bartels CF, Balasubramanian D, Myeroff L, Lutterbaugh J, Jarrar A, Kalady MF, Willis J, Moore JH, Tesar PJ, Laframboise T, Markowitz S, Lupien M, Scacheri PC:
Epigenomic enhancer profiling defines a signature of colon cancer. Science2012,336:736–739.
27. Alcina A, Fedetz M, Fernández Ó, Saiz A, Izquierdo G, Lucas M, Leyva L, García-León JA, Abad-Grau Mdel M, Alloza I, Antigüedad A, Garcia-Barcina
MJ, Vandenbroeck K, Varadé J, de la Hera B, Arroyo R, Comabella M, Montalban X, Petit-Marty N, Navarro A, Otaegui D, Olascoaga J, Blanco Y, Urcelay E, Matesanz F:
Identification of a functional variant in theKIF5A-CYP27B1-METTL1-FAM119B locus associated with multiple sclerosis.J Med Genet2012,50:25–33. 28. Bauer DE, Kamran SC, Lessard S, Xu J, Fujiwara Y, Lin C, Shao Z, Canver MC,
Smith EC, Pinello L, Sabo PJ, Vierstra J, Voit RA, Yuan GC, Porteus MH, Stamatoyannopoulos JA, Lettre G, Orkin SH:An erythroid enhancer of BCL11Asubject to genetic variation determines fetal hemoglobin level. Science2013,342:253–257.
29. Miller CL, Anderson DR, Kundu RK, Raiesdana A, Nurnberg ST, Diaz R, Cheng K, Leeper NJ, Chen CH, Chang IS, Schadt EE, Hsiung CA, Assimes TL, Quertermous T:Disease-related growth factor and embryonic signaling pathways modulate an enhancer of TCF21 expression at the 6q23.2 coronary heart disease locus.PLoS Genet2013,9:e1003652. 30. Smemo S, Tena JJ, Kim KH, Gamazon ER, Sakabe NJ, Gomez-Marin C,
Aneas I, Credidio FL, Sobreira DR, Wasserman NF, Lee JH, Puviindran V, Tam D, Shen M, Son JE, Vakili NA, Sung HK, Naranjo S, Acemel RD, Manzanares M, Nagy A, Cox NJ, Hui CC, Gomez-Skarmeta JL, Nóbrega MA:
Obesity-associated variants within FTO form long-range functional connections with IRX3.Nature2014,507:371–375.
31. Harismendy O, Notani D, Song X, Rahim NG, Tanasa B, Heintzman N, Ren B, Fu XD, Topol EJ, Rosenfeld MG, Frazer KA:9p21 DNA variants associated with coronary artery disease impair interferon-γsignalling response. Nature2011,470:264–268.
32. Kapoor A, Sekar RB, Hansen NF, Fox-Talbot K, Morley M, Pihur V, Chatterjee S, Brandimarto J, Moravec CS, Pulit SL, Pfeufer A, Mullikin J, Ross M, Green ED, Bentley D, Newton-Cheh C, Boerwinkle E, Tomaselli GF, Cappola TP, Arking DE, Halushka MK, Chakravarti A, QT Interval-International GWAS Consortium:An enhancer polymorphism at the cardiomyocyte intercalated disc protein NOS1AP locus is a major regulator of the QT interval.Am J Hum Genet2014,94:854–869.
33. Guenther CA, Tasic B, Luo L, Bedell MA, Kingsley DM:A molecular basis for classic blond hair color in Europeans.Nat Genet2014,46:748–752. 34. Pomerantz MM, Ahmadiyeh N, Jia L, Herman P, Verzi MP, Doddapaneni H,
Beckwith CA, Chan JA, Hills A, Davis M, Yao K, Kehoe SM, Lenz HJ, Haiman CA, Yan C, Henderson BE, Frenkel B, Barretina J, Bass A, Tabernero J, Baselga J, Regan MM, Manak JR, Shivdasani R, Coetzee GA, Freedman ML:The 8q24 cancer risk variant rs6983267 shows long-range interaction with MYC in colorectal cancer.Nat Genet2009,41:882–884.
35. Wasserman NF, Aneas I, Nobrega MA:An 8q24 gene desert variant associated with prostate cancer risk confers differential in vivo activity to a MYC enhancer.Genome Res2010,20:1191–1197.
36. Tuupanen S, Yan J, Turunen M, Gylfe AE, Kaasinen E, Li L, Eng C, Culver DA, Kalady MF, Pennison MJ, Pasche B, Manne U, de la Chapelle A, Hampel H, Henderson BE, Le Marchand L, Hautaniemi S, Askhtorab H, Smoot D, Sandler RS, Keku T, Kupfer SS, Ellis NA, Haiman CA, Taipale J, Aaltonen LA:
Characterization of the colorectal cancer-associated enhancer MYC-335 at 8q24: the role of rs67491583.Cancer Genet2012,205:25–33. 37. Spieler D, Kaffe M, Knauf F, Bessa J, Tena JJ, Giesert F, Schormair B, Tilch E,
Lee H, Horsch M, Czamara D, Karbalai N, von Toerne C, Waldenberger M, Gieger C, Lichtner P, Claussnitzer M, Naumann R, Müller-Myhsok B, Torres M, Garrett L, Rozman J, Klingenspor M, Gailus-Durner V, Fuchs H, Hrabe de Angelis M, Beckers J, Hölter SM, Meitinger T, Hauck SM,et al:Restless legs syndrome-associated intronic common variant inMeis1alters enhancer function in the developing telencephalon.Genome Res2014,24:592–603. 38. Cowper-Sal lari R, Zhang X, Wright JB, Bailey SD, Cole MD, Eeckhoute J,
Moore JH, Lupien M:Breast cancer risk-associated SNPs modulate the affinity of chromatin for FOXA1 and alter gene expression.Nat Genet
2012,44:1191–1198.
39. Wright JB, Brown SJ, Cole MD:Upregulation of c-MYCin cisthrough a large chromatin loop linked to a cancer risk-associated single-nucleotide polymorphism in colorectal cancer cells.Mol Cell Biol2010,30:1411–1420. 40. Wang S, Wen F, Wiley GB, Kinter MT, Gaffney PM:An enhancer element
harboring variants associated with systemic lupus erythematosus engages the TNFAIP3promoter to influence A20 expression.PLoS Genet2013,9:e1003750. 41. Whyte WA, Orlando DA, Hnisz D, Abraham BJ, Lin CY, Kagey MH, Rahl PB, Lee TI, Young RA:Master transcription factors and mediator establish super-enhancers at key cell identity genes.Cell2013,153:307–319. 42. Hnisz D, Abraham BJ, Lee TI, Lau A, Saint-Andre V, Sigova AA, Hoke HA,
Young RA:Super-enhancers in the control of cell identity and disease. Cell2013,155:934–947.
Corradin and ScacheriGenome Medicine2014,6:85 Page 12 of 14
43. Zhang X, Cowper-Sal lari R, Bailey SD, Moore JH, Lupien M:Integrative functional genomics identifies an enhancer looping to theSOX9gene disrupted by the 17q24.3 prostate cancer risk locus.Genome Res2012,
22:1437–1446.
44. Grice EA, Rochelle ES, Green ED, Chakravarti A, McCallion AS:Evaluation of the RET regulatory landscape reveals the biological relevance of a HSCR-implicated enhancer.Hum Mol Genet2005,14:3837–3845. 45. Emison ES, McCallion AS, Kashuk CS, Bush RT, Grice E, Lin S, Portnoy ME,
Cutler DJ, Green EG, Chakravarti A:A common sex-dependent mutation in a RET enhancer underlies Hirschsprung disease risk.Nature2005,434:857–863. 46. Weedon MN, Cebola I, Patch AM, Flanagan SE, De Franco E, Caswell R,
Rodríguez-Seguí SA, Shaw-Smith C, Cho CH, Lango Allen H, Houghton JA, Roth CL, Chen R, Hussain K, Marsh P, Vallier L, Murray A, Ellard S, Ferrer J, Hattersley AT, International Pancreatic Agenesis Consortium:Recessive mutations in a distalPTF1Aenhancer cause isolated pancreatic agenesis. Nat Genet2014,46:61–64.
47. Furniss D, Lettice LA, Taylor IB, Critchley PS, Giele H, Hill RE, Wilkie AO:A variant in the sonic hedgehog regulatory sequence (ZRS) is associated with triphalangeal thumb and deregulates expression in the developing limb.Hum Mol Genet2008,17:2417–2423.
48. Lettice LA:Combinatorial effects of multiple enhancer variants in linkage disequilibrium dictate levels of gene expression to confer susceptibility to common traits.Hum Mol Genet2003,12:1725–1735.
49. Kioussis D, Vanin E, deLange T, Flavell RA, Grosveld FG:β-Globin gene inactivation by DNA translocation inγβ-thalassaemia.Nature1983,
306:662–666.
50. Semenza GL, Delgrosso K, Poncz M, Malladi P, Schwartz E, Surrey S:The silent carrier allele:βthalassemia without a mutation in theβ-globin gene or its immediate flanking regions.Cell1984,39:123–128. 51. Boyle AP, Hong EL, Hariharan M, Cheng Y, Schaub MA, Kasowski M,
Karczewski KJ, Park J, Hitz BC, Weng S, Cherry JM, Snyder M:Annotation of functional variation in personal genomes using RegulomeDB.Genome Res
2012,22:1790–1797.
52. Ward LD, Kellis M:HaploReg: a resource for exploring chromatin states, conservation, and regulatory motif alterations within sets of genetically linked variants.Nucleic Acids Res2012,40:D930–D934.
53. Coetzee SG, Rhie SK, Berman BP, Coetzee GA, Noushmehr H:FunciSNP: an R/bioconductor tool integrating functional non-coding data sets with genetic association studies to identify candidate regulatory SNPs. Nucleic Acids Res2012,40:e139.
54. Khurana E, Fu Y, Colonna V, Mu XJ, Kang HM, Lappalainen T, Sboner A, Lochovsky L, Chen J, Harmanci A, Das J, Abyzov A, Balasubramanian S, Beal K, Chakravarty D, Challis D, Chen Y, Clarke D, Clarke L, Cunningham F, Evani US, Flicek P, Fragoza R, Garrison E, Gibbs R, Gümüs ZH, Herrero J, Kitabayashi N, Kong Y, Lage K,et al:Integrative annotation of variants from 1092 humans: application to cancer genomics.Science2013,
342:1235587.
55. Sanyal A, Lajoie BR, Jain G, Dekker J:The long-range interaction landscape of gene promoters.Nature2012,489:109–113.
56. Jin F, Li Y, Dixon JR, Selvaraj S, Ye Z, Lee AY, Yen CA, Schmitt AD, Espinoza CA, Ren B:A high-resolution map of the three-dimensional chromatin interactome in human cells.Nature2013,503:290–294.
57. Li G, Ruan X, Auerbach RK, Sandhu KS, Zheng M, Wang P, Poh HM, Goh Y, Lim J, Zhang J, Sim HS, Peh SQ, Mulawadi FH, Ong CT, Orlov YL, Hong S, Zhang Z, Landt S, Raha D, Euskirchen G, Wei CL, Ge W, Wang H, Davis C, Fisher-Aylor KI, Mortazavi A, Gerstein M, Gingeras T, Wold B, Sun Y,et al:
Extensive promoter-centered chromatin interactions provide a topological basis for transcription regulation.Cell2012,148:84–98. 58. Zhang Y, Wong CH, Birnbaum RY, Li G, Favaro R, Ngan CY, Lim J, Tai E, Poh
HM, Wong E, Mulawadi FH, Sung WK, Nicolis S, Ahituv N, Ruan Y, Wei CL:
Chromatin connectivity maps reveal dynamic promoter-enhancer long-range associations.Nature2013,504:306–310.
59. Bickmore WA:The spatial organization of the human genome.Ann Rev Genomics Hum Genet2013,14:67–84.
60. Williamson I, Eskeland R, Lettice LA, Hill AE, Boyle S, Grimes GR, Hill RE, Bickmore WA:Anterior-posterior differences in HoxD chromatin topology in limb development.Development2012,139:3157–3167.
61. Dekker J, Rippe K, Dekker M, Kleckner N:Capturing chromosome conformation.Science2002,295:1306–1311.
62. Simonis M, Klous P, Splinter E, Moshkin Y, Willemsen R, de Wit E, van Steensel B, de Laat W:Nuclear organization of active and inactive
chromatin domains uncovered by chromosome conformation capture-on-chip (4C).Nat Genet2006,38:1348–1354.
63. de Wit E, de Laat W:A decade of 3C technologies: insights into nuclear organization.Genes Dev2012,26:11–24.
64. Sajan SA, Hawkins RD:Methods for identifying higher-order chromatin structure.Ann Rev Genomics Hum Genet2012,13:59–82.
65. Panne D:The enhanceosome.Curr Opin Struct Biol2008,18:236–242. 66. Thurman RE, Rynes E, Humbert R, Vierstra J, Maurano MT, Haugen E,
Sheffield NC, Stergachis AB, Wang H, Vernot B, Garg K, John S, Sandstrom R, Bates D, Boatman L, Canfield TK, Diegel M, Dunn D, Ebersol AK, Frum T, Giste E, Johnson AK, Johnson EM, Kutyavin T, Lajoie B, Lee BK, Lee K, London D, Lotakis D, Neph S,et al:The accessible chromatin landscape of the human genome.Nature2012,489:75–82.
67. Shen Y, Yue F, McCleary DF, Ye Z, Edsall L, Kuan S, Wagner U, Dixon J, Lee L, Lobanenkov VV, Ren B:A map of thecis-regulatory sequences in the mouse genome.Nature2012,488:116–120.
68. Factor DC, Corradin O, Zentner GE, Saiakhova A, Song L, Chenoweth JG, McKay RD, Crawford GE, Scacheri PC, Tesar PJ:Epigenomic comparison reveals activation of“seed”enhancers during transition from naive to primed pluripotency.Cell Stem Cell2014,14:854–863.
69. He B, Chen C, Teng L, Tan K:Global view of enhancer-promoter interactome in human cells.Proc Natl Acad Sci U S A2014,111:E2191–E2199.
70. Sheffield NC, Thurman RE, Song L, Safi A, Stamatoyannopoulos JA, Lenhard B, Crawford GE, Furey TS:Patterns of regulatory activity across diverse human cell types predict tissue identity, transcription factor binding, and long-range interactions.Genome Res2013,23:777–788. http://dnase. genome.duke.edu/.
71. Fairfax BP, Makino S, Radhakrishnan J, Plant K, Leslie S, Dilthey A, Ellis P, Langford C, Vannberg FO, Knight JC:Genetics of gene expression in primary immune cells identifies cell type-specific master regulators and roles ofHLAalleles.Nat Genet2012,44:502–510.
72. Raj T, Rothamel K, Mostafavi S, Ye C, Lee MN, Replogle JM, Feng T, Lee M, Asinovski N, Frohlich I, Imboywa S, Von Korff A, Okada Y, Patsopoulos NA, Davis S, McCabe C, Paik HI, Srivastava GP, Raychaudhuri S, Hafler DA, Koller D, Regev A, Hacohen N, Mathis D, Benoist C, Stranger BE, De Jager PL:
Polarization of the effects of autoimmune and neurodegenerative risk alleles in leukocytes.Science2014,344:519–523.
73. Patwardhan RP, Hiatt JB, Witten DM, Kim MJ, Smith RP, May D, Lee C, Andrie JM, Lee SI, Cooper GM, Ahituv N, Pennacchio LA, Shendure J:
Massively parallel functional dissection of mammalian enhancersin vivo. Nat Biotechnol2012,30:265–270.
74. Kheradpour P, Ernst J, Melnikov A, Rogov P, Wang L, Zhang X, Alston J, Mikkelsen TS, Kellis M:Systematic dissection of regulatory motifs in 2000 predicted human enhancers using a massively parallel reporter assay. Genome Res2013,23:800–811.
75. Shlyueva D, Stampfel G, Stark A:Transcriptional enhancers: from properties to genome-wide predictions.Nat Rev Genet2014,15:272–286. 76. Gaulton KJ, Nammo T, Pasquali L, Simon JM, Giresi PG, Fogarty MP, Panhuis
TM, Mieczkowski P, Secchi A, Bosco D, Berney T, Montanya E, Mohlke KL, Lieb JD, Ferrer J:A map of open chromatin in human pancreatic islets. Nat Genet2010,42:255–259.
77. The ENCODE Project Consortium:Identification and analysis of functional elements in 1% of the human genome by the ENCODE pilot project. Nature2007,447:799–816.
78. The International HapMap Consortium:A second generation human haplotype map of over 3.1 million SNPs.Nature2007,449:851–861. 79. The International HapMap 3 Consortium:Integrating common and rare
genetic variation in diverse human populations.Nature2010,467:52–58. 80. Ongen H, Andersen CL, Bramsen JB, Oster B, Rasmussen MH, Ferreira PG,
Sandoval J, Vidal E, Whiffin N, Planchon A, Padioleau I, Bielser D, Romano L, Tomlinson I, Houlston RS, Esteller M, Orntoft TF, Dermitzakis ET:Putative cis-regulatory drivers in colorectal cancer.Nature2014,512:87–90. 81. Fairfax BP, Humburg P, Makino S, Naranbhai V, Wong D, Lau E, Jostins L,
Plant K, Andrews R, McGee C, Knight JC:Innate immune activity conditions the effect of regulatory variants upon monocyte gene expression.Science2014,343:1246949.
transcription factor binding site patterns: from diabetes risk loci to disease mechanisms.Cell2014,156:343–358.
83. Kilpinen H, Waszak SM, Gschwind AR, Raghav SK, Witwicki RM, Orioli A, Migliavacca E, Wiederkehr M, Gutierrez-Arcelus M, Panousis NI, Yurovsky A, Lappalainen T, Romano-Palumbo L, Planchon A, Bielser D, Bryois J, Padioleau I, Udin G, Thurnheer S, Hacker D, Core LJ, Lis JT, Hernandez N, Reymond A, Deplancke B, Dermitzakis ET:Coordinated effects of sequence variation on DNA binding, chromatin structure, and transcription.Science2013,
342:744–747.
doi:10.1186/s13073-014-0085-3
Cite this article as:Corradin and Scacheri:Enhancer variants: evaluating functions in common disease.Genome Medicine20146:85.
Corradin and ScacheriGenome Medicine2014,6:85 Page 14 of 14