Inter-chromosomal variation in
the pattern of human population
genetic structure
Tesfaye M. Baye*
Cincinnati Children’s Hospital Medical Center, Division of Asthma Research, Department of Pediatrics, University of Cincinnati, 3333 Burnet Avenue, Cincinnati, OH 45229, USA
*Correspondence to:Tel:þ1 513 803 2766; Fax: þ1 513 636 1657; E-mail: [email protected]
Date received (in revised form): 1st March 2011
Abstract
Emerging technologies now make it possible to genotype hundreds of thousands of genetic variations in individuals, across the genome. The study of loci at finer scales will facilitate the understanding of genetic variation at genomic and geographic levels. We examined global and chromosomal variations across HapMap populations using 3.7 million single nucleotide polymorphisms to search for the most stratified genomic regions of human populations and linked these regions to ontological annotation and functional network analysis. To achieve this, we used five complementary statistical and genetic network procedures: principal component (PC), cluster, discriminant, fix-ation index (FST) and network/pathway analyses. At the global level, the first two PC scores were sufficient to
account for major population structure; however, chromosomal level analysis detected subtle forms of population structure within continental populations, and as many as 31 PCs were required to classify individuals into homo-geneous groups. Using recommended population ancestry differentiation measures, a total of 126 regions of the genome were catalogued. Gene ontology and networks analyses revealed that these regions included the genes encoding oculocutaneous albinism II (OCA2), hect domain and RLD 2 (HERC2), ectodysplasin A receptor (EDAR) and solute carrier family 45, member 2 (SLC45A2). These genes are associated with melanin production, which is involved in the development of skin and hair colour, skin cancer and eye pigmentation. We also identified the genes encoding interferon-g(IFNG) and death-associated protein kinase 1 (DAPK1), which are associated with cell death, inflammatory and immunological diseases. An in-depth understanding of these genomic regions may help to explain variations in adaptation to different environments. Our approach offers a comprehensive strategy for analysing chromosome-based population structure and differentiation, and demonstrates the application of complementary statistical and functional network analysis in human genetic variation studies.
Keywords:discriminant analysis, principal component analysis, cluster analysis, fixation index,FST, population structure, gene network
Introduction
The comprehensive identification and control of population genetic structure and dissection of poly-morphism are important steps in genomic studies aimed at gene mapping through (either directly or indirectly) linkage disequilibrium (LD).1 – 4
fractions of the genome and thus have provided only average estimates of quantities such as fixation index (FST) across whole genomes and populations.9
The study of a few genes with significant popu-lation differentiation can be extremely efficient — for example, in screening for potential tumour markers or drug targets. Such analyses do not reach the full potential of genome-wide experiments to increase our understanding of whole biological processes, however. What is needed instead is a hol-istic approach to analysing the entire genome which shows major population differentiation and allows biologists to develop an integrated under-standing of the functional networks/pathways driving population diversity.10 Pa¨a¨bo11 suggested that, in variation studies, rather than ‘populations’, ‘ethnicities’ or ‘races’, a more efficient approach for studying within- and between-individual human chromosomal variation is to consider the genome of any particular individual as a mosaic of haplo-type blocks.
To date, analyses of the relationship between genetic variation and ancestral geographic origin have been limited to a few regions or genes because large-scale, genome-wide single nucleotide polymorphism (SNP) data from geographically diverse individuals have not been available. Given that levels of diversity/polymorphism are directly related to recombination (meiosis) and mutation rates that differ within and among chromosomes,12 and that genes are not randomly distributed along chromosomes, the precise genes contributing to disease development and genealogy are not the same on each chromosome or part thereof.13 – 19
Recently, Grimwood et al.20 showed that the gene density on chromosome 19 is more than double the genome-wide average. Hence, the pre-cision of equal segregation estimates of recombina-tion fraction for all chromosomes and population-average values are not reliable, in terms of chromosome biological and evolutionary signifi-cance. The Santa Cruz Biotechnology group also announced a human chromosome database that fea-tures a chromosome-based index, which includes the chromosomal location of known human genes
and links to the National Center for Biotechnology Information (NCBI) mRNA, protein and Online Mendelian Inheritance in Man (OMIM) databases (http://www.scbt.com).
With the growing emphasis on dense SNPs and genome-wide association studies, and the recent accumulation of large, publicly available data-sets21,22— such as the completion of HapMap,23 with over 3.7 million SNPs across the genome — there is an increasing need not only for fine-scale resolution of clines of population structure, but also to identify functional pathways in genomic regions of major population differentiation with influences on disease risk.24 The thorough evaluation of the extent of fine-scale genetic structure among closely neighbouring populations, as well as the study of the ability to infer individual membership down to a particular population within a continent, have only begun in the past five years.
The objectives of this study were as follows: (i) to examine the extent and patterns of within-and between-chromosomal variations; (ii) to deter-mine population genetics structure and population membership and (iii) to identify SNPs with major population differentiation and link this information with ontological annotation and functional net-works/pathways.
Materials and methods
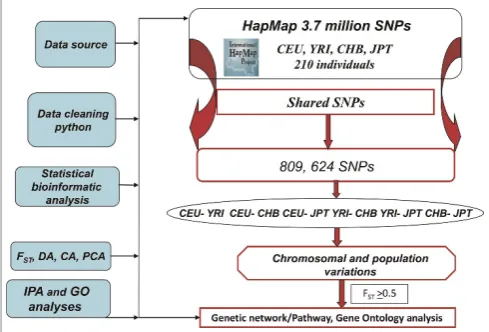
comparisons. A computer program using Python (http://www.python.org) was written to export and pre-process SNP genotype information from the databases. Genotypes were summarised for each population. For each dataset, the number of alleles per locus (SNP) was coded to a string of numbers to obtain a full design matrix of alleles (the cells give the number of copies of each major allele for each individual: zero, one or two). Figure 1 depicts our approach to SNP mining, multivariate chromo-somal and population diversity and network analysis strategies. Of the total 3.7 million SNPs in the HapMap data release,23,25 809,000 SNPs fulfilled the criteria and were used in this analysis.
Statistical analysis
Multivariate statistical techniques (namely, principal component [PC], cluster, discriminant, network analyses and FST statistics) were used to examine
chromosomal structure within and between popu-lations and associated functional networks by esti-mating chromosomal overall differentiation values. The analysis was carried out either using all SNPs together or separately for each chromosome. Because PC analysis (PCA) does not take into account group differences in reducing the dataset to a few representative variables, and it can be difficult to make appropriate inference about population relationships from the PC scatter plot, we further analysed the data using cluster analysis (CA) to clas-sify individuals into mutually exclusive groups with high homogeneity within clusters and with low homogeneity between clusters. In other words, CA provides a visual assessment and identifies individ-uals who are similar (or dissimilar) to one another. To further confirm the grouping obtained in CA, discriminate analysis (DA) was performed. DA con-sists of the separation of a priori given classes for each individual. The variance – covariance between classes is maximised and the variance – covariance within classes is minimised under simultaneous consideration of all analysed data.
PCA was done using the EIGENSOFT software package (http://genepath.med.harvard.edu/~reich/ Software.htm) either on all SNPs simultaneously (all loci together) or separately per each chromosome. The analysis follows singular value decomposition, a procedure that produces eigenvectors, correspond-ing eigenvalues and proportions of eigenvalues, as well as the scores of the PCs.26Using PCA, we esti-mated axes of variation corresponding to ancestry. The first eigenvector separates the samples in a way that explains the largest amount of variability, while the second and subsequent ones explain lesser amounts of variability. The spatial relationships of populations in each chromosome and all chromo-somes were presented by plotting the scores of the first and second PCs. The numbers of significant PCs (at the level of p,0.05) were tested using Tracy – Widom statistics. Pairwise population genetic diversity was determined by calculation of Wright’s FSTusing EIGENSOFT. FST values indi-cate how much of the genetic variability between individuals from different populations is due to population affiliation.
Hierarchical clustering of molecular variance was followed using the similarity for qualitative data (SIMQUAL) module with the first 10 PCs that account for most of the variation. Average taxo-nomic distance matrices (DIST) were computed as a measure of genetic distance. This matrix was sub-jected to unweighted pair-group method analysis (UPGMA) to generate a dendrogram using the Sequential, Agglomerative, Hierarchical and Nested (SAHN) module. Both numerical taxonomic ana-lyses were performed using the Numerical Taxonomy and Multivariate Analysis System Program, version 2.11f (NTSYS-pc).27 The cophe-netic correlation coefficient was calculated, and Mantel’s test28 was performed, to check the good-ness of fit of a CA.
In DA, a linear combination of features that best separates two or more groups of objects is sought. The discriminant functions are determined based on the maximisation of the ratio of the external (between populations) to the internal (between indi-viduals within the same population) variability.29 The values of Wilks’ lambda (l) and their X2 statistics are used to evaluate the number of signifi-cant discriminant functions. In turn, to determine the most important features of the objects, partial Wilks’ l and its Fisher statistics were utilised.29 Discriminant function analysis30 was done following the SAS system31 DISCRIM, CANDISC and STEPDISC procedures, and significance was tested using Wilks’ l.32 In order to avoid the limitation of a large number of alleles compared with the number of observations and the correlation occur in allele frequencies, we ran discriminant analysis using the uncorrelated SNPs in the top significant PCs. This ensures that variables submitted to DA are perfectly uncorrelated and that their number is lower than that of analysed individuals. Linear discriminant analysis is similar to logistic regression and is useful for building a predictive model of group member-ship based on observed characteristics. The pro-cedure yields a set of discriminant functions based on the linear combinations of variables that provide the best discrimination between groups.
In the final set of analyses, a dataset containing a total of 126 genomic regions linked to SNPs that
differed between populations (FST0.5) was uploaded into the Ingenuity Pathways Analysis (IPA) 8.7 network analysis (Ingenuity Systems, Redwood City CA, USA). The network generated from the 126 input genes (called focus genes) uses both direct and indirect relationships/connectivity. These networks were ranked by scores that measured the probability that the genes were included in the network by chance alone. Networks with scores of three or more were classi-fied as not being generated by random chance.33 The significance threshold for Fisher’s exact test to determine the probability that each biological func-tion and/or disease assigned to that network is due to chance alone was 0.05 or less. Canonical path-ways associated with input genes were elucidated with a statistical significance value. The gene ontol-ogy (GO) analysis was used to identify functional commonalities between the genes based on the number of shared ancestors in gene products (http:gostat.wehi.edu.au).
Results
Estimates of FST differ between chromosomes and populations
genetics differentiation, values between 0.05 and 0.15 represent moderate population divergence, values between 0.15 and 0.25 indicate large popu-lation differentiation and FST values greater than 0.25 represent very large population divergence.38 Usually, an FST.0.5 is considered sufficient for ancestry differentiation.
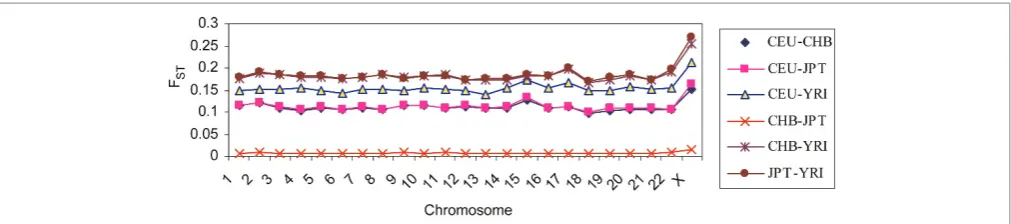
The global pairwise FST value estimated for the 210 worldwide samples using all loci together (FST_SNP_ALL) was 0.130 (p,10
26
). As FST increases, populations become more distant and/or unrelated to each other.39 We observed an average genetic differentiation between CEU and YRI (FST¼0.153), CEU and CHB (FST¼0.110), CEU and JPT (FST¼0.111), YRI and CHB (FST¼0.190) and YRI and JPT (FST¼0.192) (Figure 2). It is evident that more divergence has occurred between YRI and each of the three other populations than between the other pairs of popu-lations. Genetic distances between CHB and JPT populations were low (mean FST¼0.007), indicat-ing that substantial gene flow compensates for the effects of genetic drift. This low FST value as a result of high similarities in allele frequencies between CHB and JPT samples motivates research-ers to analyse CHB and JPT populations jointly, as a single panel.25
Regardless of the populations compared, most of the variation was observed within populations (average, 87 per cent versus 13 per cent variation observed between populations). Within-population diversity reflects the number of different types in the population, taking into account their fre-quencies. By contrast, between-population
differentiation measures variation based on the rela-tive frequencies of types within these subpopu-lations and, ideally, measures the average distance of subpopulations from their respective lumped remainders. The fact that only 13 per cent of the total genetic variation results from differences between populations indicates that alleles present in one population are also present in other popu-lations.40 – 43 The remaining 87 per cent represents the average difference between members of the same population. One way to interpret this number is to say that the expected genetic difference between unrelated individuals from distant conti-nents exceeds by 13 per cent the expected differ-ence between members of the same community.44 An interesting common feature in population gen-etics studies of humans, animals, plants and other types of species is that within-population diversity is greater than between-population diversity.45 – 48 This estimate is highly consistent for protein poly-morphisms, blood groups, microsatellites, SNPs and morphological/phenotypic markers.49,50 Therefore, it is necessary to quantify and control population structure, not only for major population differences, but also for subtle variation/structure arising within populations.
Significant numbers of PCs vary by chromosome
As shown in Figure 3, the first component — which accounted for 50.2 per cent of variation — separated YRI populations from CEU and CHB/ JPT, while the second (accounting for 24.2 per
Figure 2. Pairwise FSTchromosomal and population comparisons of the HapMap SNP dataset. A simple measure of population
differentiation is Wright’s FST, which measures the fraction of total genetic variation due to between-population differences. It could
cent of the total variance) could be associated with an Africa/Europe gradient. The overlap between the CHB and JPT populations suggests a low level of genetic differentiation, as shown by the pairwise FST divergence (Figure 2). Overall, these results demonstrate a clear partition of the West African populations considered. On a genome-wide average scale, about 74 per cent of the diversity in human samples was explained by the first two PCs. The eigenvalues for PC3 – PC10 showed a plateau, suggesting that the first two PCs account for most of the populations’ average substructure in this analysis. Such a genome-wide level of population structure may lead to an erroneous conclusion that the samples are genetically homogeneous. Thus, correction for population structure is only as good as the level of structure (at a finer or coarser level) that one wishes to correct.
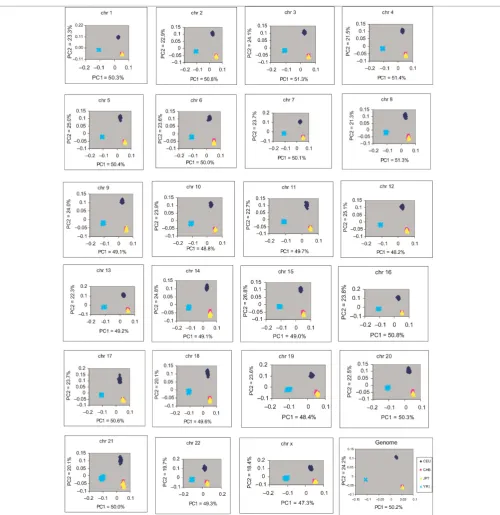
In order to obtain fine-scale resolution of popu-lation membership, PCA was performed on each chromosome. Our analysis showed that the contri-bution of the first two PCs in classifying geographi-cal regions varied among chromosomes, ranging from 65 per cent (Chr X) to 76 per cent (Chr 15). The contribution of PC1 ranged from 47 per cent (Chr X) to 51 per cent (Chr 3, Chr 8). The con-tribution of PC2 to the total variation ranged from 18 per cent (Chr X) to 27 per cent for Chr 15 (Supplementary Figure S1). As shown in Figure 4, on a finer scale, the number of significant PCs accounting for population differentiation varies
from 2 (Chr 2) to 31 (Chr X) among chromo-somes. The higher number of significant PCs on Chr X explains why it has the lowest chromosome-wise contribution to the first two PCs (Supplementary Figure S1).
We next characterised the genetic relationships existing among the four different populations. The diagrammatic output of CA (constructed from PCs) for the mean of 210 individuals indicated that these individuals could be clustered into groups that basi-cally coincided with their geographical distribution (data not shown). The analysis confirmed the dis-tinctiveness of the CEU and YRI populations and the close average genetic distance between the CHB and JPT populations (Supplementary Figure S2). The results of the chromosomal-based CA (data not shown) were comparable to those of the PCA, and both methods classified racial popu-lations into separate groups.
DA predicts population membership for 70 per cent of individuals
Although the overall population differentiation between the CHB and JPT populations appeared low using PCA and FST analysis, DA51 indicated that 30 per cent of the two populations were misclassified (Table 1). Thirty of the CHB individ-uals (n¼45) were correctly classified (67 per cent), while among the JPT individuals (n¼45), 38 were correctly classified (Table 1). The European and African populations were 100 per cent correctly
Figure 4. Significant numbers of PCs among chromosomes in the HapMap dataset. On a finer scale, the number of significant PCs that account for population differentiations vary from 2 to 31 among chromosomes.
classified to their respective groups. The classifi-cation matrix presented in Table 1 summarises the predictive ability of DA when each sample is assigned to a particular geographical region. Given the growing interest in high-density whole-genome association and admixture studies, DA is informa-tive because misclassified individuals can be ident-ified and assigned to their appropriate ancestral populations. Levels of correct and incorrect classifi-cation of human populations to their geographical regions of origin differed for each chromosome (Supplementary Table 1). For example, correct classifications of the 45 CHB individuals to their geographical regions of origin ranged from 23 (for Chr 6) to 35 (for Chr X). Chr 9 had the highest number of misclassified individuals and Chr X had the lowest. On the other hand, correctly classified individuals in the JPT population ranged from 25 (for Chr 9) to 36 (for Chr 19). Chr 18 had the lowest and Chr 9 the highest number of misclassi-fied individuals in the JPT population. Chr 9 had the highest number of misclassifications in both the CHB and JPT populations. The variation in mis-classification rate might indicate the existence of
mosaic chromosomal blocks derived from other populations as a result of common ancestry or admixture. The use of more PCs might improve classification accuracy.
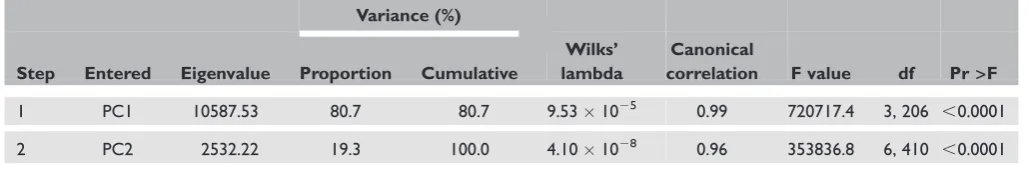
The summarised results of a stepwise DA to select variables with the most classification power are shown in Table 2. Wilks’ l and associated F-values are used as indices of discriminatory power and are presented for each successive step. To test the statistical significance of the discriminant function, the value of Wilks’ l ( 0.00) was assessed.52 The Wilks’ l test showed that the ratio of the within-groups sum of squares to the total sum of squares was significant (Wilks’ l 9.53E-5, p,0.001); thus, the null hypothesis of CEU¼
CHB¼JPT¼YRI was rejected.
The eigenvalue is the ratio of the between-groups sum of squares to the within-groups sum of squares.52 This value measures the spread of the group centroids in the dimension of multivariate space (eigenvalue 10587.53; p,0.0001). The canonical correlation measures the association between discriminant scores and groups. This association appeared to be statistically significant
Table 2. Stepwise order of inclusion of variables in the DA that distinguishes between human populations
Variance (%)
Step Entered Eigenvalue Proportion Cumulative
Wilks’ lambda
Canonical
correlation F value df Pr>F
1 PC1 10587.53 80.7 80.7 9.531025 0.99 720717.4 3, 206 ,0.0001
2 PC2 2532.22 19.3 100.0 4.101028 0.96 353836.8 6, 410 ,0.0001
PC1, PC2, principal components 1 and 2; df, degrees of freedom; Pr.F, ( probability level) associated with the F statistic. Table 1. Classification matrix for HapMap individuals based on SNP markers using DA
Population n Predicted population group
1 2 3 4 % correct
CEU - European ancestry [1] 60 60 0 0 0 100
CHB - Chinese from Beijing [2] 45 0 30 15 0 67
JPT - Japanese from Tokyo [3] 45 0 7 38 0 84
YRI - Nigerian from Yorubans [4] 60 0 0 0 60 100
Total 210 60 37 53 60 90
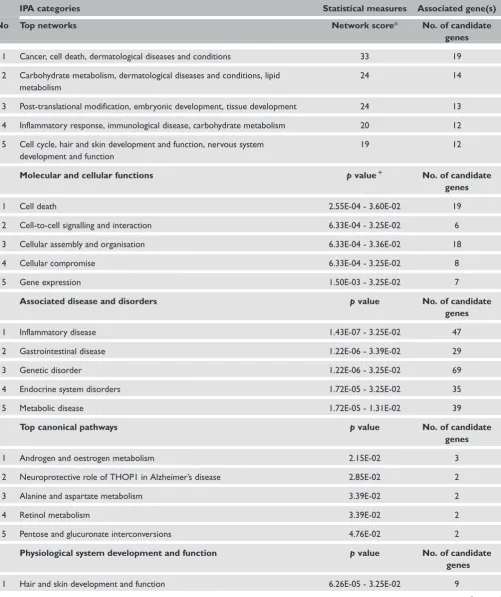
Table 3. IPA summary of associated networks, molecular and cellular functions, diseases and disorders and canonical pathways for the 126 genes mapped to significantly differentiated genomic regions.
IPA categories Statistical measures Associated gene(s)
No Top networks Network score* No. of candidate
genes
1 Cancer, cell death, dermatological diseases and conditions 33 19
2 Carbohydrate metabolism, dermatological diseases and conditions, lipid metabolism
24 14
3 Post-translational modification, embryonic development, tissue development 24 13
4 Inflammatory response, immunological disease, carbohydrate metabolism 20 12
5 Cell cycle, hair and skin development and function, nervous system development and function
19 12
Molecular and cellular functions pvalue1 No. of candidate
genes
1 Cell death 2.55E-04 - 3.60E-02 19
2 Cell-to-cell signalling and interaction 6.33E-04 - 3.25E-02 6
3 Cellular assembly and organisation 6.33E-04 - 3.36E-02 18
4 Cellular compromise 6.33E-04 - 3.25E-02 8
5 Gene expression 1.50E-03 - 3.25E-02 7
Associated disease and disorders pvalue No. of candidate
genes
1 Inflammatory disease 1.43E-07 - 3.25E-02 47
2 Gastrointestinal disease 1.22E-06 - 3.39E-02 29
3 Genetic disorder 1.22E-06 - 3.25E-02 69
4 Endocrine system disorders 1.72E-05 - 3.25E-02 35
5 Metabolic disease 1.72E-05 - 1.31E-02 39
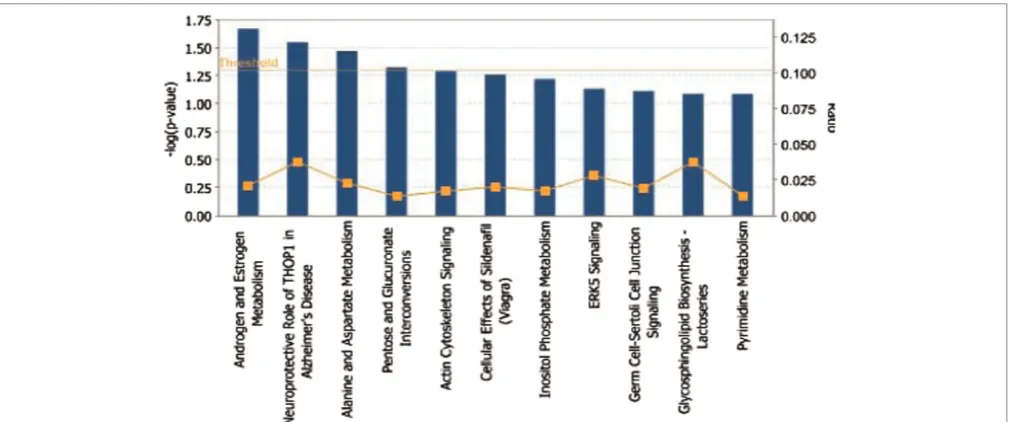
Top canonical pathways pvalue No. of candidate
genes
1 Androgen and oestrogen metabolism 2.15E-02 3
2 Neuroprotective role of THOP1 in Alzheimer’s disease 2.85E-02 2
3 Alanine and aspartate metabolism 3.39E-02 2
4 Retinol metabolism 3.39E-02 2
5 Pentose and glucuronate interconversions 4.76E-02 2
Physiological system development and function pvalue No. of candidate genes
1 Hair and skin development and function 6.26E-05 - 3.25E-02 9
(stepwise elimination, R2¼0.99, 0.96; p,0.0001), and the data were subjected to the stepwise procedure. The first canonical discriminant function had a high eigenvalue, accounting for more than 81 per cent of the total variance. The first and second functions together accounted for 100 per cent of the variance.
Functional networks and pathways in highly stratified genomic regions
To characterise the main functional networks/path-ways underlying genes with substantial population differentiation, we carried out network analysis (see Materials and methods) for between-population comparisons (between CEU – YRI, CEU – CHB/
Table 3. Continued
IPA categories Statistical measures Associated gene(s)
No Top networks Network score* No. of candidate
genes
2 Nervous system development and function 7.22E-04 - 3.36E-02 15
3 Connective tissue development and function 1.17E-03 - 3.25E-02 6
4 Skeletal and muscular system development and function 1.17E-03 - 3.25E-02 11
5 Tissue development 1.17E-03 - 3.25E-02 14
*Networks with scores3 have a 99.9 per cent confidence of not being generated randomly.
þ
The IPA computespvalues of statistically significant findings by comparing the number of molecules of interest relative to the total number of occurrences of these molecules in all functional/pathway annotations stored in the Ingenuity Pathways Knowledge Base (Fisher’s exact test withpvalue adjusted using the Benjamini – Hochberg multiple testing correction).
JPT and YRI – CHB/JPT). A summary of net-works, molecular and cellular functions, diseases and disorders and canonical pathways associated
with the genomic regions are presented in Table 3. A total of 126 genes were significantly differentiated among populations and eligible for
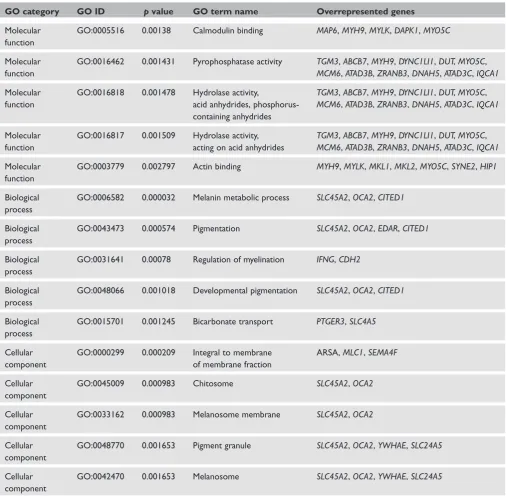
Table 4. Gene Ontology analysis for the 126 genes mapped to significantly differentiated genomic regions
GO category GO ID pvalue GO term name Overrepresented genes
Molecular function
GO:0005516 0.00138 Calmodulin binding MAP6,MYH9,MYLK,DAPK1,MYO5C
Molecular function
GO:0016462 0.001431 Pyrophosphatase activity TGM3,ABCB7,MYH9,DYNC1LI1,DUT,MYO5C,
MCM6,ATAD3B,ZRANB3,DNAH5,ATAD3C,IQCA1
Molecular function
GO:0016818 0.001478 Hydrolase activity,
acid anhydrides, phosphorus-containing anhydrides
TGM3,ABCB7,MYH9,DYNC1LI1,DUT,MYO5C,
MCM6,ATAD3B,ZRANB3,DNAH5,ATAD3C,IQCA1
Molecular function
GO:0016817 0.001509 Hydrolase activity, acting on acid anhydrides
TGM3,ABCB7,MYH9,DYNC1LI1,DUT,MYO5C,
MCM6,ATAD3B,ZRANB3,DNAH5,ATAD3C,IQCA1
Molecular function
GO:0003779 0.002797 Actin binding MYH9,MYLK,MKL1,MKL2,MYO5C,SYNE2,HIP1
Biological process
GO:0006582 0.000032 Melanin metabolic process SLC45A2,OCA2,CITED1
Biological process
GO:0043473 0.000574 Pigmentation SLC45A2,OCA2,EDAR,CITED1
Biological process
GO:0031641 0.00078 Regulation of myelination IFNG,CDH2
Biological process
GO:0048066 0.001018 Developmental pigmentation SLC45A2,OCA2,CITED1
Biological process
GO:0015701 0.001245 Bicarbonate transport PTGER3,SLC4A5
Cellular component
GO:0000299 0.000209 Integral to membrane of membrane fraction
ARSA,MLC1,SEMA4F
Cellular component
GO:0045009 0.000983 Chitosome SLC45A2,OCA2
Cellular component
GO:0033162 0.000983 Melanosome membrane SLC45A2,OCA2
Cellular component
GO:0048770 0.001653 Pigment granule SLC45A2,OCA2,YWHAE,SLC24A5
Cellular component
GO:0042470 0.001653 Melanosome SLC45A2,OCA2,YWHAE,SLC24A5
Abbreviations
MAP6, microtubule-associated protein 6 gene;MYH9, myosin, heavy chain 9 non-muscle gene;MYLK, Myosin light chain kinase gene,MYO5C, myosin VC gene;TGM3, transglutaminase 3 gene;ABCB7, gene for ATP-binding cassette sub-family B, member 7;DYNC1L11, cytoplasmic dynein 1 light intermediate chain 11 gene;DUT, deoxyuridine 5’-triphosphate nucleotidohydrodase gene;MCM6, minichromosome maintenance complex component 6 gene;ATAD3C, AAA domain-containing 3C gene,ZRANNB3, zinc finger RAN-binding domain-containing 3 gene;DNAH5, dynein axonemal heavy chain 5 gene;ATAD3B, AAA domain-containing 3B gene;IQCAI, IQ motif containing with AAA domain gene;MKL1, megakavyoblastic leukaemia (translocation) 1 gene;MKL2, megakavyoblastic leukaemia (translocation) 2 gene;SYNE2, spectrin repeat containing nuclear envelope 2 gene;HIP1, Huntingtin interacting protein 1 gene;SLC45A2, gene for solute carrier family 45, member 2;CDH2, cadherin 2 gene;PTGER3, prostaglandin E receptor 3 (subtype EP3) gene;SLC4AS, gene for solute carrier family 4 sodium bicarbonate cotransporter member 5;ARSA, arylsulfatase 4 gene;MLC1, megalencephalic
leukoencephalopathy with subcortical cysts 1 gene;SEMA4F, semaphorin 4F gene;YWHAE, 14-3-3 protein epsilon gene,CITED1cbp/p300-interacting transactivator 1 gene;
network analysis, which led to the identification of five significant networks (Figure 5). Network 1 was centred on the nuclear factor (NF)-kB complex and had 19 focus genes; network 2 was centred on tumour necrosis factor (TNF) and had 14 focus genes; network 3 was centred on v-myc myelocy-tomatosis viral oncogene homologue (MYC) and had 13 focus genes; network 4 was centred on interferon-g (IFNG) and had 12 focus genes; and network 5 was centred on hepatocyte nuclear factor-4a and had 12 focus genes. Interestingly, although no genes were shared among all these five different networks, two networks (networks 1 and 2) contained chloride intracellular channel 4 (CLIC4), which plays a role in apoptosis, differen-tiation and diabetes. The overlap of this gene suggests that similar biological pathways were targeted by selection in these populations. In addition, the gene involved in skin, hair and eye pigmentation — including oculocutaneous albinism II (OCA2), hect domain and RLD 2 (HERC2), ectodysplasin A receptor (EDAR) and solute carrier family 45, member 2 (SLC45A2) were over-represented in our GO analysis (http:gostat.wehi. edu.au) (Table 4). Enriched GO biological function terms include cytoskeletal protein binding (p¼
1.11026), actin binding (p¼1.01026) and fibroblast growth factor receptor antagonist activity (p¼6.21025).
In conclusion, our approach offers a complemen-tary statistical strategy for summarising overall varia-bility and global versus chromosomal structure, assessing population structure and identifying genomic regions driving genetic divergence among populations. We first used PCA (to reduce data dimensionality); however, because PCA does not take into account group differences in reducing the dataset to a few representative variables, we further analysed the data using CA to classify individuals into mutually exclusive groups with high homogen-eity within clusters and low homogenhomogen-eity between clusters. To further confirm and predict group membership, DA was performed using the top sig-nificant PCs. PCs were used to ensure that variables submitted to DA were perfectly uncorrelated, and that their number was lower than that of analysed
individuals. Finally, using FST (to study population differentiation) analysis, we described the impor-tance of chromosome-based population genetic structure to identify differing genomic regions driven by natural selection. We followed the target genomic regions using network/pathway analysis to elucidate their roles and functional implications in human genetic variations and diseases.
Discussion
Although most researchers traditionally focus on the top few axes of variation in a dataset, substantial information about population structure exists in lower-ranked chromosomal level PCs. Adjustment of global ancestry between study subjects may lead to false positives when chromosomal (local) population structure is an important confounding factor.53 Using chromosome-based analysis, fine-scale sub-structure was detectable beyond the broad population level classifications that previously have been explored using genome-wide average estimates in this dataset. The study of population structure in terms of chromosomes has broader practical rel-evance to researchers who use genetics and genomics approaches in gene mapping because genetic diver-sity is directly related to recombination rate (meiosis), which differs among chromosomes, and genes are not randomly distributed along chromosomes.
chromosomes than in the rest of the chromosomes, indicating that genome size does not correlate with the biological complexity of organisms.54 Interestingly, similar results were reported by Becquet et al 55in their study of chimpanzee popu-lation genetics structure. In plants, a recent study showed that the optimal number of subpopulations required to correct population structure is trait dependent.56 This study reminded us that the number of subpopulations for one trait may not be optimal for other traits. The current analytical approach using genome-wide average PCs as a cov-ariate will control for confounding due to global ancestry but will not control for confounding due to the local (chromosome-based) ancestry effect. It is increasingly important to recognise intra-chromosomal variation, especially when popu-lations have been recently admixed.
Similar to the results of chromosome-based PCA analysis, DA shows that the classification of popu-lations to their correct geographical regions of origin is chromosome dependent. For example, in our analysis, the number of CHB individuals cor-rectly classified to their geographical regions of origin ranged from 23 (for Chr 6) to 35 (for Chr X), while correctly classified individuals in the JPT population ranged from 25 (for Chr 9) to 36 (for Chr 19). Given the growing interest in tracing ancestral origins or contributions in genetically mixed populations, DA is informative and appeal-ing because misclassified individuals can be ident-ified and grouped into appropriate populations prior to large-scale genotyping.
To avoid single-marker FST-based inferences for selection, which can be misleading,57 we ran an in-depth investigation of the patterns of genetic variation in and around the highly differentiated loci and their effects on the phenotype using network/ontology analyses. We overlaid 126 genes (selected based on FST.0.5) onto the Ingenuity Pathways Knowledge Database (http://www.inge-nuity.com). Using this analytical approach, we con-firmed the over-representation of genes implicated in hair and skin development (OCA2, HERC2,
EDAR and SLC45A2) in two of the top networks
(Table 3). EDA-A1 and EDA-A2 are two isoforms
of ectodysplasin that are encoded by the anhidrotic ectodermal dysplasia (EDA) gene. Genetic variabil-ity in the EDA ligand has been associated with loss of hair, sweat glands and teeth.58 The non-synonymous SNP rs1385699 identified within the EDA2 receptor gene (EDA2R) is fixed in both Asian populations, where as an R57K substitution in EDA2Rhas derived-allele (T) frequencies of 100 per cent. The EDA2R gene product is involved in the positive regulation of NF-kB transcription factor activity specifically within the hair follicle, TNF receptor activity, embryonic development and apoptosis.60 These genes were previously reported as candidates involved in human pigmentation phe-notypes and in the development of skin cancer.61 The most striking difference provided by our more direct approach was the over-representation of canonical pathways related to androgen and oestro-gen metabolism (Supplementary Figure S3) and gene groups implicated in the functional category of inflammation, as well as hair and skin develop-ment (Figure S4).
In critically evaluating our results, it is important to note that our analyses, and hence interpretations, are subject to several limitations. First, an important caveat in the use of population-level genetic data-bases such as HapMap is the ascertainment criterion that was imposed during the initial selection of poly-morphic SNPs to be assayed,62 and the subsequent release of the HapMap database primarily focused on SNPs that were common. The fundamental theorem underpinning HapMap is the common disease common variance (CD/CV) hypothesis.63
allow routine identification of geographical regional or village-level ancestries, given a suitably large and carefully collected reference sample.65,66 The 1000 Genomes Project, which aims to provide a whole-genome sequence resource for at least 1,200 individ-uals sampled from multiple population groups glob-ally, will be invaluable for understanding the practical consequences of SNP ascertainment biases.
Thirdly, a SNP with a large difference in allele frequency between populations is a strong candidate to explain large differences in disease prevalence between populations.67,68 This is because disease is tightly linked to survival and reproductive success, and genes responsible for variation in disease should have the most differentiated SNP frequen-cies between human populations. Indeed, studies have suggested that genes associated with complex diseases such as cardiovascular disease and type 2 diabetes have been targets for positive natural selec-tion.69 If disease genes have often been targeted by selection, then identifying loci that have experi-enced selection may aid in disease-related research.68 Further studies are required to determine the extent to which differences in allele frequencies between populations predict disease prevalence differences between populations, however.
The study of population genetic structure between chromosomes is a fundamental issue in population biology because it helps us to obtain a deeper understanding of the ancestral population and associated evolutionary processes. For example, understanding heterogeneity in chromosomal ancestry in an admixed population is important because it can be a confounding factor when vari-ation in admixture levels among individuals across chromosomes causes false-positive associations in genetic association studies. In addition, this analysis can be a source of statistical power for ancestry — phenotype correlation studies that use observed racial/ethnic differences to find mosaic regions of the genome and map loci influencing complex phenotypes.70 The distribution of SNP density along chromosomes will inform us about chromo-somal segments that are more susceptible to selec-tive pressures or differential patterns. Understanding how chromosomal variations in ancestry relate to
disease risk is a major challenge to the biomedical research community.71 Particularly, in the USA, there has been a significant intermixing among racial/ethnic groups, thereby creating a complex pattern of ancestral populations which are a mosaic of multiple continental populations. The develop-ment of population structure adjustdevelop-ment based on chromosome will provide higher-resolution geno-graphic maps and offer investigators designing genetic association studies more powerful tools for detecting stratification.
The final question we need to answer is, what causes population differentiation? Humans have wide altitudinal and latitudinal distribution ranges, and hence, different individuals may face very different environmental constraints and selection pressures. Population differentiation could arise as a result of geographical separation and subsequent drift and/or bottlenecks; natural selection (ie the local adaptation process by which organisms become adapted to their environments); differential admixture with other populations; and ( possibly) different mutation rates (eg differential exposure to ionising radiation, environmental toxins, etc.). A central theme in evolutionary biology is that natural selection acting on heritable phenotypic variation will result in adaptation and differentiation among local populations inhabiting environments differing in their selective regimes.72 Natural selec-tion may confer an adaptive advantage to individ-uals in a specific environment if an allele provides a competitive advantage. Alleles under selection are likely to occur only in those geographical regions where they confer an advantage. Alleles associated with harmful traits decrease in frequency, while those associated with beneficial traits become more common. Local adaptation acting in concert with other processes (eg recombination) is sufficiently pervasive to confound measurements of population differentiation, making a single such genome-wide measurement somewhat unreliable, especially when applied to any specific chromosome or region.
leading to differentiation affect all autosomes equally, except for natural selection, which leads to extreme values that reflect local adaptation due to natural selection. We also note that rather than some ‘normal’ distribution of FST values, with exceptional values occasionally reflecting natural selection, there is substantial inter-chromosomal variation in the inferred patterns and characteristics of population structure. These inter- and intra-chromosomal vari-ations, either across the genome as a whole or along single chromosomes, may directly affect population divergence. This study underlines the potential of chromosome-based analysis of genome-wide data to quantify substructure in populations that might otherwise appear relatively homogeneous. Before embarking on a large-scale genomic study, proper control of chromosome-wise stratification/confound-ing, predicting population memberships is crucial.
Acknowledgments
This work was supported by the National Institutes of Health (grant number K01HL103165). I would like to thank the anonymous reviewer for very constructive and detailed comments.
References
1. Mitchell-Olds, T. and Schmitt, J. (2006), ‘Genetic mechanisms and evol-utionary significance of natural variation inArabidopsis’,NatureVol. 441, pp. 947 – 952.
2. Alonso-Blanco, C. and Koornneef, M. (2000), ‘Naturally occurring vari-ation in Arabidopsis: An underexploited resource for plant genetics’, Trends Plant Sci. Vol. 5, pp. 22 – 29.
3. Risch, N. and Merikangas, K. (1996), ‘The future of genetic studies of complex human diseases’,ScienceVol. 273, pp. 1516 – 1517.
4. Steinmetz, L.M., Mindrinos, M. and Oefner, P.J. (2000), ‘Combining genome sequences and new technologies for dissecting the genetics of complex phenotypes’,Trends Plant Sci.Vol. 5, pp. 397 – 401.
5. Cavalli-Sforza, L.L. and Feldman, M.W. (2003), ‘The application of mol-ecular genetic approaches to the study of human evolution’,Nat. Genet. Vol. 33 (Suppl.), pp. 266 – 275.
6. Garte, S. (2003), ‘Locus-specific genetic diversity between human popu-lations: An analysis of the literature’, Am. J. Hum. Biol. Vol. 15, pp. 814 – 823.
7. Rosenberg, N.A., Pritchard, J.K., Weber, J.L., Cann, HM et al. (2002), ‘Genetic structure of human populations’,ScienceVol. 298, pp. 2381–2385. 8. Bamshad, M., Wooding, S., Salisbury, B.A. and Stephens, J.C. (2004),
‘Deconstructing the relationship between genetics and race’, Nat. Rev. Genet. Vol. 5, pp. 598 – 609.
9. Wright, S. (1951), ‘The genetical structure of populations’,Ann. Eugen. Vol. 15, pp. 323 – 354.
10. Eisen, M.B., Spellman, P.T., Brown, P.O. and Botstein, D. (1998), ‘Cluster analysis and display of genome-wide expression patterns’,Proc. Natl. Acad. Sci .USAVol. 95, pp. 14863 – 14868.
11. Paabo, S. (2003), ‘The mosaic that is our genome’,NatureVol. 421, pp. 409 – 412.
12. Charlesworth, D., Charlesworth, B. and Morgan, M.T. (1995), ‘The pattern of neutral molecular variation under the background selection model’,GeneticsVol. 141, pp. 1619 – 1632.
13. Caron, H., van Schaik, B., van der Mee, M., Baas, F.et al. (2001), ‘The human transcriptome map: Clustering of highly expressed genes in chro-mosomal domains’,ScienceVol. 291, pp. 1289 – 1292.
14. Crawley, J.J. and Furge, K.A. (2002), ‘Identification of frequent cytoge-netic aberrations in hepatocellular carcinoma using gene-expression microarray data’,Genome Biol. Vol. 3, p. RESEARCH0075.
15. Husing, J., Zeschnigk, M., Boes, T. and Jockel, K.H. (2003), ‘Combining DNA expression with positional information to detect functional silencing of chromosomal regions’,BioinformaticsVol. 19, pp. 2335– 2342.
16. Kano, M., Nishimura, K., Ishikawa, S., Tsutsumi, S. et al. (2003), ‘Expression imbalance map: A new visualization method for detection of mRNA expression imbalance regions’, Physiol. Genomics Vol. 13, pp. 31 – 46.
17. Pollack, J.R., Sorlie, T., Perou, C.M., Rees, C.A. et al. (2002), ‘Microarray analysis reveals a major direct role of DNA copy number alteration in the transcriptional program of human breast tumors’,Proc. Natl. Acad. Sci. USAVol. 99, pp. 12963 – 12968.
18. Levin, A.M., Ghosh, D., Cho, K.R. and Kardia, S.L. (2005), ‘A model-based scan statistic for identifying extreme chromosomal regions of gene expression in human tumors’, Bioinformatics Vol. 21, pp. 2867 – 2874.
19. Smith, J.M. and Haigh, J. (1974), ‘The hitch-hiking effect of a favourable gene’,Genet. Res.Vol. 23, pp. 23 – 35.
20. Grimwood, J., Gordon, L.A., Olsen, A., Terry, A. et al. (2004), ‘The DNA sequence and biology of human chromosome 19’,NatureVol. 428, pp. 529 – 535.
21. Plagnol, V. and Wall, J.D. (2006), ‘Possible ancestral structure in human populations’,PLoS Genet.Vol. 2, p. e105.
22. Hey, J. and Nielsen, R. (2004), ‘Multilocus methods for estimating popu-lation sizes, migration rates and divergence time, with applications to the divergence ofDrosophila pseudoobscuraandD. persimilis’,GeneticsVol. 167, ppp.747 – 760.
23. HapMap (2007), ‘A second generation human haplotype map of over 3.1 million SNPs’,NatureVol. 449, pp. 851 – 861.
24. Hoehe, M.R., Timmermann, B. and Lehrach, H. (2003), ‘Human inter-individual DNA sequence variation in candidate genes, drug targets, the importance of haplotypes and pharmacogenomics’, Curr. Pharm. Biotechnol.Vol. 4, pp. 351 – 378.
25. HapMap (2005), ‘A haplotype map of the human genome’,NatureVol. 437, pp. 1299 – 1320.
26. Patterson, N., Price, A.L. and Reich, D. (2006), ‘Population structure and eigenanalysis’,PLoS Genet. Vol. 2, p. e190.
27. Rohlf, F.J. (2002), NTSYS-pc: Numerical taxonomy and multivariate analysis system, ver.2.11f, Exeter Software, New York, NY.
28. Mantel, N. (1967), ‘The detection of disease clustering and a generalized regression approach’,Cancer Res. Vol. 27, pp. 209 – 220.
29. Rechner, A. (2002), Methods of Multivariate Analysis, John Wiley and Sons, New York, NY, pp. 270 – 321.
30. Johnson, R.A. and Wichern, D.W. (1998), Applied Multivariate statistical Analysis(4th edn), Prentice Hall, Upper Saddle River, NJ.
31. SAS (2004), SAS Version 9.1, SAS Institute, Cary, NC.
32. Hair, J.F., Anderson, R.E., Tatham, R.L. and Black, WC. (1998), Multivariate Data Analysis (5th edn), Macmillan Publishing Company, New York, NY.
33. Ganter, B. and Giroux, C.N. (2008), ‘Emerging applications of network and pathway analysis in drug discovery and development’,Curr. Opin. Drug Discov. Devel.Vol. 11, pp. 86 – 94.
34. Keinan, A., Mullikin, J.C., Patterson, N. and Reich, D. (2009), ‘Accelerated genetic drift on chromosome X during the human dispersal out of Africa’,Nat. Genet.Vol. 41, pp. 66 – 70.
36. Hammer, M.F., Mendez, F.L., Cox, M.P., Woerner, A.E.et al. (2008), ‘Sex-biased evolutionary forces shape genomic patterns of human diver-sity’,PLoS Genet.Vol. 4, p. e1000202.
37. Greenwood, T.A., Rana, B.K. and Schork, N.J. (2004), ‘Human haplo-type block sizes are negatively correlated with recombination rates’, Genome Res. Vol. 14, pp. 1358 – 1361.
38. Wright, S. (1978), Evolution and the Genetics of Populations, Vol. 4: Variability Within and Among Natural Populations, University of Chicago Press; Chicago, IL, pp. 1 – 573.
39. Weir, B.S. and Hill, W.G. (2002), ‘Estimating F-statistics’, Annu. Rev. Genet.Vol. 36, pp. 721 – 750.
40. Nei, M. (1987),Molecular Population Genetics, Columbia University Press, New York, NY.
41. Cavalli-Sforza, L., Menozzi, P. and Piazza, A. (1994), The History and Geography of Human Genes, Princeton University Press, Princeton, NJ. 42. Deka, R., Shriver, M.D., Yu, L.M., Ferrell, R.E.et al. (1995),
‘Intra-and inter-population diversity at short t‘Intra-andem repeat loci in diverse populations of the world’,ElectrophoresisVol. 16, pp. 1659 – 1664. 43. Hey, J., Won, Y.J., Sivasundar, A., Nielsen, R. et al. (2004), ‘Using
nuclear haplotypes with microsatellites to study gene flow between recently separated cichlid species’,Mol. Ecol.Vol. 13, pp. 909 – 919. 44. Barbujani, G. (2005), ‘Human races: Classifying people vs understanding
diversity’,Curr. GenomicsVol. 6, pp. 215 – 226.
45. Witherspoon, D.J., Wooding, S., Rogers, A.R., Marchani, E.E. et al. (2007), ‘Genetic similarities within and between human populations’, GeneticsVol. 176, pp. 351 – 359.
46. Kiambi, D., Newbury, H.J., Ford-Lloyd, B.V. and Dawson, I. (2005), ‘Contrasting genetic diversity amongOryza longistaminata (A. Chev et Roehr) populations from different geographic origins using AFLP’, Afr. J. Biotechnol. Vol. 4, pp. 308 – 317.
47. Stevens, V.M., Pavoine, S. and Baguette, M. (2010), ‘Variation within and between closely related species uncovers high intra-specific variability in dispersal’,PLoS OneVol. 5, p. e11123.
48. Lewontin, R.C. (1972), ‘The apportionment of human diversity’, Evol.Biol. Vol. 6, pp. 381 – 398.
49. Baye, T.M. (2004), Genetic Diversity Analyses in Populations of Vernonia galamensis, Cuvillier Verlag, Go¨ttingen, Germany, p. 170.
50. Jorde, L.B. and Wooding, S.P. (2004), ‘Genetic variation, classification and ‘race’’,Nat. Genet.Vol. 36, pp. S28 – S33.
51. Kachigan, S. (1991), Multivariate Statistical Analysis, Radius Press, New York, NY.
52. Zar, J. (1999), Biostatistical Analysis (4th edn), Prentice Hall, Upper Saddle River, NJ.
53. Qin, H., Morris, N., Kang, S.J., Li, M.et al. (2010), ‘Interrogating local population structure for fine mapping in genome-wide association studies’,BioinformaticsVol. 26, pp. 2961 – 2968.
54. Thomas, J.H. (1993), ‘Thinking about genetic redundancy’, Trends Genet. Vol. 9, pp. 395 – 399.
55. Becquet, C., Patterson, N., Stone, A.C., Przeworski, M.et al. (2007), ‘Genetic structure of chimpanzee populations’, PLoS Genet. Vol. 3, p. e66.
56. Casa, A.M., Pressoir, G., Brown, P.J., Mitchell, S.E. et al. (2008), ‘Community resources and strategies for association mapping in sorghum’,Crop Sci.Vol. 48, pp. 30 – 40.
57. Gardner, M., Williamson, S., Casals, F., Bosch, E.et al. (2007), ‘Extreme individual marker F(ST )values do not imply population-specific selection in humans: The NRG1 example’,Hum. Genet. Vol. 121, pp. 759 – 762. 58. Monreal, A.W., Zonana, J. and Ferguson, B. (1998), ‘Identification of a
new splice form of the EDA1 gene permits detection of nearly all X-linked hypohidrotic ectodermal dysplasia mutations’, Am. J. Hum. Genet. Vol. 63, pp. 380 – 389.
59. Sabeti, P.C., Varilly, P., Fry, B., Lohmueller, J. et al. (2007), ‘Genome-wide detection and characterization of positive selection in human populations’,NatureVol. 449, pp. 913 – 918.
60. Yan, M., Wang, L.C., Hymowitz, S.G., Schilbach, S. et al. (2000), ‘Two-amino acid molecular switch in an epithelial morphogen that regu-lates binding to two distinct receptors’,ScienceVol. 290, pp. 523 – 527.
61. Nan, H., Kraft, P., Hunter, D.J. and Han, J. (2009), ‘Genetic variants in pigmentation genes, pigmentary phenotypes, and risk of skin cancer in Caucasians’,Int. J. CancerVol. 125, pp. 909 – 917.
62. Clark, A.G., Hubisz, M.J., Bustamante, C.D., Williamson, S.H. et al. (2005), ‘Ascertainment bias in studies of human genome-wide poly-morphism’,Genome Res. Vol. 15, pp. 1496 – 1502.
63. Reich, D.E. and Lander, E.S. (2001), ‘On the allelic spectrum of human disease’,Trends Genet.Vol. 17, pp. 502 – 510.
64. Lowry, D.B. (2010), ‘Landscape evolutionary genomics’,Biol. Lett. Vol. 6, pp. 502 – 504.
65. Wall, J.D., Cox, M.P., Mendez, F.L., Woerner, A.et al. (2008), ‘A novel DNA sequence database for analyzing human demographic history’, Genome Res.Vol. 18, pp. 1354 – 1361.
66. Miller, R.D., Phillips, M.S., Jo, I., Donaldson, M.A. et al. (2005), ‘High-density single-nucleotide polymorphism maps of the human genome’,GenomicsVol. 86, pp. 117 – 126.
67. Myles, S., Hradetzky, E., Engelken, J., Lao, O.et al. (2007), ‘Identification of a candidate genetic variant for the high prevalence of type II diabetes in Polynesians’,Eur. J. Hum. Genet. Vol. 15, pp. 584 – 589.
68. Ayodo, G., Price, A.L., Keinan, A., Ajwang, A. et al. (2007), ‘Combining evidence of natural selection with association analysis increases power to detect malaria-resistance variants’,Am. J. Hum. Genet. Vol. 81, pp. 234 – 242.
69. Myles, S., Davison, D., Barrett, J., Stoneking, M. et al. (2008), ‘Worldwide population differentiation at disease-associated SNPs’,BMC Med. GenomicsVol. 1, p. 22.
70. Redden, D.T., Divers, J., Vaughan, L.K., Tiwari, H.K. et al. (2006), ‘Regional admixture mapping and structured association testing: Conceptual unification and an extensible general linear model’, PLoS Genet.Vol. 2, p. e137.
71. Campbell, C.D., Ogburn, E.L., Lunetta, K.L., Lyon, H.N.et al. (2005), ‘Demonstrating stratification in a European American population’,Nat. Genet.Vol. 37, pp. 868 – 872.
72. Linhart, Y. and Grant, M. (1996), ‘Evolutionary significance of local genetic differentiation in plants’,Annu. Rev. Ecol. Syst. Vol. 27, pp. 237–277. 73. Erksson, L., Johansson, E. and Kettaneh-Wold, N. (2001), Multi- and
Megavariate Analysis(Umetrics, Umea, Sweden).
74. McKeigue, P.M. (1998), ‘Mapping genes that underlie ethnic differences in disease risk: Methods for detecting linkage in admixed populations, by conditioning on parental admixture’,Am. J. Hum. Genet. Vol. 63, pp. 241 – 251.
75. Raponi, M., Belly, R.T., Karp, J.E., Lancet, J.E. et al. (2004), ‘Microarray analysis reveals genetic pathways modulated by tipifarnib in acute myeloid leukemia’,BMC CancerVol. 4, p. 56.
76. Shriner, D., Baye, T.M., Padilla, M.A., Zhang, S. et al. (2008), ‘Commonality of functional annotation: A method for prioritization of candidate genes from genome-wide linkage studies’, Nucleic Acids Res. Vol. 36, p. e26.
Appendix 1
Principal component analysis (PCA)
(AK) loading matrix, P’, where A is the number of PCs, plus a (NK) ‘noise’ matrix of residuals E.
X¼TP0þE¼X
A
a¼1
tap0aþE;
where T is the score matrix summarising the X-variables and P0 is the loading matrix showing the influence of the variables on the projection model. E is the residual matrix expressing the deviations between the original values and the projections. In general, PCA transforms a number of correlated allele frequencies into a smaller number of uncorrelated synthetic variables, or PCs.
Cluster analysis (CA)
For the HapMap SNP dataset that was found to be polymorphic among CEU, CHB, JPT and YRI samples, Pearson correlation coefficients were com-puted for the 210 individuals. The individuals were then grouped by a hierarchical clustering algorithm using the average linkage method, which was implemented using NTSYS v2.1 software.27 The genetic distance between each pair of individ-uals, m and m0, was summarised by the allele-sharing method, D(m,m0), as follows:
Dðm;m0Þ ¼ 1
l Xl
i¼1 dðm;m0Þ
where l is the number of loci for which both indi-viduals have been tested.
Discriminant function analysis
Discriminant functions based on population group-ing were obtained by the stepwise inclusion of SNPs to minimise Wilks’ lambda (l) between groups, as described by Rechner29 and as follows: L¼b1x1þ b2x2þb3x3. . .þbzxz; where x1 through xz rep-resent the various predictor variables (SNPs); b1 through bz represent the weight associated with each of the predictor variables; and L is the object’s resultant qualitative discrimination score, with a cut-off score to assign objects to one group or another. Objects with L.X are assigned to one
group, and those with L,X are assigned to another group,51 based on allele frequency differ-ences. L represents classifying variables.
Fixation index (FST) estimates between populations
Global FSTvalues for pairwise population compari-sons were calculated using genome-wide SNP allele frequency variances estimated from the unrelated individuals in each HapMap population (CEU, CHB, JPT and YRI), following Wright.9 The formula used was as follows:
FSTðglobal genome wideÞ¼
Pm i¼1
Pið1PiÞ Fi
Pm
i¼1
Pið1PiÞ
where pi* is the average allele frequency (over all populations) of the i-th allele, m is the number of alleles and Fi is the value of FST for each allele. SNP-specific FST measures of population genetic differentiation based on allele frequencies in two populations, a metric of variation within a popu-lation versus between popupopu-lations, are outlined below, following McKeigue.74 In this formula, p1 and p2 denote the frequencies of a particular allele in population 1 and population 2, respectively.
FSTðindividual SNPÞ¼
ðP1P2Þ 2
ðP1þP2Þð2P1P2Þ
Candidate genes are eligible for network generation if there is at least one wild-type IPKB interacting mol-ecule. Based on the information available for eligible candidate genes (focus genes), IPA further constructs networks by maximising the number of focus genes and their inter-connectivity within the limit of 35 molecules per network. Note that additional highly connected non-focus molecules are also included. Finally, for each network, a right-tailed Fisher exact test is implemented to evaluate how likely it is that the focus genes it contains might be found together by chance. Only those networks with a score ( – log[p value]) greater than three were considered as significant.75 In addition, networks might be inter-connected (ie sharing at least one molecule), which strengthens the importance for the under-lying biological functions. Networks are graphically represented by nodes with various shapes (accord-ing to the molecule type) and edges (accord(accord-ing to their biological relationships).
Figure S2. Unweighted pair-group method analysis dendrogram (a branching diagram used to show the relationships between members of a group) based on average taxonomic distance matrices among population means of HapMap SNP datasets. The cluster analysis (CA; constructed from principal components) for the mean of 210 individuals indicates the distance at which the various groups are formed and join together. CA, which is based on the means for all individuals from each geographical origin, was used to obtain similarities among individuals according to their correlation measures across all SNP datasets. Branch height represents dissimilarity. Note that, compared with YRI and CEU branch height, the CHB and JPT branch height is much shorter, representing that the genetic distance between these two populations is relatively close.
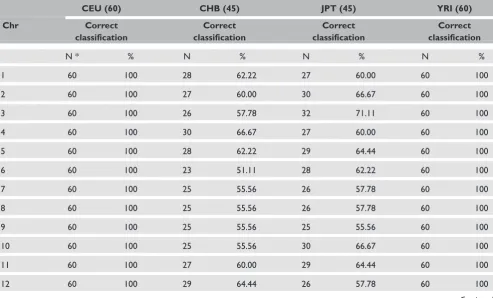
Table S1. Discriminant analysis classification accuracy and associated percentage across the genome and population. Correct and
misclassification of CHB and JPT individuals to their correct geographical region of origin differs for each chromosome. For example, correct classification to their regions of origin for CHB individuals range from 23 per cent (for Chr 6) to 33 per cent (for Chr X and Chr 22).
CEU (60) CHB (45) JPT (45) YRI (60)
Chr Correct
classification
Correct classification
Correct classification
Correct classification
N * % N % N % N %
1 60 100 28 62.22 27 60.00 60 100
2 60 100 27 60.00 30 66.67 60 100
3 60 100 26 57.78 32 71.11 60 100
4 60 100 30 66.67 27 60.00 60 100
5 60 100 28 62.22 29 64.44 60 100
6 60 100 23 51.11 28 62.22 60 100
7 60 100 25 55.56 26 57.78 60 100
8 60 100 25 55.56 26 57.78 60 100
9 60 100 25 55.56 25 55.56 60 100
10 60 100 25 55.56 30 66.67 60 100
11 60 100 27 60.00 29 64.44 60 100
12 60 100 29 64.44 26 57.78 60 100
Table S1. Continued
CEU (60) CHB (45) JPT (45) YRI (60)
Chr Correct
classification
Correct classification
Correct classification
Correct classification
13 60 100 24 53.33 26 57.78 60 100
14 60 100 26 57.78 32 71.11 60 100
15 60 100 30 66.67 31 68.89 60 100
16 60 100 29 64.44 28 62.22 60 100
17 60 100 29 64.44 29 64.44 60 100
18 60 100 29 64.44 36 80.00 60 100
19 60 100 31 68.89 33 73.33 60 100
20 60 100 29 64.44 25 55.56 60 100
21 60 100 27 60.00 32 71.11 60 100
22 60 100 33 73.33 31 68.89 60 100
X 60 100 33 73.33 32 71.11 60 100
All 60 100 32 71.11 38 84.44 60 100
Mean 60 100 28 62.00 29 64.44 60 100
N*¼number of individuals in each population group, %¼% classification accuracy; CEU¼Caucasian, CHB¼Chinese, JPT¼Japanese, YRI¼Yoruba