The Cryosphere, 7, 515–535, 2013 www.the-cryosphere.net/7/515/2013/ doi:10.5194/tc-7-515-2013
© Author(s) 2013. CC Attribution 3.0 License.
EGU Journal Logos (RGB)
Advances in
Geosciences
Open Access
Natural Hazards
and Earth System
Sciences
Open AccessAnnales
Geophysicae
Open AccessNonlinear Processes
in Geophysics
Open AccessAtmospheric
Chemistry
and Physics
Open AccessAtmospheric
Chemistry
and Physics
Open Access DiscussionsAtmospheric
Measurement
Techniques
Open AccessAtmospheric
Measurement
Techniques
Open Access DiscussionsBiogeosciences
Open Access Open Access
Biogeosciences
Discussions
Climate
of the Past
Open Access Open Access
Climate
of the Past
Discussions
Earth System
Dynamics
Open Access Open Access
Earth System
Dynamics
DiscussionsGeoscientific
Instrumentation
Methods and
Data Systems
Open Access
Geoscientific
Instrumentation
Methods and
Data Systems
Open Access DiscussionsGeoscientific
Model Development
Open Access Open Access
Geoscientific
Model Development
DiscussionsHydrology and
Earth System
Sciences
Open AccessHydrology and
Earth System
Sciences
Open Access DiscussionsOcean Science
Open Access Open Access
Ocean Science
Discussions
Solid Earth
Open Access Open Access
Solid Earth
Discussions
The Cryosphere
Open Access Open Access
The Cryosphere
Discussions
Natural Hazards
and Earth System
Sciences
Open Access
Discussions
Variations in snow and firn chemistry along US ITASE traverses
and the effect of surface glazing
D. A. Dixon1, P. A. Mayewski1, E. Korotkikh1, S. B. Sneed1, M. J. Handley1, D. S. Introne1, and T. A. Scambos2
1Climate Change Institute, School of Earth and Climate Sciences, University of Maine, Orono, ME 04469, USA 2National Snow and Ice Data Center, University of Colorado, Boulder, Colorado 80303, USA
Correspondence to: D. A. Dixon ([email protected])
Received: 2 February 2011 – Published in The Cryosphere Discuss.: 16 March 2011 Revised: 16 February 2013 – Accepted: 19 February 2013 – Published: 26 March 2013
Abstract. This study provides a baseline from which
changes in the chemistry of the atmosphere over Antarc-tica can be monitored under expected warming scenarios and continued intensification of industrial activities in the South-ern Hemisphere. It is the first study to measure more than 25 chemical constituents in the surface snow and firn across extensive regions of Antarctica. We present major ion, trace element, heavy metal, rare earth element and oxygen isotope data from a series of surface snow samples and shallow firn sections collected along four US ITASE traverses across East and West Antarctica. In each sample we measure dissolved concentrations of Na+, K+, Mg2+, Ca2+, Cl−, NO−3, SO2−4 , and MS−using ion chromatography and total concentrations of Sr, Cd, Cs, Ba, La, Ce, Pr, Pb, Bi, U, As, Al, S, Ca, Ti, V, Cr, Mn, Fe, Co, Na, Mg, Li, and K using inductively coupled plasma sector field mass spectrometry (ICP-SFMS). We also measureδ18O by isotope ratio mass spectrometry.
Satellite remote sensing measurements of microwave backscatter and grain size are used to assist in the identifi-cation of glaze/dune areas across Antarctica and determine if these areas can possibly contain useful chemical climate records. The majority of the non-glaze/dune samples in this study exhibit similar, or lower, concentrations to those from previous studies. Consequently, the results presented here comprise a conservative baseline for Antarctic surface snow chemical concentrations.
The elements Cd, Pb, As and Bi are enriched across Antarctica relative to both ocean and upper crust elemental ratios. Local and global volcanic outgassing may account for the majority of the Bi measured in East and West Antarc-tica and for a significant fraction of the Cd and As. However, significant concentrations of Cd, Pb, and As remain across much of Antarctica.
1 Introduction
Deep ice cores from the high latitudes of both hemispheres provide us with valuable archives of past climate (Mayewski et al., 1993; Jouzel et al., 1989), but the chemical proxies that they contain must be interpreted in the context of their geographic location. For example, in Antarctica, the individ-ual climate records contained in the Byrd and Taylor Dome deep ice cores do not necessarily reflect past conditions over the entire continent (Masson et al., 2000). There is consid-erable spatial variability between these deep-ice-core sites. Over-snow traverses, such as those conducted by the Inter-national Trans-Antarctic Scientific Expedition (Mayewski et al., 2005), provide us with the opportunity to collect a large number of shallow cores from broad geographic areas. These arrays provide the data needed, at a high enough spatial and temporal resolution, to form a more accurate assessment of the regional chemical and climate differences between deep core sites (Dixon et al., 2011; Kaspari et al., 2004; Bertler et al., 2005). This study presents chemistry data from shallow firn cores/snow pits (hereafter referred to as firn sections), and surface snow samples collected along the US ITASE-2002/2003 Byrd to South Pole traverse (ITASE-02), the US ITASE-2003/2004 South Pole to Taylor Dome traverse (ITASE-03), and the US ITASE-2006/2007 and 2007/2008 Taylor Dome to South Pole traverses (ITASE-06/07). We use these data to determine the spatial variability of chemical de-position over extensive and highly inaccessible areas of the Antarctic continent (Fig. 1).
Since the very earliest trans-Antarctic expeditions, glaze/dune areas have been reported on the East Antarc-tic plateau (Lister and Pratt, 1959; Black and Budd, 1964), characterized by extremely low accumulation (Picciotto et al., 1970) and extensively recrystallized snow (Giovinetto,
Daniel Dixon – Surface Snow – Revised Manuscript 30 1
Figure 1. Polar stereographic map of Antarctica showing the location of surface snow 2
samples and firn sections used in this study. Map also shows the location of known 3
glaze/dune regions. WAIS = West Antarctic Ice Sheet; EAIS = East Antarctic Ice Sheet. 4
Map created using the RAMP DEM (Liu et al., 2001). 5
6 7
8 9 10
11 12 13 14
15 16
Fig. 1. Polar stereographic map of Antarctica showing the location of surface snow samples and firn sections used in this study. Map also
shows the location of known glaze/dune regions. WAIS = West Antarctic Ice Sheet; EAIS = East Antarctic Ice Sheet. Map created using the RAMP digital elevation model (Liu et al., 2001).
1963). However, it was not until the modern satellite remote sensing era that the full extent of these features became ap-parent. Swithinbank (1988) coined the term “megadunes” for large fields of dune-like features typical of the East Antarc-tic plateau. These fields cover more than 500 000 km2 of the Antarctic ice sheet surface (Fahnestock et al., 2000). Megadunes typically have amplitudes of only a few meters, wavelengths of a few kilometers, and parallel crests (which can extend more than 100 km) oriented perpendicular to the regional katabatic wind direction (Frezzotti et al., 2002b). The leeward slope of each megadune consists of a glazed sur-face representing a long-term accumulation hiatus, while the windward slope is covered with accumulation–redistribution features in the form of severe sastrugi up to 1.5 m high (Frez-zotti et al., 2002b). Other glazed (non-megadune) surfaces, representing areas of nil or slightly negative snow accumula-tion, are also observed across extensive regions of the plateau (Watanabe, 1978; Goodwin, 1990; Frezzotti et al., 2002a). In this study we use an outline map from Bohlander and Scam-bos (2005) as a first step to determine which of our samples come from known Antarctic glaze/dune regions (Fig. 1). We then use analysis of our chemical profiles to further infer sur-face conditions along our traverse routes.
1.1 Traverse routes
The ITASE-02 traverse departed Byrd Surface Camp, West Antarctica (80◦S, 120◦W) on 7 December 2002, and
progressed southward (Fig. 1), through the Transantarctic Mountains at the location known as the “Bottleneck”, pass-ing South Pole Station on 1 January 2003, ultimately endpass-ing up at a location∼100 km beyond the South Pole in the di-rection of the Pole of Inaccessibility on the East Antarctic plateau (89◦S, 60◦E) by 4 January 2003.
The ITASE-03 traverse departed the South Pole on 30 November 2003 and proceeded toward the interior of East Antarctica arriving at the Automated Geophysical Observa-tory number 4 (03-2/AGO4, 82◦S, 96.76◦E) on 13 Decem-ber, passing through a glaze/dune area for the last∼400 km of the leg. From 03-2/AGO4, the traverse traveled northward through an extensive glaze/dune area, along the Transantarc-tic Mountain Seismic Experiment (TAMSEIS) sensor line, passing directly through the Megadunes Camp (80.78◦S,
124.49◦E), and finishing up at Taylor Dome (77.78◦S, 158.73◦E) on 20 January 2004.
The first leg of the ITASE-06/07 traverse left Taylor Dome on 13 December 2006 and progressed southward, parallel to and approximately 300 km to the west of the Transantarc-tic Mountains, finishing in the Byrd Glacier drainage on 7 January 2007. The second leg of the ITASE-06/07 traverse
D. A. Dixon et al.: Variations in snow and firn chemistry 517
departed the Byrd Glacier drainage on 17 November 2007 and arrived at the South Pole on 24 December 2007. From 06-4 to 07-3, the 06/07 traverse traveled through the eastern edge of the largest glaze/dune area in East Antarctica.
2 Sampling methodology
Eight firn sections were either drilled or excavated along ITASE-02, six along ITASE-03, and nine along ITASE-06/07 (Table 1). The upper∼1–2.6 m were sampled at each site (because this fragile upper section of the firn is often de-stroyed during transport), and surface snow samples (upper 2 cm) were collected every∼30–50 km along each traverse route (Fig. 1). All samples are analyzed using an ion chro-matograph (IC) for their soluble major ion content (Na+, K+,
Mg2+, Ca2+, Cl−, NO− 3, SO
2−
4 , CH3SO −
3(methylsulfonate:
MS−)). The surface snow samples are additionally analyzed
for their stable oxygen isotopes (δ18O) by isotope ratio mass spectrometry (IRMS). All surface snow samples and several shallow firn sections (02-1, 02-5, South Pole, 03-1, 03-3, 06-2, 07-4, and 07-5; Table 1) are also analyzed for a suite of trace elements (Sr, Cd, Cs, Ba, La, Ce, Pr, Pb, Bi, U, As, Al, Ti, V, Cr, Mn, Fe, Co, and Li) by inductively coupled plasma sector field mass spectrometry (ICP-SFMS). The ICP-SFMS also measures the total Na, K, Mg, Ca, and S concentrations in each sample. The accuracy and precision of our IC, IRMS, and ICP-SFMS systems are discussed in more detail by Os-terberg et al. (2006).
Lack of accumulation and extensive firn diagenesis at any site exhibiting glazed characteristics likely precludes that site from containing an easily interpreted, annually resolved cli-mate record (Albert et al., 2004; Fahnestock et al., 2000). In addition, the unknown length of hiatus, possibly rang-ing from decades to centuries (Scambos and Bauer, 2006), represented by each glazed surface presents a problem for a temporally consistent surface snow sampling scheme across the continent. The majority of our surface snow samples and firn sections are collected in positive accumulation areas and therefore represent chemical concentrations typical of sum-mer seasonal precipitation and multi-year averages, respec-tively (as discussed later). To minimize the possible concen-tration effects caused by glaze/dune hiatus surfaces, we only collected our surface samples from accumulating snow drifts at all collection sites.
All sample-processing personnel wore non-particulating Tyvek suits, clean plastic gloves, and dust masks. The sur-face snow samples were collected wearing the same protec-tive gear and always>100 m upwind of the traverse vehicles. Samples were only collected if the traverse vehicles could be determined not to have introduced any local contamina-tion. All the ITASE-02 and ITASE-03 surface snow samples for major ion, stable isotope and trace element analysis were collected from the top 2 cm of a loosely consolidated, fresh snowdrift and transferred into two new Whirl-Pak bags
us-ing a deionized-ultra-pure-water (DI)-cleaned plastic scoop. The bags were immediately sealed and stored at –20◦C. The
ITASE-06/07 surface snow samples for major ion and sta-ble isotope analysis were also collected using this method. However, the ITASE-06/07 surface snow samples for trace element analysis were collected directly into acid-cleaned 60 mL polypropylene Nalgene wide mouth jars and stored at –20◦C. No apparent difference in results was detected be-tween the two analytical sampling plans. See supplemental sections S1 and S2 for more information
2.1 Flux vs. concentration
Ideally, we would view these data as chemical flux. However, it would not be accurate to correct these surface snow chemi-cal concentration data for flux, because we do not know when the precipitation occurred or its volume. As a flux correc-tion “experiment”, we calculate accumulacorrec-tion rates along the traverse routes using a compilation of net surface mass bal-ance data from Vaughan et al. (1999). We use these accumu-lation values to apply a flux correction to the surface snow major ion concentration data (Fig. 2). We must note, how-ever, that calculating the flux from a compilation of net sur-face mass balance data is not the ideal method. However, it is the best we can do with the current dataset. Of all the ma-jor ion curves, the flux correction only significantly affects the spatial trend of K in all traverse years, the reason being that, spatially, this ion has extremely low concentration vari-ability. After the flux correction, the resulting K curve looks almost identical to the accumulation curve (Fig. 2). The only other change of note occurs in the ITASE-02 SO2−4 and Cl−
curves, with the rise from 02-3 to 02-7 being subdued. The spatial trends of the remaining ions do not change signifi-cantly enough to warrant using the flux correction; i.e., con-centrations of sea-salt ions are already higher near the coast in West Antarctica, and concentrations of all ions still remain high in the glaze/dune areas after the correction. So, for the remainder of this paper we will present and discuss chemical concentrations without a flux correction.
2.2 Sample time periods
Several of the firn cores are sub-annually dated based upon seasonal layers in the major ion time series. We approxi-mately date the remaining firn sections using a firn densifi-cation depth–age model. We estimate accumulation rates for the model based upon nearby sub-annually dated cores com-bined with a net surface mass balance model (Vaughan et al., 1999). We use three different time periods from which to calculate the mean, and mean+/–1 standard deviation con-centrations in the firn sections: 2000–2006 for all the major ion data, 2000–2006 for the ITASE-06/07 ICP-SFMS data, and 1955–1975 for the ITASE-02 and ITASE-03 ICP-SFMS data. These time periods are chosen to best cover the existing overlap of firn chemistry data from each respective traverse.
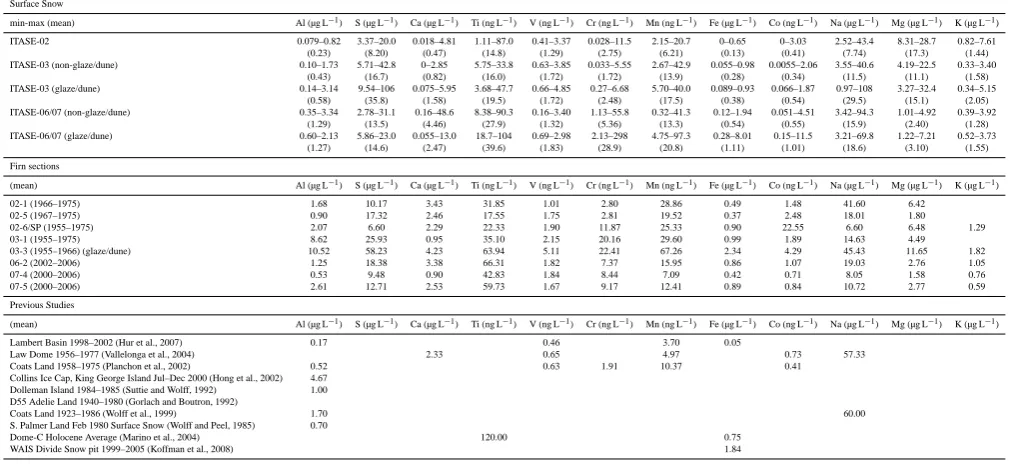
Table 1. Information for each ice core used in this study. Accumulation = mean annual accumulation; resolution = sampling resolution;a
values in brackets correspond to the firn sections used for ICP-SFMS analysis;bvalues in brackets are estimates;cno ICP-SFMS K analyses; dno ICP-SFMS K or Li analyses;ethe top 2.1 m of this core were not collected, no IC cation analyses;fno K values are reported for the upper portion of this firn section. The 1995–1985 period was used to calculate the K mean value and standard deviation.
Location Latitude Longitude Elevation Deptha Accumulationb Age of Sectiona Time Period Useda Resolutiona (°N) (◦E) (m) (m) (g cm−2yr−1) (Years AD) (Years AD) (cm)
ITASE-02
02-Byrd –80.009300 –119.424900 1530 0–1 (11) 2003–1998 2003–2000 2.3 02-1c –82.000990 –110.008160 1746 0–1.8 (0.8–12.4) 19 2003–1998 (2001–1966) 2003–2000 (1975–1966) 4 (2.0–4.0) 02-2 –83.500781 –104.986806 1957 0–1.5 (19) 2003–1999 2003–2000 4 02-3 –85.000451 –104.995312 2396 0–1.7 (15) 2003–1999 2003–2000 4 02-4 –86.502500 –107.990313 2586 0–1.8 11 2003–1998 2003–2000 4.1 02-5d –88.002153 –107.983333 2747 0–1.9 (1.1–9.1) (11) 2003–1996 (1998–1967) 2003–2000 (1975–1967) 4.2 (1.7–2.3) 02-6/South Pole –89.933250 144.393833 2808 0–2 (0.9–17.7) (8) 2003–1991 (1997–1911) 2003–2000 (1975–1955) 2 (1.4–1.8) 02-7 –88.998900 59.974400 3000 0–1.7 8 2003–1993 2003–2000 2
ITASE-03
03-1d –86.840000 95.310000 3124 0–2.5 (2.5–21.2) 5 2004–1983 (1983–1768) 2004–2000 (1975–1955) 2 (1.4–2.9) 03-2/AGO 4 –82.010000 96.760000 3569 0–1.9 (3) 2004–1981 2004–2000 1.3
03-3e –82.080000 101.960000 3444 2.1–15 (2.1–15) 3 1966–1737 (1966–1737) 1966–1955 (1966–1955) 1.5–2.5 (1.5–2.5) 03-4 –81.650000 122.600000 2966 0–1.9 (3) 2004–1981 2004–2000 1.2
03-5f –80.780000 124.490000 2923 0–2.1 (3) 2004–1979 2004–2000 2.0 03-6 –80.390000 138.920000 2393 0–1 (3) 2004–1992 2004–2000 1.6
ITASE-06
06-1/Taylor Dome –77.880222 158.458222 2365 0–1.1 (11) 2007–2002 2006–2002 1.6 06-2 –77.781070 152.370500 2277 0–1.2 (0–1.2) (11) 2007–2002 (2007–2002) 2006–2002 (2006–2002) 1 (1) 06-3 –79.036200 149.680300 2241 0–2.1 (11) 2007–2000 2006–2000 1.2–1.3 06-4 –80.308770 144.691980 2199 0–1.6 (8) 2007–1998 2006–2000 1.4
ITASE-07
07-1 –81.658000 136.084000 2450 0–1.7 (8) 2008–1998 2006–2000 2 07-2 –84.395070 140.630800 2645 0-1.7 (8) 2008–1998 2006–2000 1.5 07-3 –85.781889 145.719484 2817 0–2.1 (8) 2008–1995 2006–2000 1.8–2.3 07-4 -88.509530 178.530790 3090 0-2.6 (0-1.4) (8) 2008–1992 (2008–2000) 2006–2000 (2006–2000) 1.2–1.5 (1.2) 07-5 –89.782080 171.431810 2808 0–2.2 (0–1.7) (8) 2008–1994 (2008–1998) 2006–2000 (2006–2000) 1.2–1.7 (1.2)
Not all firn sections wholly cover the chosen time periods, but all sections cover a minimum of at least three full years of data (see Table 1 for detailed info).
To characterize environmental conditions, we measure a set of physical parameters in addition to the chemistry at each sampling site (Fig. 3). The physical measurements are the following: mean annual accumulation, calculated from the Vaughan et al. (1999) compilation of net surface mass balance; surface elevation, measured in the field by our on-board GPS system (Hamilton and Spikes, 2004); mean an-nual temperature, calculated from an Antarctic compilation map created using a combination of instrumental mean an-nual temperatures and 10 m downhole temperatures (Dixon, 2008); RADARSAT-I Antarctic Mapping Project (RAMP) microwave backscatter (Jezek, 1999; Jezek et al., 2002) and Moderate-resolution Imaging Spectroradiometer (Kaufman et al., 1998; Justice et al., 2002) Mosaic of Antarctica (MOA) grain size measurements (Haran et al., 2005; Scambos et al., 2007). The RAMP measurements are extracted from the Antarctic Imaging Campaign-I (AIC-I) dataset. RAMP backscatter values, in decibels, represent the 1997 October mean normalized to an incidence angle of 27◦(the center of the beam used most often in the RAMP 1997 AIC-I). The MOA snow grain size data are the mean optical grain size measurements, in microns, from 5 November to 15 Decem-ber 2003.
3 Results and discussion
3.1 Physical parameters
Examination of each set (ITASE-02, -03, and -06/07) of physical traverse data (as described above) in addition to the
δ18O as measured in the surface snow samples (Fig. 3) re-veals a strong similarity betweenδ18O, accumulation, eleva-tion (inverse) and mean annual temperature, as expected. For ITASE-02, the backscatter curve exhibits significant variabil-ity but no strong trend (Fig. 3). For ITASE-03, backscatter and grain size increase towards the interior of East Antarc-tica and are highest in the glaze/dune area between 03-2 and 03-6 (Fig. 3). The ITASE-06/07 backscatter and grain size are highest between 06-4 and 07-3, which is the part of the traverse that skirts/overlaps a large glaze/dune area (Fig. 3). Although the ITASE-06/07 traverse is only shown to pass through known glaze/dune areas between 06-4 and 07-2 (Fig. 1), we think that this particular route passes through several other glazed, non-dune areas based upon our field ob-servations.
3.2 Seasonality of the samples
As a single summer surface snow sample is likely not repre-sentative of the entire summer period, we apply the following
D. A. Dixon et al.: Variations in snow and firn chemistry 519
Daniel Dixon – Surface Snow – Revised Manuscript 31 1
Figure 2. Surface snow major ion concentration (red) and flux (blue) versus distance for
2
the ITASE-02 (left), ITASE-03 (middle) and ITASE-06/07 (right) traverses. Distances
3
are measured from the beginning of each traverse. Mean annual accumulation (purple) is
4
shown on the K
+plot for comparison. Vertical lines indicate the locations of firn section
5
collection sites along each traverse; B = Byrd; SP = South Pole; TD = Taylor Dome.
6
Large vertical shaded areas behind plots highlight glaze/dune regions. Note that scales
7
may vary between traverse years.
8
9
10
11
12
13
14
15
16
Fig. 2. Surface snow major ion concentration (red) and flux (blue) versus distance for the 02 (left), 03 (middle) and
ITASE-06/07 (right) traverses. Distances are measured from the beginning of each traverse. Mean annual accumulation (purple) is shown on the K+plot for comparison. Vertical lines indicate the locations of firn section collection sites along each traverse: B = Byrd; SP = South Pole; TD = Taylor Dome. Large vertical shaded areas behind plots highlight glaze/dune regions. Note that scales may vary between traverse years.
methodology to assess how representative of typical summer values each surface snow sample is.
High seasonal Na+concentrations in Antarctic ice cores are considered to be a deposition timing indicator of the turbulent winter–spring Antarctic atmosphere (Legrand and Mayewski, 1997). Relative to the seasonal variability of Na+, which is represented in Fig. 4 by the mean+/–1 standard deviation concentrations in the firn sections collected along the traverse routes, the surface snow Na+concentrations are low from Byrd to 03-1. Between 03-2 and 03-6 the surface snow Na+concentrations range between mean and high, rel-ative to the seasonal variability. This is likely a consequence of sampling in glazed/dune areas. Beyond 03-6, the Na con-centrations vary between mean and low values up to Taylor Dome.
Surface snow Na+concentrations along the ITASE-06/07 traverse remain low relative to the seasonal variability from Taylor Dome to South Pole apart from three peaks (3, 06-4, and one between 07-2 and 07-3) exhibiting mean values and a short section between 07-1 and 07-2 where concen-trations are high (Fig. 4). However, all of these higher Na+
concentrations occur in glazed or glaze/dune areas and are not representative of mean summer concentrations.
Peaks in SO2−4 are observed to occur in the sunlit sum-mer months as photosynthetic organisms prosper in the sur-face ocean surrounding Antarctica (Legrand and Mayewski, 1997). Relative to the seasonal variability of SO2−4 concen-trations in the upper meters of firn, the surface snow SO2−4 concentrations start out slightly below mean at Byrd, quickly increasing to high values, and then fluctuating between mean and high values from 02-1 to South Pole to Taylor Dome (Fig. 4). Several exceptionally high values occur between 03-2 and 03-6, a huge East Antarctic glaze/dune area (Fig. 1). The high concentrations observed in the glaze/dune areas are most likely a result of extremely low or slightly negative accumulation in combination with summer influx of fresh SO2−4 to the hiatus surface. Therefore, the surface samples from glaze/dune areas likely represent multi-year concen-trated values.
Along the ITASE-06/07 traverse, surface snow concentra-tions of SO2−4 are around the mean firn level between Tay-lor Dome and 3. In the glaze/dune areas between 06-3 and 07-06-3, surface snow concentrations of SO2−4 are low
Daniel Dixon – Surface Snow – Revised Manuscript 32 1
Figure 3. Surface snow δ
18O, mean annual accumulation, surface elevation, RAMP
2
microwave backscatter, MOA grain size and mean annual temperature versus distance for
3
the ITASE-02 (left), ITASE-03 (middle) and ITASE-06/07 (right) traverses. Distances
4
are measured from the beginning of each traverse. Vertical lines indicate the locations of
5
firn section collection sites along each traverse; B = Byrd; SP = South Pole; TD = Taylor
6
Dome. Large vertical shaded areas behind plots highlight glaze/dune regions.
7
8
9
10
11
12
13
14
15
16
17
18
Fig. 3. Surface snowδ18O, mean annual accumulation, surface elevation, RAMP microwave backscatter, MOA grain size and mean annual
temperature versus distance for the ITASE-02 (left), ITASE-03 (middle) and ITASE-06/07 (right) traverses. Distances are measured from the beginning of each traverse. Vertical lines indicate the locations of firn section collection sites along each traverse: B = Byrd; SP = South Pole; TD = Taylor Dome. Large vertical shaded areas behind plots highlight glaze/dune regions.
compared to mean firn values. This is in contrast to the ITASE-03 glaze/dune samples, which exhibit unusually high values. ITASE-06/07 surface snow SO2−4 concentrations re-turn to mean/high values between 07-4 and South Pole. The surface snow concentration differences between the ITASE-03 and ITASE-06/07 glaze/dune areas may simply be a result of precipitation differences between the traverse years and/or the fact that during the ITASE-03 traverse we pass directly through the center of an extremely well developed glaze/dune field, and during ITASE-06/07 we skirt the periphery of the aforementioned field.
3.3 Major ions
All the major ions, with the exception of K+ and Ca2+,
exhibit lower summer surface snow concentrations in West Antarctica compared to East Antarctic non-glaze/dune areas (Table 2). Non-glaze/dune surface snow Ca2+concentrations exhibit similar concentrations across Antarctica. All major ion surface snow concentrations from glaze/dune areas are above those from non-glaze/dune areas (Table 2). Several of the ITASE-06/07 firn sections display unusually high con-centrations of MS; this is most likely an effect of the exten-sive, glazed, non-dune surfaces along this traverse route.
3.4 ITASE-02 major ions
The chemistry in Antarctic snow arrives in a variety of forms (e.g., aerosols (dry deposition), precipitation (wet deposi-tion), and gases), and each of these arrives via an atmo-spheric transport pathway. For example, SO2−4 and Cl−ions
move through the Antarctic atmosphere via the lower tro-posphere (planetary boundary layer), the upper trotro-posphere (free troposphere), and the stratosphere. They both have mul-tiple sources. Marine biogenic SO2−4 is transported through the lower and upper troposphere, while SO2−4 from volcanic and anthropogenic activity is transported primarily through the stratosphere. Marine Cl− is emitted into the lower tro-posphere where it reacts to form HCL and is further trans-ported through the upper troposphere. Cl− species in the stratosphere also come from volcanic and anthropogenic ac-tivity. For ease of discussion, from this point onward we will refer to the three primary atmospheric transport pathways as follows: stratospheric, upper tropospheric, and lower tropo-spheric.
Examination of the major ions (Na+, K+, Mg2+, Ca2+, Cl−, NO−3, SO2−4 , and MS−)for ITASE-02 (Fig. 4) reveals a decreasing trend for Na+and Mg2+from Byrd to 02-7 and the opposite trend for NO−3. This trend is to be expected for
D. A. Dixon et al.: Variations in snow and firn chemistry 521
Daniel Dixon – Surface Snow – Revised Manuscript 33 1
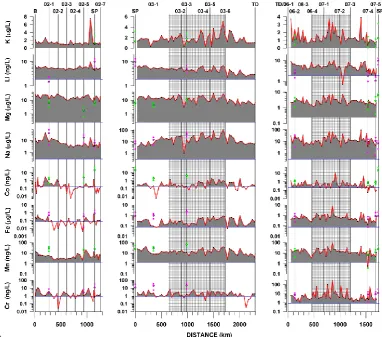
Figure 4. Surface snow major ion concentration versus distance for the ITASE-02 (left),
2
ITASE-03 (middle) and ITASE-06/07 (right) traverses. Distances are measured from the
3
beginning of each traverse. Vertical lines indicate the locations of firn section collection
4
sites along each traverse; B = Byrd; SP = South Pole; TD = Taylor Dome. The three
5
(pink or green) dots in line with each firn collection site indicate the mean (black outline)
6
and +/- 1 standard deviation concentrations in that firn section (if the lower dot is not
7
visible its value is below zero). Large vertical shaded areas behind plots highlight
8
glaze/dune regions. Horizontal (blue) lines signify detection limits. Note that scales may
9
vary between traverse years.
10
11
12
13
14
Fig. 4. Surface snow major ion concentration versus distance for the ITASE-02 (left), ITASE-03 (middle) and ITASE-06/07 (right) traverses.
Distances are measured from the beginning of each traverse. Vertical lines indicate the locations of firn section collection sites along each traverse: B = Byrd; SP = South Pole; TD = Taylor Dome. The three (pink or green) dots in line with each firn collection site indicate the mean (black outline) and+/–1 standard deviation concentrations in that firn section (if the lower dot is not visible, its value is below zero). Large vertical shaded areas behind plots highlight glaze/dune regions. Horizontal (blue) lines signify detection limits. Note that scales may vary between traverse years.
marine-source ions as elevation and distance from the coast increase. The trend in NO−3 is also expected due to its strato-spheric transport pathway. Previous studies by Kreutz and Mayewski (1999) and Bertler et al. (2005) show a similar re-lationship between elevation, accumulation, NO−3, Na+, and Mg2+.
A second mode of behavior is evident in the Cl−, SO2−4 and MS ions (Fig. 4). These ions exhibit high values between Byrd and 02-2, dipping between 02-2 and 02-4, then rising again and remaining high from 02-5 to 02-7 (Fig. 4). SO2−4 and Cl−display this double-peak pattern most strongly, con-firming that their dominant transport pathway is lower tropo-spheric and that they also have an upper tropotropo-spheric trans-port pathway (Legrand and Mayewski, 1997). It is worth
bearing in mind that the chemical concentrations presented here have not been corrected for differences in accumula-tion. As a result, some fraction of the East Antarctic rise in the ITASE-02 SO2−4 and Cl− data may be
accumulation-related. The double-peak structure of the MS signal is some-what weak, with the East Antarctic peak dominated by a sin-gle high value at 02-5. If we ignore the peak at 02-5, as-suming that this single high value may have been caused by an unusually high influx of lower tropospheric air as the sample was collected or by the glaze/dune field in this area, the pattern of ITASE-02 MS concentrations then becomes similar to the marine-source Na+ and Mg2+ ions. K+ ex-hibits very little structure and variability from Byrd to 02-7 (Fig. 4), despite the traverse passing close to the Transantarc-tic Mountains between 02-3 and 02-4 (Fig. 1). Major ion
Table 2. Major ion concentrations for surface snow samples and firn sections.
Surface Snow
min-max (mean) Na (ug L−1) K (ug L−1) Mg (ug L−1) Ca (ug L−1) MS (ug L−1) Cl (ug L−1) NO3(ug L−1) SO4(ug L−1)
ITASE-02 2.89–17.9 (6.38) 3.00–3.95 (3.47) 0.49–2.42 (0.80) 0.71–4.60 (1.69) 3.02–24.3 (10.3) 8.25–40.4 (21.9) 27.6–554 (185) 24.3–95.8 (54.7)
ITASE-03 (non-glaze/dune) 3.64–59.2 (13.6) 3.17–4.72 (3.54) 0.56–5.35 (1.36) 0.58–3.58 (1.60) 6.73–28.2 (13.3) 27.5–307 (90.7) 140–1869 (569) 57.6–194 (107) ITASE-03 (glaze/dune) 10.1–144 (37.3) 3.34–6.77 (3.98) 1.06–21.0 (4.64) 1.07–6.25 (2.24) 8.04–50.5 (21.4) 59.4–381 (164) 262–1330 (685) 81.3–478 (177)
ITASE-06/07 (non-glaze/dune) 1.85–36.3 (10.6) 0.91–1.03 (0.97) 0.68–4.82 (1.60) 0.76–6.09 (1.56) 1.13–52.9 (12.3) 11.1–110 (47.2) 68.4–673 (358) 14.7–140 (65.8) ITASE-06/07 (glaze/dune) 5.06–79.9 (17.7) 0.84–1.95 (1.07) 0.98–8.04 (2.59) 0.98–7.97 (2.16) 4.43–40.6 (12.5) 37.8–185 (108) 116–896 (428) 34.6–119 (72.8)
Firn sections
(mean) Na (ug L−1) K (ug L−1) Mg (ug L−1) Ca (ug L−1) MS (ug L−1) Cl (ug L−1) NO3(ug L−1) SO4(ug L−1)
Byrd (2000–2003) 15.81 1.27 1.73 4.73 8.88 28.97 60.60 37.89
02-1 (2000–2003) 26.62 1.03 3.51 6.03 7.22 47.40 50.39 29.54
02-2 (2000–2003) 19.81 0.80 2.09 6.36 5.10 33.61 45.58 20.64
02-3 (2000–2003) 24.92 4.24 2.14 15.34 7.66 36.95 51.97 34.49
02-4 (2000–2003) 14.62 2.07 4.07 9.42 9.42 31.25 94.11 38.65
02-5 (2000–2003) 10.85 1.06 1.84 6.89 9.51 24.09 105.32 41.13
02-6/SP (2000–2003) 21.78 4.72 8.05 13.84 5.94 39.13 205.04 60.06
02-7 (2000–2003) 17.07 2.12 2.01 8.02 5.37 32.60 144.00 56.83
03-1 (2000–2004) 25.01 3.27 8.26 5.77 74.61 93.08 86.98
03-2/AGO4 (2000–2004) 22.37 2.08 2.79 3.44 7.99 137.08 30.28 97.37
03-3 (1955–1966) 6.88 52.23 19.37 160.97
03-4 (2000–2004) 42.44 2.32 5.59 3.20 4.69 100.03 76.19 112.78
03-5 (2000–2004) 38.59 4.17 5.46 5.64 89.41 286.70 140.26
03-6 (2000–2004) 67.05 2.59 7.71 5.92 156.52 219.63 125.71
06-1/TD (2002–2006) 15.55 4.29 1.88 5.80 38.54 61.17 76.88 47.56
06-2 (2001–2006) 28.41 2.19 4.13 3.18 22.32 77.20 61.10 62.89
06-3 (2000–2006) 30.36 2.55 4.02 10.26 85.96 82.37 49.72 132.43
06-4 (2000–2006) 34.24 2.27 3.85 10.80 67.70 83.07 35.90 121.51
07-1 (2000–2006) 44.73 2.14 7.01 6.93 46.69 87.28 7.95 207.14
07-2 (2000–2006) 40.34 1.95 5.83 7.72 44.91 88.60 36.23 108.14
07-3 (2000–2006) 17.74 1.10 3.36 3.32 15.72 53.16 7.86 117.28
07-4 (2000–2006) 14.69 0.42 2.16 2.50 87.33 37.79 87.05 58.64
07-5 (2000–2006) 13.74 1.34 1.99 3.93 52.54 39.64 108.69 52.20
spatial variability maps in Bertler et al. (2005) exhibit a sim-ilar spatial pattern to the aforementioned ITASE-02 major ions. Ca2+concentrations display the greatest variability and the largest peaks in West Antarctica (Fig. 4). This highlights the variable nature of Ca2+ deposition and emphasizes the fact that a significant percentage of Ca2+reaches Antarctica via the lower troposphere (Dixon et al., 2011).
3.4.1 ITASE-03 major ions
The major pattern in the ITASE-03 major ion chemistry sig-nal occurs in the majority of the ions. The sigsig-nal structures of Na+, Mg2+, Cl−, and SO2−4 exhibit a steady rise from South Pole to 03-2; the rate of rise then increases along with the magnitude of the variability from 03-2 to 03-6. A sud-den drop around 03-6 leads into a steady decline all the way to Taylor Dome (Fig. 4). The grain size (and to a weaker extent backscatter) displays a similar structure (Fig. 3), sug-gestive of a strong positive association between concentra-tion and grain size for Na+, Mg2+, Cl−, and SO2−4 in East Antarctica. Empirical orthogonal function analysis confirms this observation, which highlights the effect of glaze/dune areas on chemistry. MS−and Ca2+also follow this pattern, albeit with a couple of subtle differences. The Ca2+ curve exhibits two distinct peaks between SP and 03-1, and MS−
displays a series of low values between 03-3 and 03-4. The K curve is relatively featureless compared to the other ma-jor ions with only the very largest concentration peaks regis-tering. The structure of the NO−3 signal, which exhibits two large peaks close to South Pole followed by increased vari-ability in the glaze/dune areas without a strong concentration trend (Fig. 4), highlights the strong stratospheric NO−3 source resulting in high concentrations all over East Antarctica. It also draws attention to the increased concentrations near the South Pole, which may be a result of anthropogenic activity around South Pole Station.
3.4.2 ITASE-06/07 major ions
Overall, the ITASE-06/07 major ion signal (Fig. 4) is simi-lar to ITASE-03 in that the majority of the ions exhibit their highest concentrations and maximum variability between 06-4 and 07-3. This coincides with the glaze/dune area, so we can conclude that the widespread hiatus surfaces in this area of East Antarctica act to increase concentrations in the ma-jority of the major ions and at the same time slightly increase
δ18O fractionation (Fig. 3).
D. A. Dixon et al.: Variations in snow and firn chemistry 523
(a)
Daniel Dixon – Surface Snow – Revised Manuscript 34 1
Figure 5a. Surface snow trace element concentration versus distance for the ITASE-02
2
(left), ITASE-03 (middle) and ITASE-06/07 (right) traverses. Distances are measured
3
from the beginning of each traverse. Vertical lines indicate the locations of firn section
4
collection sites along each traverse; B = Byrd; SP = South Pole; TD = Taylor Dome. The
5
three (pink or green) dots in line with each firn collection site indicate the mean (black
6
outline) and +/- 1 standard deviation concentrations in that firn section (if the lower dot is
7
not visible its value is below zero). Large vertical shaded areas behind plots highlight
8
glaze/dune regions. Horizontal (blue) lines signify detection limits. Note that scales may
9
vary between traverse years.
10 11 12 13 14
(b)
Daniel Dixon – Surface Snow – Revised Manuscript 35 1
Figure 5b. Surface snow trace element concentration versus distance for the ITASE-02
2
(left), ITASE-03 (middle) and ITASE-06/07 (right) traverses. Distances are measured
3
from the beginning of each traverse. Vertical lines indicate the locations of firn section
4
collection sites along each traverse; B = Byrd; SP = South Pole; TD = Taylor Dome. The
5
three (pink or green) dots in line with each firn collection site indicate the mean (black
6
outline) and +/- 1 standard deviation concentrations in that firn section (if the lower dot is
7
not visible its value is below zero). Large vertical shaded areas behind plots highlight
8
glaze/dune regions. Horizontal (blue) lines signify detection limits. Note that scales may
9
vary between traverse years.
10 11 12 13 14
Fig. 5. Surface snow trace element concentration versus distance for the ITASE-02 (left), ITASE-03 (middle) and ITASE-06/07 (right)
traverses. Distances are measured from the beginning of each traverse. Vertical lines indicate the locations of firn section collection sites along each traverse: B = Byrd; SP = South Pole; TD = Taylor Dome. The three (pink or green) dots in line with each firn collection site indicate the mean (black outline) and+/–1 standard deviation concentrations in that firn section (if the lower dot is not visible its value is below zero). Large vertical shaded areas behind plots highlight glaze/dune regions. Horizontal (blue) lines signify detection limits. Note that scales may vary between traverse years.
(c)
Daniel Dixon – Surface Snow – Revised Manuscript 36
1
Figure 5c. Surface snow trace element concentration versus distance for the ITASE-02
2(left), ITASE-03 (middle) and ITASE-06/07 (right) traverses. Distances are measured
3from the beginning of each traverse. Vertical lines indicate the locations of firn section
4collection sites along each traverse; B = Byrd; SP = South Pole; TD = Taylor Dome. The
5three (pink or green) dots in line with each firn collection site indicate the mean (black
6outline) and +/- 1 standard deviation concentrations in that firn section (if the lower dot is
7not visible its value is below zero). Large vertical shaded areas behind plots highlight
8glaze/dune regions. Horizontal (blue) lines signify detection limits. Note that scales may
9vary between traverse years.
1011
12
13
14
Fig. 5c. Continued.
3.5 Trace elements
The majority of the mean surface snow trace element con-centration data are at, or below, the multi-year mean values calculated from the firn sections (Fig. 5a, b, and c). This sug-gests that the surface snow concentrations presented here are a conservative estimate of Antarctic values for the majority of the trace elements. Four of the elements (Cs, S, Mg, and K) have no previously published data to compare with (Ta-ble 3); this is because S, Mg, and K are typically measured in their soluble forms by IC and are not often measured in their total form by ICP-SFMS analysis. Previous studies of Cs measure only one isotope,137Cs (Pourchet et al., 1997; Sbrignadello et al., 1994), not total Cs. The measurements of total Cs in this study may be the first analyses of this element conducted over extensive regions of Antarctica.
The mean non-glaze/dune surface snow concentrations for each element for each traverse year reveal that the major-ity (Sr, Ba, La, Ce, Pr, Pb, As, Li, Al, Ca, Ti, Mn, Fe, Co, and Na) are in the region of, or below, concentrations mea-sured in previous studies (Table 3). Cd, Bi, U, V and Cr exhibit non-glaze/dune concentrations between two and five
times higher than previous studies in one or more traverse years (Table 3). The elevated ITASE-06/07 values are likely a consequence of the traverse’s route over extensive, glazed, non-dune areas and proximity to the Transantarctic Moun-tains (Fig. 1). The ITASE-06/07 samples likely contain a greater proportion of dust than the 02 and ITASE-03 samples as evidenced by higher concentrations of the dust “signature” elements Cs, U, Al, Ca, Ti, and Fe (Ta-ble 3). There are likely two factors responsi(Ta-ble for the el-evated ITASE-03 values in Table 3: the first is the exten-sive, glazed (low-accumulation/hiatus), non-dune areas oc-curring throughout the East Antarctic plateau; the second is the large station-associated concentration peak between South Pole and 03-1 that drives up the non-glaze/dune val-ues considerably (Fig. 5a, b, and c). Bi is unusual because it is the only element in our surface snow samples to exhibit elevated values, relative to previous studies, in all traverse years (Table 3). The most likely reason for this is that all of our surface snow samples were collected on the East and West Antarctic plateaus. The previous studies, to which we are comparing our samples, are all coastally located sites. In Antarctica, the primary source of Bi during interglacial
D. A. Dixon et al.: Variations in snow and firn chemistry 525
Table 3. Trace element concentrations for surface snow samples, firn sections and from previous studies.
Surface Snow
min-max (mean) Sr (ng L−1) Cd (ng L−1) Cs (ng L−1) Ba (ng L−1) La (ng L−1) Ce (ng L−1) Pr (ng L−1) Pb (ng L−1) Bi (ng L−1) U (pg L−1) As (ng L−1) Li (ng L−1) ITASE-02 0.67–33.0 0–2.90 0–0.14 0–76.6 0.024–0.66 0.030–1.41 0.0042–0.17 0.39–8.60 0–1.14 0–65.5 0.092–2.08 4.40–9.75 (4.51) (0.32) (0.043) (10.1) (0.18) (0.35) (0.045) (3.05) (0.17) (30.2) (0.54) (5.48) ITASE-03 (non-glaze/dune) 1.55–37.0 0.017–1.13 0.058–0.51 0.78–20.2 0.18–1.64 0.27–4.19 0.017–0.38 0.69–24.3 0.0021–0.86 16.9–244.8 0.39–8.15 2.26–6.93
(10.6) (0.27) (0.16) (5.67) (0.51) (1.07) (0.12) (5.24) (0.20) (75.4) (1.78) (4.38) ITASE-03 (glaze/dune) 4.22–98.1 0.086–1.05 0.047–0.42 1.00–30.3 0.13–1.16 0.23–2.69 0.028–0.30 2.54–17.0 0.016–0.61 19.5–233 0.64–8.03 3.61–6.90
(26.0) (0.35) (0.18) (6.56) (0.54) (1.15) (0.14) (6.07) (0.22) (87.2) (2.55) (4.96) ITASE-06/07 (non-glaze/dune) 2.21–115 0.11–5.52 0.053–0.41 1.19–39.2 0.031–0.98 0.21–9.58 0.021–0.28 0.60–35.8 0.0082–1.55 48.7–701 0.71–6.69 1.89–9.37
(21.0) (0.71) (0.20) (11.4) (0.31) (1.18) (0.10) (6.24) (0.14) (109) (3.08) (5.05) ITASE-06/07 (glaze/dune) 5.44–60.9 0.19–6.76 0.098–0.45 6.45–94.0 0.21–1.00 0.64–2.60 0.072–0.28 2.09–19.8 0.024–1.17 73.8–197 1.33–6.54 0.68–10.3
(21.4) (1.12) (0.23) (19.6) (0.47) (1.33) (0.15) (7.94) (0.17) (129) (2.85) (5.50) Firn sections
(mean) Sr (ng L−1) Cd (ng L−1) Cs (ng L−1) Ba (ng L−1) La (ng L−1) Ce (ng L−1) Pr (ng L−1) Pb (ng L−1) Bi (ng L−1) U (pg L−1) As (ng L−1) Li (ng L−1)
02-1 (1966–1975) 30.78 5.50 0.10 6.52 0.25 0.46 0.06 4.50 0.06 153.17 2.01 1.47
02-5 (1967–1975) 13.46 0.75 0.16 7.25 0.30 0.60 0.08 2.27 0.06 168.01 1.49
02-6/SP (1955–1975) 8.88 4.07 0.23 18.76 0.23 0.49 0.06 12.07 2.71 69.48 3.48 9.86 03-1 (1955–1975) 16.73 1.88 0.18 18.19 0.51 1.15 0.14 20.93 0.59 94.26 3.25 03-3 (1955–1966) (glaze/dune) 46.61 4.03 0.59 27.44 2.53 4.43 0.69 24.99 0.85 119.01 10.83 5.02
06-2 (2002–2006) 19.59 0.69 0.24 6.36 0.80 1.85 0.20 6.06 0.26 136.75 1.97 2.44
07-4 (2000–2006) 8.46 0.67 0.13 5.34 0.22 0.51 0.06 1.51 0.16 62.40 1.92 1.82
07-5 (2000–2006) 10.93 0.83 0.26 5.12 0.41 0.88 0.11 3.28 0.14 49.64 4.61 1.05
Previous Studies
(mean) Sr (ng L−1) Cd (ng L−1) Cs (ng L−1) Ba (ng L−1) La (ng L−1) Ce (ng L−1) Pr (ng L−1) Pb (ng L−1) Bi (ng L−1) U (pg L−1) As (ng L−1) Li (ng L−1)
Lambert Basin 1998–2002 (Hur et al., 2007) 0.21 2.40 4.00 0.03 29.00 10.00
Law Dome 1956–1977 (Vallelonga et al., 2004) 82.68 0.28 2.64 1.84 0.05 26.83
Coats Land 1958–1975 (Planchon et al., 2002) 0.20 3.13 3.73 0.06 37.14
Collins Ice Cap, King George Island Jul–Dec 2000 (Hong et al., 2002) 0.10 3.48
Dolleman Island 1984–1985 (Suttie and Wolff, 1992) 0.08 4.00
D55 Adelie Land 1940–1980 (Gorlach and Boutron, 1992) 0.30 4.80 Coats Land 1923–1986 (Wolff et al., 1999) 0.10
S. Palmer Land Feb 1980 Surface Snow (Wolff and Peel, 1985) 0.26 6.30 Hercules Neve, Victoria Land 1986–1994 (Van de Velde et al., 2005) 10.87 6.96 Styx Glacier, Victoria Land 1954–1975 (Van de Velde et al., 2005) 23.27 4.66
Coats Land 1923–1986 (Wolff and Suttie, 1994) 4.00
Styx Glacier, Victoria Land 1965–1975 (Barbante et al., 1997) 4.10 Adelie Land Jan 1983 Surface Snow (Boutron and Patterson, 1987) 5.43 South Pole Jan 1984 Surface Snow (Boutron and Patterson, 1987) 6.30 25 cm deep snow pits across Antarctica 1990 (Xiao et al., 2000) 13.68
Dome-C Holocene Average (Siggaard-Andersen et al., 2007) 7.00
Dome-C Holocene Average (Gabrielli et al., 2010) 0.39 0.91 0.09
Table 3. Continued.
Surface Snow
min-max (mean) Al (µg L−1) S (µg L−1) Ca (µg L−1) Ti (ng L−1) V (ng L−1) Cr (ng L−1) Mn (ng L−1) Fe (µg L−1) Co (ng L−1) Na (µg L−1) Mg (µg L−1) K (µg L−1) ITASE-02 0.079–0.82 3.37–20.0 0.018–4.81 1.11–87.0 0.41–3.37 0.028–11.5 2.15–20.7 0–0.65 0–3.03 2.52–43.4 8.31–28.7 0.82–7.61 (0.23) (8.20) (0.47) (14.8) (1.29) (2.75) (6.21) (0.13) (0.41) (7.74) (17.3) (1.44) ITASE-03 (non-glaze/dune) 0.10–1.73 5.71–42.8 0–2.85 5.75–33.8 0.63–3.85 0.033–5.55 2.67–42.9 0.055–0.98 0.0055–2.06 3.55–40.6 4.19–22.5 0.33–3.40
(0.43) (16.7) (0.82) (16.0) (1.72) (1.72) (13.9) (0.28) (0.34) (11.5) (11.1) (1.58) ITASE-03 (glaze/dune) 0.14–3.14 9.54–106 0.075–5.95 3.68–47.7 0.66–4.85 0.27–6.68 5.70–40.0 0.089–0.93 0.066–1.87 0.97–108 3.27–32.4 0.34–5.15
(0.58) (35.8) (1.58) (19.5) (1.72) (2.48) (17.5) (0.38) (0.54) (29.5) (15.1) (2.05) ITASE-06/07 (non-glaze/dune) 0.35–3.34 2.78–31.1 0.16–48.6 8.38–90.3 0.16–3.40 1.13–55.8 0.32–41.3 0.12–1.94 0.051–4.51 3.42–94.3 1.01–4.92 0.39–3.92
(1.29) (13.5) (4.46) (27.9) (1.32) (5.36) (13.3) (0.54) (0.55) (15.9) (2.40) (1.28) ITASE-06/07 (glaze/dune) 0.60–2.13 5.86–23.0 0.055–13.0 18.7–104 0.69–2.98 2.13–298 4.75–97.3 0.28–8.01 0.15–11.5 3.21–69.8 1.22–7.21 0.52–3.73
(1.27) (14.6) (2.47) (39.6) (1.83) (28.9) (20.8) (1.11) (1.01) (18.6) (3.10) (1.55) Firn sections
(mean) Al (µg L−1) S (µg L−1) Ca (µg L−1) Ti (ng L−1) V (ng L−1) Cr (ng L−1) Mn (ng L−1) Fe (µg L−1) Co (ng L−1) Na (µg L−1) Mg (µg L−1) K (µg L−1)
02-1 (1966–1975) 1.68 10.17 3.43 31.85 1.01 2.80 28.86 0.49 1.48 41.60 6.42
02-5 (1967–1975) 0.90 17.32 2.46 17.55 1.75 2.81 19.52 0.37 2.48 18.01 1.80
02-6/SP (1955–1975) 2.07 6.60 2.29 22.33 1.90 11.87 25.33 0.90 22.55 6.60 6.48 1.29 03-1 (1955–1975) 8.62 25.93 0.95 35.10 2.15 20.16 29.60 0.99 1.89 14.63 4.49 03-3 (1955–1966) (glaze/dune) 10.52 58.23 4.23 63.94 5.11 22.41 67.26 2.34 4.29 45.43 11.65 1.82
06-2 (2002–2006) 1.25 18.38 3.38 66.31 1.82 7.37 15.95 0.86 1.07 19.03 2.76 1.05
07-4 (2000–2006) 0.53 9.48 0.90 42.83 1.84 8.44 7.09 0.42 0.71 8.05 1.58 0.76
07-5 (2000–2006) 2.61 12.71 2.53 59.73 1.67 9.17 12.41 0.89 0.84 10.72 2.77 0.59
Previous Studies
(mean) Al (µg L−1) S (µg L−1) Ca (µg L−1) Ti (ng L−1) V (ng L−1) Cr (ng L−1) Mn (ng L−1) Fe (µg L−1) Co (ng L−1) Na (µg L−1) Mg (µg L−1) K (µg L−1) Lambert Basin 1998–2002 (Hur et al., 2007) 0.17 0.46 3.70 0.05
Law Dome 1956–1977 (Vallelonga et al., 2004) 2.33 0.65 4.97 0.73 57.33
Coats Land 1958–1975 (Planchon et al., 2002) 0.52 0.63 1.91 10.37 0.41 Collins Ice Cap, King George Island Jul–Dec 2000 (Hong et al., 2002) 4.67
Dolleman Island 1984–1985 (Suttie and Wolff, 1992) 1.00 D55 Adelie Land 1940–1980 (Gorlach and Boutron, 1992)
Coats Land 1923–1986 (Wolff et al., 1999) 1.70 60.00
S. Palmer Land Feb 1980 Surface Snow (Wolff and Peel, 1985) 0.70
Dome-C Holocene Average (Marino et al., 2004) 120.00 0.75
WAIS Divide Snow pit 1999–2005 (Koffman et al., 2008) 1.84
periods is volcanic emissions (Zreda-Gostynska et al., 1997; Hinkley et al., 1999; Vallelonga et al., 2003; Marteel et al., 2008; Gabrielli et al., 2005), which are transported primar-ily through the upper troposphere and stratosphere. Chemi-cal species transported via the upper atmosphere, such as Bi,
should exhibit higher concentrations at high-elevation inland locations, such as the Antarctic Plateau.
The majority of the firn section trace element concentra-tions (Sr, Ba, La, Ce, Pr, Pb, As, Li, Al, Ca, Ti, Fe, and Na) are comparable to, or below, values from previous stud-ies (Table 3). The 03-3 firn section repeatedly exhibits high
trace element concentrations, relative to other firn sections and values from previous studies. This is expected because it is located in a large glaze/dune area on the East Antarctic plateau (Fig. 1). The remaining firn sections exhibit raised concentrations, relative to previous studies, for several ele-ments (Cd, Bi, U, V, Cr, Mn, and Co). This is likely due to the same reasons, explained above, as the surface snow sam-ples: proximity to the Transantarctic Mountains, location in glazed non-dune areas, station-associated anthropogenic im-pacts, and/or their interior-plateau positions relative to the coastal locations of most previous studies.
3.5.1 East versus West Antarctic trace element
concentrations
To compare East versus West Antarctic trace element in-put timing differences, we use the mean ITASE-03 non-glaze/dune and ITASE-02 surface snow samples to repre-sent average summer concentrations. We also use the 03-1 (1955–1975) and 02-1 (1966–1975) firn sections to repre-sent the non-glaze/dune multi-year concentrations for East and West Antarctica. Section 02-5 is located on the East Antarctic side of the Transantarctic Mountains (and hence is not representative of West Antarctica). The South Pole firn section is located in close vicinity to a large active station (Amundsen–Scott South Pole Station) with aircraft passing through on a regular basis. Firn section 03-3 repre-sents a well-developed glaze/dune area on the East Antarc-tic plateau, and sections 06-2, 07-4, and 07-5 cover a more recent time period (∼2001–2006) than the ITASE-02 and ITASE-03 firn sections.
Sr and Na, both elements that we know to be primarily marine-source, exhibit higher firn section (multi-year) con-centrations in West Antarctica than in East Antarctica (Ta-ble 3). The surface snow (summer) concentrations for these two elements are lower overall and exhibit the opposite pat-tern with higher values in East Antarctica. Therefore, we can conclude that Na and Sr have a dominant lower tropospheric transport pathway and are primarily deposited outside of the summer season. If we apply a similar rationale to the remain-ing elements, we see that Cd, U, Ca, and Mg exhibit a sim-ilar pattern to Sr and Na (Table 3). This is hardly surpris-ing for Ca and Mg, both of which have a significant marine source, but is perhaps a little surprising for Cd and U, both of which have relatively low concentrations in ocean water (Table S2). Despite having slightly higher multi-year East Antarctic concentrations, Cs and Mn are similar to Sr and Na in that the most significant concentration increases occur in West Antarctica outside of the summer season (Table 3).
The rare earth elements La, Ce, and Pr exhibit higher East Antarctic concentrations in both their summer and multi-year samples. These three elements do not show any significant seasonal change in concentration (Table 3). This may suggest an upper tropospheric transport pathway but does not give us any clue as to their input timing. Despite the lack of
multi-year data, mean K concentrations are remarkably consistent across East and West Antarctica (including glaze/dune areas) and do not show any significant seasonal change in concen-tration (Table 3).
Pb, Al, S, and Fe are similar to the rare earths in that they exhibit higher East Antarctic concentrations in both the sum-mer and multi-year samples. However, they are different in that they likely have a strong seasonal input via the upper troposphere outside of the summer season. Cr is also similar to this group of elements, except that it has slightly higher West Antarctic concentrations in summer (Table 3).
As and Ti also exhibit higher East Antarctic concentra-tions in both the summer and multi-year samples and ex-hibit a strong seasonal input outside of the summer season. However, the seasonal input does not appear to have a pre-ferred atmospheric transport pathway, displaying increases of a similar magnitude in both East and West Antarctica. Co also behaves as As and Ti, but it displays slightly higher West Antarctic concentrations in summer (Table 3).
The final group of elements (Ba, Bi and V) exhibit summer input via the lower troposphere and a winter input via the up-per troposphere, with the latter input being by far the stronger of the two. We know this because the relative summer to multi-year increase is much greater for the East Antarctic sites. Li also follows this pattern, at least for the West Antarc-tic site. Unfortunately, Li was not included in the 03-1 anal-yses, so lack of data precludes observation of a multi-year East Antarctic value (Table 3).
3.5.2 ITASE-02 trace elements
The majority of the ITASE-02 “dust” trace elements (Cs, La, Ce, Pr, As, Al, Ti, V, Cr, Mn, Fe and Co) exhibit a double-peak structure. Values are high in West Antarctica (from Byrd to 02-2), dipping between 02-2 and 02-4 and peaking again around 02-4 and 02-5 before leveling off past South Pole and out to 02-7 (Fig. 5a, b, and c). This suggests that multiple transport pathways and/or sources exist for these el-ements.
The ITASE-02 “marine-source” trace elements (Sr, S, and Na) exhibit a pronounced West Antarctic peak between Byrd and 02-2, while the spatial patterns of Ca and K display only a weak West Antarctic peak. Ca and K have marine and dust sources in Antarctica, which may explain the absence of a strong spatial signature for these two elements. The remain-ing ITASE-02 trace elements (Cd, Ba, Pb, Bi, U and Li) do not exhibit any significant spatial patterns between Byrd and 02-7.
Several ITASE-02 trace elements (Cs, La, Ce, Pr, Ti, V and Mn) exhibit a large peak in the vicinity of 02-5 (Fig. 5a, b, and c) that is likely caused by the glaze/dune field in this area (Fig. 1). The glaze/dune hiatus areas likely saturate the surface causing higher chemical concentrations in affected samples.
D. A. Dixon et al.: Variations in snow and firn chemistry 527
3.5.3 ITASE-03 trace elements
All of the ITASE-03 trace elements exhibit a similar spatial pattern that is characterized by high concentrations across the central East Antarctic glaze/dune area between 03-1 and Taylor Dome (Fig. 5a, b, and c). The majority of the ITASE-03 trace elements (with the exception of Sr, S, Na, Mg and K) also show a distinct peak between South Pole and 03-1. This emphasizes the considerable effect that glaze/dune areas have on chemical concentrations of surface snow in East Antarctica and at the same time draws attention to the magnitude of the concentration increase between South Pole and 03-1 that cannot be attributed to glaze/dune fields and is likely the result of anthropogenic activity associated with South Pole Station.
3.5.4 ITASE-06/07 trace elements
Much like 03, the spatial pattern of the ITASE-06/07 trace elements is dominated by increased concentra-tions and variability in the glaze/dune area between 06-4 and 2 and distinct peaks around 06-3 and between 07-3 and 07-4 (Fig. 5a, b, and c). This again underscores the fact that glaze/dune areas exercise the dominant control on surface chemistry in these areas of East Antarctica. The ITASE-06/07 concentrations are also complicated by addi-tional factors such as proximity to the Transantarctic Moun-tains, glazed non-dune areas, and anthropogenic activity in the vicinity of South Pole (Fig. 1).
3.5.5 Glaze/dune and glazed, non-dune areas
The aforementioned traverse profiles (Fig. 3, 4, 5a, b, and c) clearly emphasize the highly variable nature of the glaze/dune areas, not just with respect to the major ion and trace element concentrations, but also with respect to the physical parameters, backscatter and grain size. Examination of the traverse map (Fig. 1) in conjunction with the physi-cal parameter and chemiphysi-cal concentration profiles leads us to classify extensive areas of East Antarctica as “glaze/dune”. All samples starting from midway between 03-1 and 03-2 to 03-6 and all samples between 06-4 and 07-3 (shaded areas on traverse profiles) are classified as glaze/dune. The chemistry samples in these glaze/dune areas do not represent typical summer surface snow concentrations, but most likely rep-resent a mean, multi-annual value. Glazed, non-dune areas likely exist between 03-6 and TD, and in the vicinity of 02-5 and 06-3. These areas affect the concentrations of several of our chemical species, but not all. Therefore, we do not definitively classify them as glaze/dune and we do not shade these areas on our spatial plots. The glazed, non-dune data are included in the calculation of our mean “non-glaze/dune” concentrations.
3.5.6 Trace element enrichment factors
To elucidate potential sources for the trace elements in these surface snow samples, we ran enrichment factor (EF) calculations on each set of samples. We calculated the average crustal enrichment factors (EFc) and average
oceanic enrichment factors (EFo) for each element using
mean upper crust elemental abundances (Table S2) from Wedepohl (1995) and mean ocean water elemental abun-dances from Lide (2005). Values were calculated accord-ing to the followaccord-ing: crustal EF for element x [EFc(x) =
mean([x/r]sample/[x/r]upper crust)], wherer=Cs, La, Ce, Pr,
V, and Mn to reduce the potential bias from using only a sin-gle conservative crustal element; oceanic EF for elementx
[EFo(x) = mean([x/r]sample/[x/r]ocean water)], wherer=Sr
and Na.
The following elements are enriched in the summer sur-face snow with respect to earth’s upper crust: Cd, Pb, Bi, As, Li, S, Cr, Na, Mg, and K (Table 4). The following are en-riched relative to ocean water: Cd, Cs, Ba, La, Ce, Pr, Pb, Bi, U, As, Li, Al, S, Ti, V, Cr, Mn, Fe, Co, and Mg. To sep-arate these two potential sources, we calculated the ocean water fraction of each element according to the following formula: oceanic fraction for elementx (xo=mean(rsample
· [xocean water/rocean water]), wherer=Sr and Na). We then
subtracted the oceanic fraction from each element in each sample and recalculated the EFcto give nss-EFcvalues
(Ta-ble 4). We consider an element highly enriched if it exhibits a nss-EFc value of 10 or more for each traverse year. We
choose a value of 10 following Duce et al. (1975). Elements exhibiting highly enriched nss-EFcvalues are Cd, Pb, Bi, As,
Li, S, Cr, and Mg, suggesting additional source(s) in addition to the ocean and crust. Of these elements, Cd, Pb, Bi, As, Li, and S are highly enriched for all traverse years. Cr and Mg do not exhibit an nss-EFc greater than 10 for the ITASE-03
and ITASE-06/07 traverse years, respectively (Table 4). The general pattern of enrichment for several of the highly en-riched elements (Cd, Pb, Li and Cr) is such that the ITASE-03 nss-EFcvalues are the lowest of the three traverse years.
Cr, being the least highly enriched of all the highly enriched elements, does not exhibit nss-EFcvalues higher than 10 for
ITASE-03. The Mg enrichment values for the ITASE-02 and ITASE-03 surface snow samples are unusually high and for the purposes of this study can be ignored (see supplemental section S2 for more information).
Two recent studies (Planchon et al., 2002; Vallelonga et al., 2004) have published East Antarctic coastal firn EFc
data for Sr, Cd, Ba, Pb, Bi, U, V, Cr, Mn, and Co. All of our surface snow EFc values fall within the range of these
previous studies apart from the ITASE-02 EFcdata for
ele-ments Cd, Ba, and Bi, the ITASE-03 glaze/dune EFc value
for Sr, the ITASE-06/07 non-glaze/dune EFcdata for Sr, and
the ITASE-06/07 glaze/dune EFc data for Cr. The
ITASE-02 Cd, Ba, and Bi exhibit EFc values 2 to 5 times higher
than previous studies (Table 4). As mentioned above, these
Table 4. Enrichment factors for surface snow samples and previous studies. EFc= crustal enrichment factor; nss-EFc= non-sea-salt crustal enrichment factor.
Surface Snow
EFc(mean) Sr Cd Cs Ba La Ce Pr Pb Bi U As Li
ITASE-02 2.19 541.64 0.98 2.54 0.76 0.68 1.09 30.82 355.77 1.83 39.17 51.38
ITASE-03 (non-glaze/dune) 1.86 147.75 1.45 0.43 0.79 0.77 0.92 14.80 76.11 1.69 47.68 12.50 ITASE-03 (glaze/dune) 3.58 169.89 1.34 0.46 0.73 0.74 0.94 16.36 95.10 1.69 60.80 12.23
ITASE-06/07 (non-glaze/dune) 4.25 495.88 2.31 1.00 0.56 1.01 1.03 22.10 67.73 3.01 101.78 18.34 ITASE-06/07 (glaze/dune) 2.85 433.46 1.71 1.24 0.59 0.85 0.99 20.60 50.71 2.30 61.05 11.68
Surface Snow
nss-EFc(mean) Sr Cd Cs Ba La Ce Pr Pb Bi U As Li
ITASE-02 <0 542.66 0.98 2.54 0.77 0.68 1.09 30.87 356.97 1.70 39.02 50.60
ITASE-03 (non-glaze/dune) 0.10 147.78 1.45 0.42 0.79 0.77 0.92 14.81 76.15 1.60 47.57 11.93 ITASE-03 (glaze/dune) 0.24 169.96 1.34 0.45 0.73 0.75 0.94 16.38 95.19 1.52 60.63 11.15
ITASE-06/07 (non-glaze/dune) 0.91 496.13 2.30 1.00 0.56 1.01 1.03 22.12 67.76 2.84 101.61 17.26 ITASE-06/07 (glaze/dune) 0.51 433.64 1.70 1.24 0.59 0.85 0.99 20.62 50.74 2.18 60.92 10.92
Previous Studies
EFc Sr Cd Cs Ba La Ce Pr Pb Bi U As Li
Coats Land 1959–1990 (Planchon et al., 2002) 133.00 0.80 56.00 127.00 4.00 Law Dome 1898–1989 (Vallelonga et al., 2004) 1.50 269.00 31.00 90.00 2.70
Table 4. Continued. Enrichment factors for surface snow samples and previous studies. EFc=crustal enrichment factor; nss-EFc=
non-sea-salt crustal enrichment factor.
Surface Snow
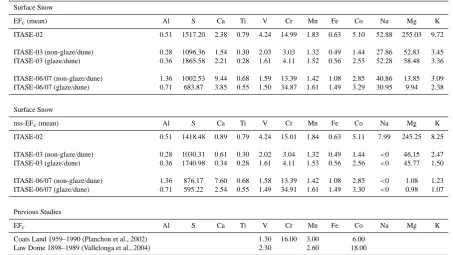
EFc(mean) Al S Ca Ti V Cr Mn Fe Co Na Mg K
ITASE-02 0.51 1517.20 2.38 0.79 4.24 14.99 1.83 0.63 5.10 52.88 255.03 9.72
ITASE-03 (non-glaze/dune) 0.28 1096.36 1.54 0.30 2.03 3.03 1.32 0.49 1.44 27.86 52.83 3.45 ITASE-03 (glaze/dune) 0.36 1865.58 2.21 0.28 1.61 4.11 1.52 0.56 2.55 52.28 58.48 3.36
ITASE-06/07 (non-glaze/dune) 1.36 1002.53 9.44 0.68 1.59 13.39 1.42 1.08 2.85 40.86 13.85 3.09 ITASE-06/07 (glaze/dune) 0.71 683.87 3.85 0.55 1.50 34.87 1.61 1.49 3.29 30.95 9.94 2.38
Surface Snow
nss-EFc(mean) Al S Ca Ti V Cr Mn Fe Co Na Mg K
ITASE-02 0.51 1418.48 0.89 0.79 4.24 15.01 1.84 0.63 5.11 7.99 245.25 8.25
ITASE-03 (non-glaze/dune) 0.28 1030.31 0.61 0.30 2.02 3.04 1.32 0.49 1.44 <0 46.15 2.47 ITASE-03 (glaze/dune) 0.36 1740.98 0.34 0.28 1.61 4.11 1.53 0.56 2.56 <0 45.77 1.50
ITASE-06/07 (non-glaze/dune) 1.36 876.17 7.60 0.68 1.58 13.39 1.42 1.08 2.85 <0 1.08 1.23 ITASE-06/07 (glaze/dune) 0.71 595.22 2.54 0.55 1.49 34.91 1.61 1.49 3.30 <0 0.98 1.07
Previous Studies
EFc Al S Ca Ti V Cr Mn Fe Co Na Mg K
Coats Land 1959–1990 (Planchon et al., 2002) 1.30 16.00 3.00 6.00 Law Dome 1898–1989 (Vallelonga et al., 2004) 2.30 2.60 18.00
elevated values may be a result of location differences. The ITASE-02 traverse samples are predominantly located on the West Antarctic plateau, while Law Dome and Coats Land
are East Antarctic coastal locations. ITASE-06/07 glaze/dune Cr exhibits an EFc slightly more than double the value
from previous studies. This is probably a combined effect
D. A. Dixon et al.: Variations in snow and firn chemistry 529
Daniel Dixon – Surface Snow – Revised Manuscript 37 1
Figure 6. Surface snow excess element concentration (red) and global mean volcanic
2
quiescent degassing background minimum (pink) and maximum (green) contributions
3
versus distance for the ITASE-02 (left), ITASE-03 (middle) and ITASE-06/07 (right)
4
traverses. Distances are measured from the beginning of each traverse. Vertical lines
5
indicate the locations of firn section collection sites along each traverse; B = Byrd; SP =
6
South Pole; TD = Taylor Dome. Large vertical shaded areas behind plots highlight
7
glaze/dune regions. Horizontal (blue) lines signify detection limits. Note that scales may
8
vary between traverse years.
9
10
11
12
13
14
15
16
17
18
19
20
21
Fig. 6. Surface snow excess element concentration (red) and global mean volcanic quiescent degassing background minimum (pink) and
maximum (green) contributions versus distance for the ITASE-02 (left), ITASE-03 (middle) and ITASE-06/07 (right) traverses. Distances are measured from the beginning of each traverse. Vertical lines indicate the locations of firn section collection sites along each traverse: B = Byrd; SP = South Pole; TD = Taylor Dome. Large vertical shaded areas behind plots highlight glaze/dune regions. Horizontal (blue) lines signify detection limits. Note that scales may vary between traverse years.
Daniel Dixon – Surface Snow – Revised Manuscript 38 1
Figure 7. Surface snow remaining element concentration (red) and Mount Erebus
2
volcanic plume minimum (pink) and maximum (green) contributions versus distance for
3
the ITASE-02 (left), ITASE-03 (middle) and ITASE-06/07 (right) traverses. Distances
4
are measured from the beginning of each traverse. Vertical lines indicate the locations of
5
firn section collection sites along each traverse; B = Byrd; SP = South Pole; TD = Taylor
6
Dome. Large vertical shaded areas behind plots highlight glaze/dune regions. Horizontal
7
(blue) lines signify detection limits. Note that scales may vary between traverse years.
8
9
10
Fig. 7. Surface snow remaining element concentration (red) and Mount Erebus volcanic plume minimum (pink) and maximum (green)
contributions versus distance for the ITASE-02 (left), ITASE-03 (middle) and ITASE-06/07 (right) traverses. Distances are measured from the beginning of each traverse. Vertical lines indicate the locations of firn section collection sites along each traverse: B = Byrd; SP = South Pole; TD = Taylor Dome. Large vertical shaded areas behind plots highlight glaze/dune regions. Horizontal (blue) lines signify detection limits. Note that scales may vary between traverse years.
of the glaze/dune hiatus surfaces and their location close to the Transantarctic Mountains. Sr has a significant oceanic source, so we would expect this element to exhibit some en-richment relative to the crust. After the oceanic fraction is removed, Sr does not exhibit significant enrichment. Other elements that exhibit a significantly lower nss-EFccompared
to their EFc (indicative of an oceanic source) include Ca,
Na, Mg, and K, as expected. Several elements display only slightly lower nss-EFc compared to their EFc, suggesting a
very small oceanic contribution. These include U, Li, and S.
3.5.7 Trace element global volcanic contribution
The elements Cd, Pb, Bi, As, Li, and S are significantly enriched across Antarctica relative to both the oceanic and crustal elemental compositions (Table 4). S in the Antarctic atmosphere is primarily of biogenic origin, but it also has a volcanic source comprising up to 10–15 % (Boutron and Pat-terson, 1986; Hur et al., 2007). As the majority of our surface snow samples are likely representative of summer precipita-tion, we use the more conservative values of 5–10 % for our global volcanic background S contributions. Previous stud-ies have measured the ratio of sulfur to trace elements and
heavy metals in volcanic emissions from around the world (Hinkley et al., 1999; Nriagu, 1989). We use the Hinkley et al. (1999) element/S ratios (Table S3) for the highly en-riched elements Cd, Pb, Bi, and As to calculate inputs from the global mean volcanic quiescent degassing background. We also use the Mount Erebus plume element/S ratios (Table S3) from Zreda-Gostynska et al. (1997) to represent the local source contributions for Cd and As. Unfortunately, Zreda-Gostynska et al. do not measure Pb or Bi, and neither study measures Li.
Prior to applying the volcanic calculation for each of the following elements, Cd, Pb, Bi, and As, we remove the oceanic fraction (as outlined above) and the crustal fraction, which is calculated according to the following: crustal fraction for element x (xc=
mean(rsample·[xupper crust/rupper crust]), wherer=Cs, La, Ce, Pr, V, and Mn). We are then left with the excess (excess = to-tal – (oceanic + crustal)) elemental concentrations, from which we calculate the 5 % (minimum) and 10 % (maximum) S values to which we apply the Hinkley et al. element/S ratios (Table S3) to obtain global volcanic background minimum (GVmin) and maximum (GVmax) concentrations.
Comparison between excess element concentrations, GVmin and GVmax (Table 5a) reveals that, for As, the ITASE-02 global volcanic background contribution ranges from 2 % to 4 % of the mean excess As concentration. For ITASE-03 As, the global volcanic background contribution ranges from 1 % to 3 % over non-glaze/dune areas and from 2 % to 4 % over glaze/dune areas. For ITASE-06/07 As, the global volcanic background contribution does not account for more than 1 % over glaze/dune and non-glaze/dune areas (Table 5a). The spatial distribution of the As global volcanic background in our surface snow samples (Fig. 6) reveals that contributions rarely ever become higher than the As detection limit and are therefore not considered a significant source for this element.
Antarctic Cd inputs from the global volcanic background are significant, with GVmax accounting for between 35 % and 57 % of the mean excess Cd concentrations for ITASE-03. However, Cd GVmax is less significant for ITASE-02 and ITASE-06/07, with values of 14 % and 10 %, respectively (Table 5a). Spatially, the distribution of the Cd GVmax in-put is highest in the glaze/d