www.the-cryosphere.net/6/313/2012/ doi:10.5194/tc-6-313-2012
© Author(s) 2012. CC Attribution 3.0 License.
The Cryosphere
Stable water isotopes of precipitation and firn cores from the
northern Antarctic Peninsula region as a proxy for climate
reconstruction
F. Fernandoy1, H. Meyer1, and M. Tonelli2
1Foundation Alfred Wegener Institute for Polar and Marine Research in the Helmholtz Association, Research Unit Potsdam,
Potsdam, Germany
2Oceanographic Institute, University of S˜ao Paulo, Brazil
Correspondence to: F. Fernandoy (ffernandoy@gmail.com)
Received: 18 December 2010 – Published in The Cryosphere Discuss.: 17 March 2011 Revised: 30 January 2012 – Accepted: 7 February 2012 – Published: 22 March 2012
Abstract. In order to investigate the climate variability in the northern Antarctic Peninsula region, this paper focuses on the relationship between stable isotope content of pre-cipitation and firn, and main meteorological variables (air temperature, relative humidity, sea surface temperature, and sea ice extent). Between 2008 and 2010, we collected pre-cipitation samples and retrieved firn cores from several key sites in this region. We conclude that the deuterium excess oscillation represents a robust indicator of the meteorologi-cal variability on a seasonal to sub-seasonal smeteorologi-cale. Low ab-solute deuterium excess values and the synchronous varia-tion of both deuterium excess and air temperature imply that the evaporation of moisture occurs in the adjacent Southern Ocean. Theδ18O-air temperature relationship is complicated and significant only at a (multi)seasonal scale. Backward trajectory calculations show that air-parcels arriving at the region during precipitation events predominantly originate at the South Pacific Ocean and Bellingshausen Sea. These investigations will be used as a calibration for ongoing and future research in the area, suggesting that appropriate lo-cations for future ice core research are located above 600 m a.s.l. We selected the Plateau Laclavere, Antarctic Peninsula as the most promising site for a deeper drilling campaign.
1 Introduction
It is well known that Antarctica plays a key role in the earth’s climate regulation. The influence of the Antarctic Circumpolar Current on the ocean and atmosphere in the Southern Hemisphere demonstrates the strong interconnec-tion of the climate dynamics (White and Peterson, 1996). Lately, Antarctica has been in the focus of scientific
atten-tion, due to the elevated rate of atmospheric warming during the second half of the 20th century. The warming rate of 0.082◦C decade−1 as a mean value for whole Antarctica (Chapman and Walsh, 2007) is in fact close to the rate for the Southern Hemisphere warming (IPCC, 2007). However, the strong atmospheric warming detected over West Antarc-tica (0.14◦C decade−1), especially over the western Antarc-tic Peninsula (WAP) (0.4◦C decade−1), has no counterpart in any other region of the world (Vaughan et al., 2003; Turner et al., 2005, 2009; Steig et al., 2009). The strongest trends were detected at coastal ground stations (e.g. Vernadsky Sta-tion (formerly Faraday): 0.56◦C decade−1, 1951–2000), and
especially during winter seasons in the 1990s. Since then the temperature trend seems to be at least stabilized or decreased (Turner et al., 2005; Chapman and Walsh, 2007).
et al., 1991; Turner et al., 2005; Bracegirdle et al., 2008). Up to 87 % of 244 marine glacier fronts from the whole Antarc-tic Peninsula are presently retreating (Cook et al., 2005) and the height line of permanent dry snow has clearly ascended over the last decades (Rau and Braun, 2002; Tedesco et al., 2007). The warming of both the atmosphere and the ocean has been producing an increase of humidity, leading to raised snow accumulation rates in the southern WAP as shown by Thomas et al. (2008). However, the mass bal-ance of the Antarctic Peninsula is negative with a loss of ∼38.1 Gt a−1, mostly concentrated in the central and north regions (∼ −28.6 Gt a−1) according to Chen et al. (2009). Nonetheless, Hall (2009) shows that the ice shelf ground-ing line of the Antarctic Peninsula has constantly retreated since the Last Glacial Maximum and reached its approxi-mate present position during the early Holocene time, with some glacier advances at around 7 ka, 5 ka, 2 ka and 0.7 ka in the Holocene. According to Hall (2009) the present over-all glacier retreat in the area of the Antarctic Peninsula is not unique in recent periods, but is now reaching warm con-ditions similar to those of the mid-Holocene within a short period of time (decades). Moreover, the ice shelf disintegra-tion has not been detected even during the warm Holocene phases. The rapid warming of the WAP most likely orig-inated from the intensification of the westerly circumpolar trough and increasing transport of heat from the ocean at lower latitudes, which has been related to the positive shift of the Southern Annular Mode (SAM) index (Marshall, 2003) since the 1960s (Thompson and Solomon, 2002; Gillett et al., 2006; Marshall et al., 2006). The intensification of SAM has recently been related to anthropogenic causes like in-creased concentration of greenhouse-gases in the atmosphere and stratospheric ozone depletion (Gillett et al., 2008). Little is known about when these processes started and their evolu-tion through the industrial period. Addievolu-tionally, the existing scarce meteorological data (∼50 a) is often interrupted and clearly geographically-biased, because most of the stations are located at coastal regions. For these reasons, a better and deeper understanding of the climate variability of the last decades to centuries is still urgently needed for the region.
The stable isotope composition of Antarctic ice offers a unique proxy to extend the existing meteorological records well beyond the pre-instrumental times. The interpretation of this proxy is not straight forward and requires a detailed study of the different parameters affecting the isotope com-position of precipitation stored in the glaciers. It has been demonstrated that precipitation reflects not only air temper-ature variations, but also conditions at the ocean surface, at-mospheric teleconnections and circulation shifts, as well as other local effects (Ichiyanagi et al., 2002; Uemura et al., 2008; Thomas and Bracegirdle, 2009). Stable isotope (oxy-gen and hydro(oxy-gen) content of water molecules in precipita-tion are considered as an excellent proxy to trace seasonal changes in air temperatures, especially in Polar Regions (Dansgaard, 1964; van Ommen and Morgan, 1997).
Thermo-dynamic differences between the water molecules containing different stable isotopes of oxygen and hydrogen lead to the fractionation of water molecules (18O/16O and2H/H ratios) during water phase changes (such as evaporation). More-over a continuous depletion of the heavy isotopes occurs rel-ative to the temperature variation and trajectory of air masses during condensation (Dansgaard, 1964). Distillation of the heavy isotopes from an air mass will follow approximately a Rayleigh-type process (Dansgaard, 1964; Gat, 1996). In-cloud condensation of moisture occurs in an approximately closed system and therefore the isotopic composition at the moment of precipitation will depend mainly on the local air temperature (Rozanski et al., 1993; Gat, 1996; Clark and Fritz, 1997). This makes the isotope composition of precipitation suitable to identify air temperature fluctuations (e.g. summer and winter oscillations) and changes in the air masses pathways and moisture sources. The secondary iso-topic parameter known as deuterium excess (dexcess), was
defined by Dansgaard (1964) in the following relationship:
d=δD−8δ18O. This parameter refers to the fractionation rate difference (or excess) of HD16O and H218O during the
evaporation of water vapor from the ocean (kinetic evapo-ration process). Since the posterior in-cloud condensation is considered to occur in equilibrium conditions (Dansgaard, 1964; Gat, 1996), thedexcessgenerally does not undergo
fur-ther modifications during the rain-out process. Therefore,
dexcess will depend mainly on the conditions at the
evapora-tion moment, i.e. relative humidity (h), sea surface tempera-ture (SST) and wind speed at the moistempera-ture source. Because of these characteristics,dexcessis useful to identify the moisture
source conditions and to reconstruct variations of these con-ditions in time, a tool broadly accepted and well-suited for glacio-geochemical investigations (e.g. Stenni et al., 2010). Uemura et al. (2008) made direct measurements of water vapor above the sea level at southern high latitudes, as one of the first empirical validations of thedexcess variability in
response to sea surface conditions. They found thatdexcess
negatively correlates with h and positively correlates with SST, however, a strong and random variability is observed close to the Antarctic coast region.
In this paper we aim to construct a comprehensive iso-tope geochemical and hydrological data set to characterize the present climate and hydrological situation at the northern Antarctic Peninsula, a basis needed for on-going and future research in this region. This work is also aimed to contribute to the objectives of the newly created initiative of the Tropi-cal to Polar Connections Institute (www.polartropiTropi-cal.org).
2 Study area
-120° -120°
-90° -90°
-60° -30° 0°
0°
-80° -70° -60°
Bellings haus en Station
O´H iggins Station
N eumay er Station Plateau Lac lav ere J ames R os s Is land
Gomez Plateau Vernadsky Station
Bellings haus en D ome
D etroit Plateau
D y er Plateau
Siple Station
ITASE 01-5
Esperanza Station
Bellingshausen Sea
Amundsen Sea
Weddell Sea
South Pacific Ocean South Atlantic Ocean
South Shetland Islands King George Island
Fig. 1. Map showing all locations mentioned in this paper, as
sta-tions in Antarctica (yellow dots), ice/firn core retrieve locasta-tions (red points), and ongoing and future research areas (orange dots).
-6 -6
-5 -5
-4 -4
-3 -3
-2 -2
-1 -1
0 0
Temperature (°C)
2000 1990
1980 1970
Year (A.D.) y = -52.3 + 0.025 x
y = -47.7 + 0.022 x FP OH
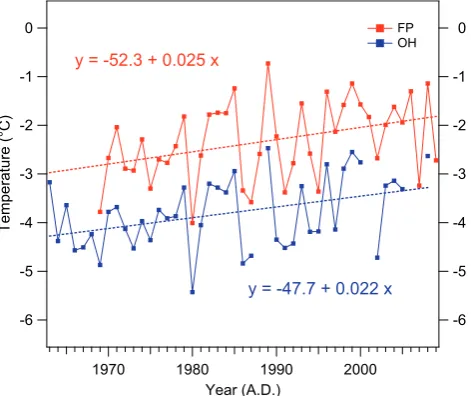
Fig. 2. Mean annual air temperature (MAAT) of the last 4 to 5
decades from Bellingshausen station (FP, red line), King George Island, and O’Higgins station (OH, blue line), Antarctic Peninsula. For both stations linear regression (dotted lines) are presented, as well as the annual air temperature trend (equations).
previous work. These two areas are the ice cap covering King George Island (KGI), South Shetland Islands, and the re-gion south-east of the Chilean Antarctic Station “Bernardo O’Higgins” (later referred to as O’Higgins – OH) at the Antarctic Peninsula (API) (Fig. 1).
KGI is a 1250 km2island covered by an ice cap with an ex-tension of more than 1158 km2(>90 % of KGI) (Sim˜oes et al., 1999). The climate regime of the island is characterized by maritime conditions. The surface mean annual air tem-perature (MAAT) recorded at the Russian Station Belling-shausen is−2.3◦C for the period 1968–2009. A clear
posi-Fig. 3. Picture of the Plateau Laclavere (63◦2701000S, 57◦4503200W, 1030 m a.s.l.) reached the first time on the 31 January 2010 with a Twin-Otter aircraft of the Chilean Air Force. From this location a firn core of 11m depth was extracted (OH-6).
tive temperature trend of 0.025◦C a−1is observed since the beginning of the meteorological record (Fig. 2). According to Blindow et al. (2010) and R¨uckamp et al. (2010), the ice cap of KGI displays a polythermal regime, with a lower tem-perate part and a cold part above 400 m a.s.l. However, the exact line of transition between temperate and cold regime is still a matter of discussion. The altitude of the ice cap reaches 700 m a.s.l. in the central region of KGI (Blindow et al., 2010). R¨uckamp et al. (2010) and Wen et al. (1998) estimate that the MAAT at the highest point of the ice cap should be around−6 to−6.6◦C. This implies that the KGI ice cap is very sensitive to climate variability. The firn/ice transition was identified at 35 m depth by radio echo sound-ing profiles (Blindow et al., 2010) and by density profiles of ice cores retrieved at the main glacier dome (700 m a.s.l.) in this island (Sim˜oes et al., 2004). Both studies detected a water table above the firn/ice transition. As a consequence of the climatic conditions of the region, strong melting, melt water percolation, and refreezing processes are evident, thus making the drilling process and interpretation of the isotope signal in the temperate part of the ice cap complicated.
Fig. 4. Overview of the study area on King George Island (KGI), South Shetland Islands. Precipitation samples and meteorological data were
collected at the Chilean station Frei and the neighbouring Russian station Bellingshausen; expeditions to the KGI glacier were organized from the Uruguayan station Artigas (green dots). Three firn cores (red dots) were retrieved from this area between the local Bellingshausen dome (FP-4) and the main dome of KGI (FP-1). The Landsat 7 satellite image is available at the LIMA website (http://lima.usgs.gov/). Contour lines shown are from the Antarctic Digital Database (ADD) (www.add.scar.org:8080/add).
a key location to investigate the recent climate variation of the region. Using the same temperature gradients invoked by R¨uckamp et al. (2010) and Wen et al. (1998), the MAAT at Laclavere should be around−10◦C, and since the air temper-ature oscillation recorded at OH is in the range of±3.6◦C, monthly mean air temperature should stay the whole year below the freezing point, making this area ideal for glacio-logical investigations.
In addition to the ice-coring work a network for collect-ing precipitation samples was established in cooperation with the Chilean Meteorological Service (DMC) and the Antarctic Department of the Chilean Army (DAE). Two stations collect precipitation samples and provide the meteorological record on a daily schedule since 2008 until present. These are lo-cated at the Antarctic Chilean Stations Eduardo Frei (FP) and Bernardo O’Higgins (OH), situated on Fildes Peninsula, KGI, and the API, respectively (Fig. 1).
3 Methods
During three consecutive summer campaigns (2008–2010), several firn cores (more than 80 m in total) were retrieved from KGI and the northern part of API. At both localities, an altitudinal profile was completed from sea level up to 1030 m a.s.l. A total of 7 firn cores are included in this pa-per: FP-1, FP-3 and FP-4 from KGI (Fig. 4), and 1,
Fig. 5. Study area in the northern Antarctic Peninsula region. The Chilean station O’Higgins (green dot) is located at the west side of the
Antarctica Peninsula on the Isabel Riquelme Islet facing the Bransfield strait. At this station precipitation samples and meteorological data were collected. Between the O’Higgins station and the Plateau Laclavere (1030 m a.s.l.) four firn cores (red dots) were retrieved during 2008 and 2010. The Landsat 7 satellite image is available at the LIMA website (http://lima.usgs.gov/). Contour lines shown are from the Antarctic Digital Database (ADD) (www.add.scar.org:8080/add).
surface temperature (SST) time series were extracted from the Hadley Centre Sea Ice and Sea Surface Temperature data set (HadISST, http://hadobs.metoffice.com/hadisst/). The HadISST provides SST and SIF on a global 1◦ to 1◦ grid in monthly means from 1973 to the present (Rayner et al., 2003). SIF fields results from a blend of in situ sea surface observations and a special sensor satellite estimates from the microwave/imager SSM/I. NCEP/NCAR reanalysis data (Kalnay et al., 1996) were used to estimate the relative hu-midity (h)of the region. This reanalysis uses a state-of-the-art analysis/forecast system to perform atmospheric data as-similation from 1948 to the present. Datasets are provided in a 2.5◦ to 2.5◦ latitude-longitude regular grid. HadISST and NCEP/NCAR fields were resampled to a regional scale in a Bellingshausen component (West Antarctic Peninsula), Weddell Sea component (East Antarctic Peninsula) and a whole region component (Bellingshausen and Weddell com-posite). The fields were resampled bordered by 85◦W to 40◦W longitude and 60◦S to 90◦S latitude limits. A field horizontal mean was computed to construct the time se-ries used. Additionally, for each precipitation event regis-tered at O’Higgins station, a 3-day air parcel backward tra-jectory was calculated to identify the moisture mass prove-nance. For this purpose, we used the free accessible Hybrid single-particle Lagrangian integrated trajectory (HYSPLIT) model (Draxler and Hess, 1998, available at http://ready.
arl.noaa.gov/HYSPLIT.php). This 3-D model was fed with the global data assimilation system (GDAS) archives from NOAA/NCEP (Kanamitsu, 1989). GDAS offers a global 1◦ to 1◦latitude-longitude spatial coverage with a 6-h temporal resolution and is available from 2004 to the present (for more details visit http://ready.arl.noaa.gov/gdas1.php). Single tra-jectories were later grouped in 4 major clusters for each sta-tion, following a statistical treatment that calculates the spa-tial variance of the trajectories.
4 Results and discussion
4.1 δ18O andδD
In the next section, oxygen and hydrogen stable water iso-topes of precipitation and firn core samples are presented, compared and discussed. All results are referred to the Vi-enna Standard Mean Ocean Water Standard (VSMOW) in ‰, asδ18O and δDfor oxygen and hydrogen isotopes, re-spectively.
4.1.1 Precipitation samples
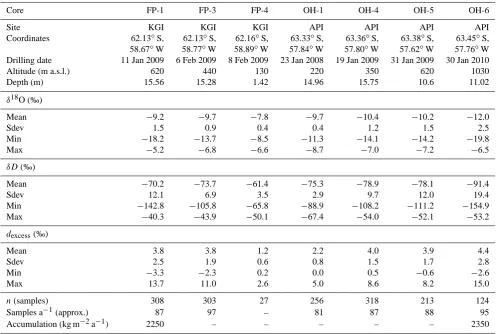
Table 1. Geographical location, mean isotope values and basic statistics of the high resolution (5 cm) stable isotope analyses of all firn cores
retrieved from King George Island (FP) and the northern Antarctic Peninsula (OH).
Core FP-1 FP-3 FP-4 OH-1 OH-4 OH-5 OH-6
Site KGI KGI KGI API API API API
Coordinates 62.13◦S, 62.13◦S, 62.16◦S, 63.33◦S, 63.36◦S, 63.38◦S, 63.45◦S, 58.67◦W 58.77◦W 58.89◦W 57.84◦W 57.80◦W 57.62◦W 57.76◦W Drilling date 11 Jan 2009 6 Feb 2009 8 Feb 2009 23 Jan 2008 19 Jan 2009 31 Jan 2009 30 Jan 2010
Altitude (m a.s.l.) 620 440 130 220 350 620 1030
Depth (m) 15.56 15.28 1.42 14.96 15.75 10.6 11.02
δ18O (‰)
Mean −9.2 −9.7 −7.8 −9.7 −10.4 −10.2 −12.0
Sdev 1.5 0.9 0.4 0.4 1.2 1.5 2.5
Min −18.2 −13.7 −8.5 −11.3 −14.1 −14.2 −19.8
Max −5.2 −6.8 −6.6 −8.7 −7.0 −7.2 −6.5
δD(‰)
Mean −70.2 −73.7 −61.4 −75.3 −78.9 −78.1 −91.4
Sdev 12.1 6.9 3.5 2.9 9.7 12.0 19.4
Min −142.8 −105.8 −65.8 −88.9 −108.2 −111.2 −154.9
Max −40.3 −43.9 −50.1 −67.4 −54.0 −52.1 −53.2
dexcess(‰)
Mean 3.8 3.8 1.2 2.2 4.0 3.9 4.4
Sdev 2.5 1.9 0.6 0.8 1.5 1.7 2.8
Min −3.3 −2.3 0.2 0.0 0.5 −0.6 −2.6
Max 13.7 11.0 2.6 5.0 8.6 8.2 15.0
n(samples) 308 303 27 256 318 213 124
Samples a−1(approx.) 87 97 – 81 87 88 95
Accumulation (kg m−2a−1) 2250 – – – – – 2350
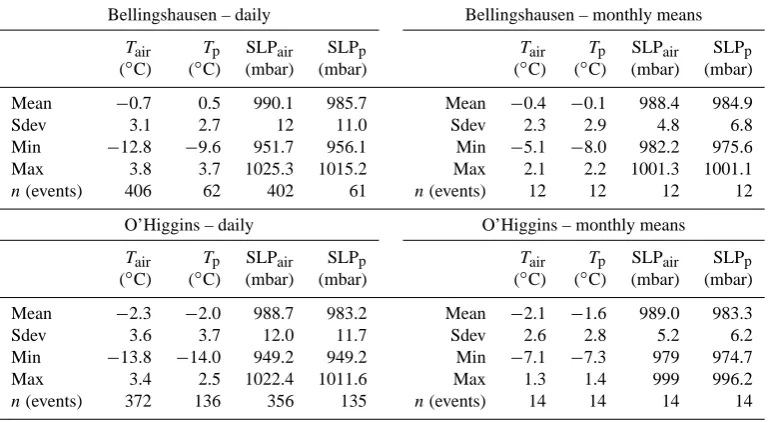
March 2009). Unfortunately an extended gap in time during the collection in winter occurs at FP, as a consequence of lo-gistic difficulties. Therefore, we base our analysis mainly on the samples collected at OH and transfer the conclusions to KGI, since meteorological conditions like mean air temper-ature (here referred to asTair)of both localities highly
cor-relate on a daily to seasonal time scale (r=0.89,p <0.01; February 2008 to March 2010). From the OH meteorolog-ical record, the mean dailyTair during the whole sampling
period (−2.1◦C) is around 0.3◦C lower than the mean daily air temperature calculated only for days with precipitation events Tp. In parallel, a lower mean air pressure at sea
level is observed during days with precipitation events com-pared to the whole period (MSLPp=983.2 mbar is 5 mbar
lower than MSLPair)(Table 3). It should be noted that the
year 2008 was around 0.8◦C warmer than the average of the past 2 decades (1989–2009), but an anomaly in MSLP has not been detected. The collected precipitation samples show almost no seasonal difference in the distribution of the cipitation events during 2008–2009. 33, 35, 36 and 35 pre-cipitation events were registered during summer (DJF), au-tumn (MAM), winter (JJA) and spring (SON), respectively.
Table 2. Meanδ18O andδDvalues and basic statistics of precip-itation samples collected between February 2008 and March 2009, and geographical coordinates of the corresponding collection sta-tions: Frei (Fildes Peninsula, King George Island, South Shetland Islands) and O’Higgins (North Antarctic Peninsula).
Station: Frei (FP) O’Higgins (OH) Coordinates: 62.2◦S, 58.96◦W 63.32◦S, 57.9◦W
m a.s.l.: 45 13
δ18O ‰
Mean −7.9 −9.2
Sdev 2.6 3.3
Min −15.7 −19.4
Max −1.8 −3.8
δD(‰)
Mean −62.3 −70.5
Sdev 20.8 26.4
Min −126.5 −150.6
Max −10.7 −21.8
dexcess(‰)
Mean 0.6 2.7
Sdev 2.5 4.2
Min −5.0 −6.6
Max 6.9 22.3
n(samples) 66 139
-20 -16 -12 -8 -4 0
δ
18 O (‰)
01.08 03.08 05.08 07.08 09.08 11.08 01.09 03.09
Date (month.year)
-12 -8 -4 0 4
Temperature (°C)
δ18
O ‰ OH (daily) Tair (°C) OH
Fig. 6. Isotopic composition of precipitation samples (blue dots)
collected at O’Higgins station in a daily schedule during Febru-ary 2008 and March 2009. The mean daily temperatures (light grey line) for O’Higgins are displayed as well. A high variability of air temperature and isotope data is observed, especially during the win-ter season.
understand (Fig. 6). The isotope composition of precipi-tation at daily resolution correlates relative poorly with Tp
(r=0.35,p <0.01). This is mostly related to the meteoro-logical instability and low temperature oscillation (standard deviation,σair=3.5◦C), typical for the maritime influence
and for the complexity of the isotope fractionation process at coastal regions (Carrasco et al., 2003; Noone, 2008; Sime et
-10 -8 -6 -4 -2 0 2 4
Temperature (°C)
01.08 04.08 07.08 10.08 01.09 04.09 Date (month.year)
-14 -12 -10 -8 -6
δ
18
O (‰)
OH Station δ18
O‰ (monthly mean)
Tair (daily) Tair (smoothed) Tp (monthly mean) Linear regression:
δ O = - 8 + 0.41 T
(r = 0.79, r = 0.65, p < 0.01) 18
p air
Fig. 7. Mean monthlyδ18O values (blue dots) of precipitation samples collected at O’Higgins station. Also shown are data of mean monthly air temperature during precipitation days only (Tp, green dots), daily record (Tair, light grey) and smoothed recordTair (30 day smoothing, black line) at this station. A clear seasonal variability ofδ18O is observed, linear regression of theδ18O and
T correlation is presented in the figure.
al., 2009). On the other hand, monthly averages calculated from daily events, significantly improve theδ18O/T correla-tion coefficient (r=0.79,p <0.01) (Fig. 7). The improve-ment of theδ18O/T correlation is produced by the smooth-ing of (high) dailyTairvariability, and therefore the seasonal
oscillation is enhanced. This confirms thatδ18O composi-tion of precipitacomposi-tion, at least on a seasonal scale, indeed cap-tures theTairvariations of the region, despite of the limited
seasonal temperature fluctuations. The temperature differ-ence between monthly Tair andTp (Table 3) at a monthly
scale is aroundTp=Tair+ 0.5◦C. For this reason a
correc-tion has to be applied for theδ18O/Tair relationship. From
Table 3. Basic statistics of air temperature and air pressure at sea level for Bellingshausen Station at Fildes Peninsula (FP) and O’Higgins
Station (OH), separately calculated for days with precipitation (Tpand SLPp) and for the whole collection period (Tair, SLPair).
Bellingshausen – daily Bellingshausen – monthly means
Tair Tp SLPair SLPp Tair Tp SLPair SLPp
(◦C) (◦C) (mbar) (mbar) (◦C) (◦C) (mbar) (mbar)
Mean −0.7 0.5 990.1 985.7 Mean −0.4 −0.1 988.4 984.9
Sdev 3.1 2.7 12 11.0 Sdev 2.3 2.9 4.8 6.8
Min −12.8 −9.6 951.7 956.1 Min −5.1 −8.0 982.2 975.6
Max 3.8 3.7 1025.3 1015.2 Max 2.1 2.2 1001.3 1001.1
n(events) 406 62 402 61 n(events) 12 12 12 12
O’Higgins – daily O’Higgins – monthly means
Tair Tp SLPair SLPp Tair Tp SLPair SLPp
(◦C) (◦C) (mbar) (mbar) (◦C) (◦C) (mbar) (mbar)
Mean −2.3 −2.0 988.7 983.2 Mean −2.1 −1.6 989.0 983.3
Sdev 3.6 3.7 12.0 11.7 Sdev 2.6 2.8 5.2 6.2
Min −13.8 −14.0 949.2 949.2 Min −7.1 −7.3 979 974.7
Max 3.4 2.5 1022.4 1011.6 Max 1.3 1.4 999 996.2
n(events) 372 136 356 135 n(events) 14 14 14 14
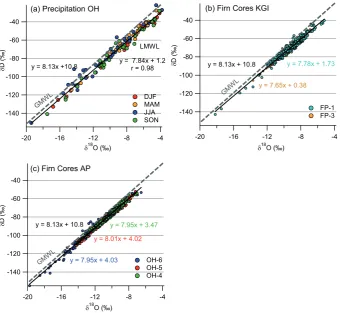
similar slopes of both lines, but lower intercept of the LMWL (1.2 ‰) than that of the GMWL (Fig. 8a), indicates slightly difference of evaporation conditions in the moisture source with respect to the global average. This point will be dis-cussed in greater detail in the following sections.
4.1.2 Firn cores
The most negative meanδ18O value (−12 ‰) is found for core OH-6. The location of core OH-6 corresponds with the highest altitude of the study area (1030 m a.s.l.). On the other hand, the cores OH-1, OH-4 and OH-5 show only a slight difference in theirδ18O mean, and precipitationδ18O mean values, despite the altitude differences between the coring lo-cations. This implies that an isotopic altitude effect is visible only above 600 m a.s.l. (i.e. between the location of OH-5 and OH-6). Unfortunately no direct comparison within the cores from FP is possible, since only 2 of the 3 cores are suitable but located too closely to each other, thus no altitude effect is visible. Co-isotopeδD/δ18O diagrams of the cores allow us to compare the precipitation and firn samples, sim-ilar to the LMWL explained in Sect. 4.1.1. From Fig. 8b, it is observed that all firn cores have a slope close to 8 and intercepts between 0.4 and 4, and are therefore quite sim-ilar to the precipitation LMWL (below the GMWL). From these observations, it can be derived that (1) the fractionation during the condensation process is common for the whole region, and (2) that post-depositional effects (e.g. diffusion and/or sublimation) do not play an important role for the snow/firn isotopic composition of the area. It is widely ac-cepted that annualδ18O andδDmaxima (minima) occur in summer (winter) coincident with highest (lowest) air
tem-perature in the southern high latitudes. The counting of al-ternation of these peaks is the most common method used for dating of firn and ice in regions with high accumulation (Legrand and Mayewski, 1997). However, this is not an easy task in our study area. As seen in Table 1, all firn cores below 600 m a.s.l. show a strong smoothing of the isotopic signal that can be visualized from theδ18O andδDstandard devia-tion values (σcores), caused by the summer melt of the surface
snow and firn. Theσcoresfor both FP and OH locations are
clearly dependent on the altitude, with constrainedσcoresfor
the cores in lower altitudes and increasingσcoresin high
-140 -120 -100 -80 -60 -40
δ
D (‰)
-20 -16 -12 -8 -4
δ18O (‰)
y = 7.65x + 0.38
y = 7.78x + 1.73
GMW L
FP-1 FP-3
(b) Firn Cores KGI
y = 8.13x + 10.8
-140 -120 -100 -80 -60 -40
δ
D (‰)
-20 -16 -12 -8 -4
δ18O (‰)
y = 7.95x + 4.03 y = 8.01x + 4.02
y = 7.95x + 3.47
GMW L
OH-6 OH-5 OH-4
(c) Firn Cores AP
y = 8.13x + 10.8 -140
-120 -100 -80 -60 -40
δ
D (‰)
-20 -16 -12 -8 -4
δ18O (‰)
GMW
L DJF
MAM JJA SON
(a) Precipitation OH
y = 7.84x + 1.2 r = 0.98 y = 8.13x +10.8
LMWL
Fig. 8. Co-isotope relationships for: (a) Precipitation samples collected in O’Higgins showing the Local Meteoric Water Line (LWML)
defined for this location (black line), (b) Firn cores retrieved from King George Island (FP cores) and (c) firn cores from the Antarctic Peninsula (OH). For all correlations the equation of the best linear fit is presented, additionally the Global Meteoric Water Line (GMWL) is shown for all three figures (dashed grey line).
procedure. The explanation for this feature is linked to the meteorology of the region, with restricted seasonal temper-ature oscillations. Sime et al. (2009), described that the
δ18O (δD) signal reflects only between 11 % and 30 % of the MAAT for the James Ross Island area, north-east Antarctic Peninsula (Fig. 1). The isotope/temperature relation varies along the Antarctic Peninsula improving to the south-west (explaining up to 70 % of local MAAT variation), depending on local daily, synoptic and seasonal atmospheric and mete-orological characteristics. The isotope seasonality signal of our study region is further discussed in the following deu-terium excess section.
4.2 Deuterium excess
Here, we present and discuss the results of the high-resolution measurements ofdexcesscalculated fromδ18O and δDvalues.
4.2.1 dexcess of precipitation
From all 139 samples collected at OH between Febru-ary 2008 and March 2009 singledexcess values have been
calculated (Fig. 10). A mean dexcess value of 2.7 ‰
(Ta-ble 2) suggests that the evaporation of the moisture reaching this station occurs in conditions of relatively highh, most probably with origin in the adjacent Southern Ocean. Ac-cording to the relationship defined by Uemura et al. (2008):
d= −0.61h+55.7, the evaporation of moisture that arrives at OH should occur under conditions of∼87 % relative hu-midity, close to the global mean of 85 % (Clark and Fritz, 1997) calculated for the GMWL of Craig (1961) and the GNIP data base (available at: http://www-naweb.iaea.org/ napc/ih/index.html) (Rozanski et al., 1993). The disagree-ment between global mean values and precipitation at OH (contrasting dexcess but similarh), indicates that the use of
the GMWL for Antarctic coastal regions is not precise, since evaporation and condensation occurs under different con-ditions than those from tropical and sub-tropical regions. Therefore, we introduce a local MWL, which should bet-ter fit for these purposes. Dailydexcess values are shown in
Fig. 10, displaying a large variability, especially in winter. A very similar, but inverse pattern is seen for theTair(Fig. 10,
light grey line), therefore suggesting that localTaircontrols
-14 -14 -12 -12 -10 -10 -8 -8 -6 -6 δ
18 O (‰)
14 12 10 8 6 4 2 0 Depth (m) -16 -16 -12 -12 -8 -8 δ
18 O (‰)
14 12 10 8 6 4 2 0 Depth (m) 2010 2009
2009 2008 2007 2006
(a) OH-6
(b) FP-1
δ18 O ‰
5 cm resolution Smoothed (20 pt)
δ18O ‰ 5 cm resolution Smoothed (20 pt)
Fig. 9. High resolution (5 cm, light grey lines) and smoothed (20 points, blue line)δ18O signal of firn cores: (a) OH-6 and (b) FP-1. OH-6 was retrieved from Laclavere Plateau (Antarctic Peninsula) in 2010; FP-1 was retrieved from the main dome of King George Island (South Shetland Islands), in 2009. Note that none of the cores show defined seasonal cycles, as seen from the year of depo-sition. The first day of the year is approximately indicated (dashed red lines). -12 -10 -8 -6 -4 -2 0 2 Temperature (°C)
03.08 05.08 07.08 09.08 11.08 01.09 03.09
Date (month.year) 20 15 10 5 0 -5 d excess ( ‰ ) OH
Tair (daily)
d excess
Fig. 10.dexcess(red dots) values of daily precipitation samples col-lected at O’Higgins stations and daily air temperature record (light grey lines) from this station. For visualization purposes thedexcess axis has been inverted.
this investigation, because: (1) this gives the possibility to use thedexcessvariability as geochemical proxy for localTair
and (2) the synchronous (inverse) variation ofTairanddexcess
implies that the moisture source should be located relatively near, since a longer path of moisture masses arriving at OH, will cause a lag onTair−dexcess oscillations. Furthermore,
the single events reveal thatdexcessis a good indicator of
ex--12 -10 -8 -6 -4 -2 0 2 Temperature (°C)
03.08 05.08 07.08 09.08 11.08 01.09 03.09
Date (month.year) 10 8 6 4 2 0 d excess ( ‰ ) OH Station Tair (daily)
Tair (smoothed)
Tp (monthly mean)
d excess (monthly mean)
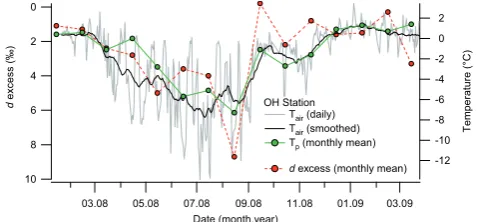
Fig. 11. Monthlydexcess mean (red dots) of precipitation samples from O’Higgins station and daily air temperature (Tair, light grey). The smoothedTair(black line) correspond to a 30 day running mean function. For visualization purposes thedexcess axis has been in-verted.
treme meteorological conditions, as observed in fast drops ofTair, e.g. on 4 July (Tp= −14◦C), 5 August (Tp= −9◦C)
and 23 August (Tp= −12◦C) reflected in a strong increase of dexcess (22.3 ‰, 13.8 ‰ and 14.6 ‰), respectively (Fig. 10),
which is characteristic for input of Antarctic continentally originated moisture. The increase ofdexcesshas been related
to changes in the fractionation rates at extreme low temper-atures and to the kinetic fractionation produced by the ice-crystal formation from super-cooled air masses. This effect is mainly visible above 2000 m a.s.l. (Jouzel and Merlivat, 1984; Masson-Delmotte et al., 2008). Nonetheless, the gen-eral negative correlation of dailydexcessvalues andTpis
rel-atively low (r= −0.42,p <0.01), due to the instability of meteorological conditions. This correlation greatly improves on a monthly to seasonal scale, as forδ18O, mostly because the extreme and fast changes in temperature are smoothed, revealing a more realistic relationship between dexcess and Tair (and Tp). The winter temperature drop of the
precip-itation site is then linked with an increase of dexcess. The
physical explanation is most likely the decrease ofhand/or SST at the moisture source. Figure 11 shows a summary of the monthly mean values ofdexcess,Tair andTp. Linear
re-gressions demonstrate that the correlation coefficients (r)are high between both,TairandTprelative todexcessvalues.
Re-gressions andr are given for monthly mean values by the expressions:
d=1.54−0.54Tair (r= −0.61, p <0.01) (1)
and
d=1.73−0.59Tp (r= −0.72, p <0.01) (2)
The linear regression equations demonstrate that the isotopic composition of precipitation from this region reflects most of the meteorological variability at seasonal and even sub-seasonal scales. Therefore, we conclude that the isotope composition of precipitation represent a suitable proxy for
Table 4. Correlation matrix of mean monthly isotope values: resample of the high altitude firn cores (OH-6 and FP-1), precipitation (OH)
and major seasonal forcing of meteorological variability identified for this region (Tair– air temperature, SIF – sea ice fraction, SST – sea surface temperature, andh– relative humidity). Significant p-level (p <0.05) are marked in red letters.
TairOH TairFP SIF SST h
FP-1
δ18O 0.39 0.35 −0.03 0.32 0.28 n=42
p=0.01 p=0.02 p=0.84 p=0.04 p=0.08
dexcess −0.66 −0.73 0.52 −0.61 −0.71
p=0.00 p=0.00 p=0.00 p=0.00 p=0.00
OH-6
δ18O 0.06 0.00 −0.11 0.02 −0.15 n=23
p=0.77 p=1.00 p=0.63 p=0.94 p=0.49
dexcess −0.59 −0.61 0.76 −0.72 −0.34
p=0.00 p=0.00 p=0.00 p=0.00 p=0.11
OH
δ18O 0.70 0.84 −0.77 0.71 0.64 n=14
p=0.01 p=0.00 p=0.00 p=0.01 p=0.02
dexcess −0.59 −0.70 0.49 −0.32 −0.78
p=0.03 p=0.01 p=0.09 p=0.29 p=0.00
15 15
10 10
5 5
0 0
d
excess (‰)
16 14 12 10 8 6 4 2 0
Depth (m)
15 15
10 10
5 5
0 0
d
excess (‰)
16 14 12 10 8 6 4 2 0
Depth (m)
2010 2009
2009 2008 2007 2006
d excess 5 cm resolution Smoothed (20pt)
(a) OH-6
(b) FP-1
d excess 5 cm resolution Smoothed (20pt)
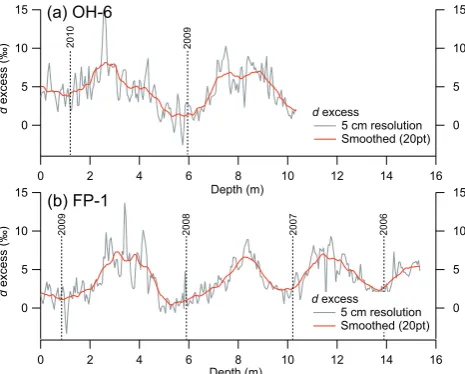
Fig. 12. Firn coresdexcesshigh resolution (5 cm samples, red line) and smoothed (20 points, red line) signal of: (a) OH-6, retrieved in January 2010 at the Laclavere Plateau (Antarctic Peninsula); and (b) FP-1, retrieved in January 2009 at the main dome of King George Island (South Shetland Islands). A clear seasonality is visi-ble for both cores, however a decrease of the amplitude is observed for the core FP-1 in depth, showing some post-depositional effects. The deposition year of firn for both cores are shown (black dashed lines – approximately the first day of the year).
4.2.2 Deuterium excess of firn cores
Thedexcessof most of the firn cores show mean values close
to 4 ‰ (Table 1), with values around 1.3 ‰ above the mean
dexcessvalue for precipitation (OH = 2.7 ‰), an exception are
the cores OH-1 and FP-4 (dexcess of 1.2 ‰ and 2.2 ‰,
re-spectively). Despite the slight difference between OH station and firn dexcess values, both are clearly under the GMWL
(dexcess=10 ‰). At this step, some influence of moisture
of continental provenance cannot be discarded for high al-titude locations of KGI and API. As demonstrated above, both high-altitude cores (OH-5, OH-6 and FP-1) do not indi-cate major signs of melting and/or percolation. Furthermore OH-6 show the highest dexcess value of all cores (4.4 ‰).
Thus, the dexcess values in high altitude locations could
re-flect a slightly different moisture composition as compared to the coastal area. Moreover, at both areas (OH and KGI) thedexcessof the cores systematically decreases towards low
altitudes. Therefore, thedexcessdifference between firn cores
and precipitation values is likely not to be related to post-depositional effect. Additionally, melt and/or infiltration of lowerdexcess (summer) precipitation can be discarded as the
main cause of the lower values with decreasing altitude, since
dexcess of OH-1 (220 m a.s.l.) is similar to that of
precipita-tion at OH staprecipita-tion. As previously menprecipita-tioned, at this staprecipita-tion year-round well distributed precipitation events were sam-pled and a seasonal bias of isotope composition can for this reason be rejected. Other local effects like diffusion within the snow cover or preferential removal of lowdexcess layers
-10 -5
0 5
Temperature (°C)
12 8 4 0
d
excess (‰)
40 30 20 10 0
Depth (m)
2010 2008
2006 2004
2002
Air Temperature Fildes Peninsula Monthly mean
Daily (Smooth 30pt)
d excess FP-1 OH-1 OH-6
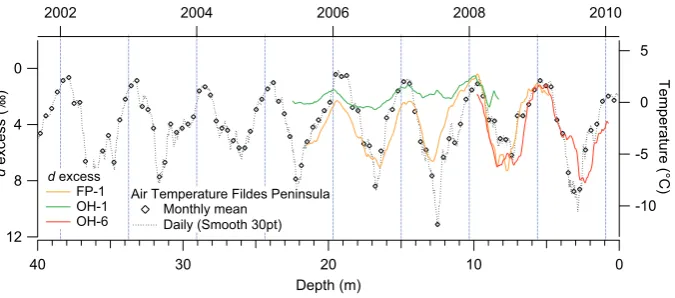
Fig. 13. Seasonality ofdexcesspresented by three firn cores: FP-1 (King George Island), OH-1 and OH-6 (Antarctic Peninsula). The cores were retrieved in different field campaigns during 2008 and 2010, therefore the depth axis is only referential, note as well that thedexcess axis has been inverted for better comparison of the data. Air temperature (dashed black line and diamonds) is from Bellingshausen Station, Fildes Peninsula (King George Island). The first day of the year is represented by the vertical lines.
drift or sublimation), but these have been considered to be not significant for the API region, due to the high precipitation rates, and therefore not having a great impact on the isotope composition (van Lipzig et al., 2004). The comparison of the
dexcessstandard deviation (σexcess)of firn cores and
precipita-tion demonstrate that closer to the coast firn displays a strong homogenization of the isotope composition, whereσexcessfor
OH station (σexcess=2.7) is clearly larger than coastal cores
OH-1 (σexcess=0.8) and FP-4 (σexcess=0.6). Larger
val-ues of σexcess are found only at the high altitudes regions
(>600 m a.s.l.) of OH and FP (see Table 1). Lowerdexcess
values, as mentioned above, are associated with more humid conditions at the moisture source. This supports the assump-tion that the coastal regions are influenced by a stronger mar-itime regime, which slightly decreases towards the higher al-titudes. Similar to the observed seasonal variations of the OH data, thedexcessof firn cores presents a marked
seasonal-ity (Fig. 12), hence allowing the use of thedexcess seasonal
variability as an instrument for dating of the accumulated snow and firn. In Fig. 13, the smoothed dexcess of cores
OH-6, OH-1 and FP-1 are compared to the Tair from FP.
The smoothing of thedexcess signal was done using a
spe-cial moving average function (box function), considering a similar number of points before and after the smoothed value (21 points,∼1 m firn depth). In this case the FP record has been used because of gaps in the monthly and daily me-teorological record of OH station during some periods be-tween 2005 and 2010. This visual comparison underlies a correlation between Tair and dexcess. Moreover, assuming
that accumulation is approximately constant through all sea-sons, resampling to monthly means of the isotope data of firn cores can be performed. This allows a direct compari-son of monthlyTairanddexcessvalues (monthly re-sampled).
Correlation coefficients for monthly means are given in Ta-ble 4. Additionally, theδ18O resampled value is presented for comparison, reaffirming the complexity to directly
in-ferTair from oxygen and deuterium data. From the
gener-ated age model, it can be preliminarily concluded that both locations have high accumulation rates. Wen et al. (1998) and Sim˜oes et al. (2004) retrieved ice cores from the main plateau area at KGI during different field seasons. Density of snow/firn of these cores show a compaction with an ap-proximately linear tendency in the first 20 m and an increase step of 4.5 kg m−3per meter, the surface snow density is
esti-mated to be around 490 kg m−3. Using these density profiles
combined with our age model of FP-1, accumulation rates of 2542, 2296 and 1935 kg m−2a−1are estimated for 2008, 2007 and 2006, respectively for this location. These rates are similar to the mean accumulation of 2480 kg m−2a−1 described by Wen et al. (1998), but much higher than ac-cumulation rates calculated by Sim˜oes et al. (2004) of about 590 kg m−2a−1. However, the snow/firn cover of KGI in-cludes several ice layers, which are the product of percola-tion and refreezing. These may lead to overestimated density values, which would therefore correspond to higher accumu-lation rates. In general, the Antarctic coast exhibits elevated accumulation rates (van den Broeke et al., 2006; Masson-Delmotte et al., 2008). Hence, we conclude that Sim˜oes et al. (2004) underestimated the accumulation rates of this location.
4.3 Mainδanddexcess forcing
In the preceding sections the relationship of stable water isotopes and Tair has been largely discussed.
Nonethe-less, correlation coefficients for this relationship are in some cases statistically significant although with relatively low sig-nificance. The relationship between δ18O (δD) from firn cores and Tair is complicated, and probably suitable only
to study inter-annual variability; in contrast monthlyδ18O means from precipitation events may reproduce well the
0.6 0.5 0.4 0.3 0.2
SIF
09.05 01.06 05.06 09.06 01.07 05.07 09.07 01.08 05.08 09.08 01.09 05.09 09.09 01.10
Date (month.year) 96
92
88
84
80
h
(%)
10 8 6 4 2 0
d
excess (
‰
)
-12 -8 -4 0
Tair
(°C)
d excess
FP- 1 OH-6
Tair (FP)
h SIF
Fig. 14. Seasonal variation of monthly means ofdexcessof cores FP-1 and OH-6 compared to the meteorological variables: relative humidity (h, green line),TairBellingshausen station (FP, dashed black line) and sea ice fraction (SIF, blue line) for the Bellingshausen Sea. Note that thedexcessand SIF axes are inverted for visualization purposes.
Table 5. Correlation matrix of monthly isotope means of firn core
FP-1 and OH-6 (resample values) and precipitation from OH station for the 12 months common period (March 2008 to March 2009). Significant p-level (p <0.05) are marked in red for easy recogni-tion.
FP-1 OH-6
OH Prec δ18O dexcess δ18O dexcess
δ18O 0.06 −0.74 −0.42 −0.72 n=12
p=0.85 p=0.01 p=0.17 p=0.01
dexcess 0.14 0.76 −0.12 0.30
p=0.66 p=0.00 p=0.71 p=0.35
FP-1
δ18O 1.00 −0.05 −0.11 −0.23 n=12
p= − p=0.88 p=0.73 p=0.47
dexcess −0.05 1.00 0.03 0.69
p=0.88 p= − p=0.92 p=0.01
OH-6
δ18O −0.11 0.03 1.00 0.05 n=12
p=0.73 p=0.92 p= − p=0.87
dexcess −0.23 0.69 0.05 1.00
p=0.47 p=0.01 p=0.87 p= −
precipitation) turns out to be suitable to study the regional cli-matic variability, because it does not directly depend on local conditions. The synchronicity ofTair anddexcess variation,
with absolute lowdexcess values, suggest a (humid) nearby
oceanic source of the moisture precipitating at the study re-gion. Thedexcess depends primarily on theh and SST of
the moisture source, moreoverhand SST seasonal oscilla-tion are linked and influenced by the sea ice cover. During winter, the sea ice cover can obstruct the contact between the water surface and atmosphere, therefore influencingTair, h and SST. Weatherly et al. (1991) proved the interdepen-dency ofTair and sea ice cover, acting as inverse feed-back
mechanisms of each other, i.e. an extended sea ice cover in
winter will cause a decrease ofTair, and on the other hand Tair in summer will predispose the following season’s sea
ice genesis. This mechanism is strong at the API region, since most of the local oceanic moisture is transported by the westerlies and then trapped by the natural barrier of the API range; therefore directly influencing the isotope composition of coastal precipitations. Similar conclusion on the effect of sea ice over the isotope composition of moisture were drawn by Noone and Simmonds (2004), recognizing the potential of water isotope (particularly thedexcess)for paleo-climate
reconstruction. In our study, the local isotope variability is evaluated for Tair, SST, h and sea ice cover (expressed as
SIF) as the main drivers of the seasonal to sub-seasonal iso-tope composition of moisture masses (Fig. 14). Table 5 dis-plays a correlation matrix forδ18O anddexcess values of two
firn cores (OH-6 and FP-1) monthly resample and of monthly mean precipitation, compared with the meteorological time series. High correlation coefficients are found fordexcess of
both firn cores withTairfrom FP and OH stations (note that
the OH station shows slighter lower coefficients probably re-lated to the data gaps of the time series). As expected from our previous observationsδ18O from firn cores do not cor-relate well withTair. However, SIF, SST andh time series
correlate fairly well to thedexcess of both cores, confirming
the dependency of the isotope composition from the moisture source conditions. The only exception to this assumption is the firn core OH-6, where theh/dexcesscorrelation coefficient
is low and not significant. Nevertheless, this is forced by two high dexcess values, because of the low number of
ob-servations (n=23). Highdexcess values most likely do not
represent oceanic moisture and are linked to more continen-tal influenced moisture. If these two peaks are removed, the correlation improves tor= −0.46 and becomes significant at p-level<0.05. Moreover, a spatial correlation analysis of
dexcess and surface air temperature was carried out. To
com-pute the spatial correlation, a longerdexcess time series was
Table 6. Seasonal frequencies (in percentage) of the backward
tra-jectory clusters calculated from single events at OH station. The right column indicates the number (n) of single events recorded in each season.
Cluster
1 2 3 4 n
DJF 21.2 % 24.2 % 51.5 % 3.0 % 33 MAM 21.2 % 12.1 % 60.6 % 6.1 % 33 JJA 28.6 % 45.7 % 5.7 % 20.0 % 35 SON 29.4 % 32.4 % 29.4 % 8.8 % 34
this was analyzed against air temperature at surface level at each NCEP grid point around the Antarctic Peninsula, Drake Passage and Valdes Peninsula. Since each grid point was a single time series, which allowed us to create a map of spatial correlation (Fig. 15) with a single correlation coeffi-cient to each lat-lon point. The analysis shows a significant correlation ofdexcess with the surface air temperature
espe-cially from the Bellingshausen Sea and Drake Passage area. Furthermore, it is important to note the higher correlation of
dexcess with the Atlantic Ocean sector than the Pacific side.
OH monthly meanδ18O anddexcessof precipitation correlate
very well toTairfrom both stations with a very high
correla-tion coefficient with respect to FP stacorrela-tion. The relacorrela-tionship between isotope composition and SIF, SST andh is more complicated to interpret since the number of valid observa-tions is very restricted. In any case again the correlation be-tweenhanddexcessremains strong. On the other hand,
sev-eral studies show that NCEP/NCAR reanalysis overestimate some of the meteorological parameters (Hines et al., 2000; Smith et al., 2001). From our observation a relative humidity for the moisture source of about 84 % (cores OH-6 and FP-1) to 87 % (OH precipitation) was estimated. NCEP/NCAR reanalysis for the corresponding locations and time periods estimates a slightly higherh=89 % for all cases. The inter-comparison between the two different locations with respect to the precipitation samples in a common time-span (Ta-ble 5), i.e. the period of common overlap of the two firn cores and precipitation collection (12 months in total, March 2008 to March 2009), allows to test the strength of the regional isotope signal. Theδ18O correlation for the firn cores and precipitation shows no coherent pattern, reflecting the high spatial variability of local meteorological (e.g. Tair)
condi-tions. On the other hand, from this matrix is again confirmed that thedexcesssignal correlates for all data sets, with
coeffi-cients close or higher than 0.7, reaffirming the robustness of the monthlydexcesssignal.
Longitude (°)
Latitude (°)
−0.65 −0.65
−0.65
−0.7
−0.75 −0.8
−0.7
−0.65
−80 −70 −60 −50
−80 −75 −70 −65 −60 −55 −50
−1 −0.95 −0.9 −0.85 −0.8 −0.75 −0.7 −0.65 −0.6 −0.55 −0.5
FP-1
OH-6
Fig. 15. Spatial correlation of the calculateddexcessmonthly mean composite from the firn cores FP-1 and OH-6 (red points) against air temperature (at surface level) from NCEP reanalysis. The color scale represents the correlation coefficient (r).
5 Backward trajectory model
With the objective to further investigate the (physical) source of moisture masses that arrive to the study area, the air parcels circulation model Hysplit (Draxler and Hess, 1998) (available at: http://www.arl.noaa.gov/ready/hysplit4.html) has been used to reconstruct a 3-day backward circulation path of every single precipitation event registered at OH sta-tion arriving at 1500 m a.s.l. (850 mb approximately). Fig-ure 16a presents a frequency chart of all paths that arrived during daily precipitation events between February 2008 and March 2009 (139 events). This figure shows a wide distribu-tion of the trajectories varying in their origin from the South Pacific in the north to the Bellingshausen Sea in the south, from the east (Weddell Sea and South Atlantic) some spo-radic events are seen as well. Most of the trajectories fol-low a clear pattern folfol-lowing a restricted pathway between latitudes 60◦ and 65◦S. Following a statistical treatment,
3 4 5 6 7 8 9 10 %
80° 70° 60° 50° 40°
60°
30°
0° 90°
120° Bellingshausen
Sea
Amundsen Sea
Weddell Sea South Atlantic
Ocean South Pacific
Ocean
O`Higgins
(
a
)
4 (12%)
3 (47%)
2 (19%)
1 (19%)
80° 70° 60° 50° 40°
60°
30°
0° 90°
120°
Bellingshausen Sea
Amundsen Sea
Weddell Sea
South Atlantic Ocean South Pacific
Ocean
O`Higgins
(
b
)
Fig. 16. Backward trajectories analysis (3-days): (a) Frequency of track of the single trajectories calculation of air parcels arriving at OH
station (1500 m a.s.l. level) during precipitation events. A total of 139 single trajectories were calculated and (b) backward trajectories clustering for precipitation events at OH station. Four main clusters are identified, the percentage of trajectories bundled to each cluster is stated in parenthesis (cf. Table 6). From a total of 139 trajectories, 4 events are not associated to any of the clusters. The red star shows the location of O’Higgins Station.
(TSV) at each step. The optimal number of clusters is fi-nally chosen arbitrarily observing when the TSV approached a flat maximum. For further details visit the Hysplit website (http://ready.arl.noaa.gov/HYSPLIT.php). After running the cluster analysis an optimal number of 4 clusters was recog-nized (Fig. 16b). The most common direction (cluster 3) is found at around 55◦S (47 %), followed by two southern clus-ters (1 and 2) that together gather almost 40 % of all events originating south of latitude 60◦S (Bellingshausen Sea). The
seasonal distribution (Table 6) of the clusters reveals a mi-gration pattern with a preferential South Pacific origin (clus-ter 3) in summer (DJF) and autumn (MAM), and preferen-tial Bellingshausen Sea direction (cluster 2) in winter (JJA) and spring (SON). Later the clusters were combined with the stable water isotope information to identify difference in the composition of precipitation events under the influence of different sources. As seen in Table 7, both northern clusters (3 and 4) are composed by events with less negativeδ18O (δD) and tending to lowerdexcess values. The southern
clus-ters (1 and 2) present lowerδ18O (δD) and higher dexcess.
Both southern clusters are also associated with lower tem-peratures and atmospheric pressures. In contrast, the clus-ter 3 is associated with higher temperatures and pressure. Cluster 4, the less common, represents especially high pres-sures containing all trajectories with an east component oc-curring most frequently in winter. This could reflect some influence of continental moisture or katabatic winds; how-ever this is not reflected in the isotopic composition. Finally two main origins of the air parcels arriving at O’Higgins can
Table 7. Mean isotopic composition of backward trajectory
clus-ters, each cluster containsnsingle events. Temperature (Tp)and air pressure (SLPp)correspond to the precipitation day only.
Cluster n δ18O δD dexcess Tp SLPp (‰) (‰) (‰) (◦C) (mbar)
1 27 −10.2 −78.1 3.2 −2.2 979.4 2 26 −10.1 −76.1 5.0 −4.1 979.3 3 65 −8.7 −67.8 1.6 −0.9 983.9 4 17 −8.4 −64.8 2.5 −3.3 992.0
be concluded: one between latitudes 50◦S and 60◦S (South Pacific), representing the most common one; and a second origin south of the latitude 60◦S (Bellingshausen-Amundsen Sea).
6 Conclusions
parameterdexcess calculated for all samples, shows to be a
good indicator of air temperature variability and single ex-treme meteorological events (elevateddexcessvalues).
More-over, mean monthly δ18O and dexcess values highly
corre-late with air temperature oscillations. We calcucorre-lated temper-ature gradients of 0.41 ‰◦C−1 (r=0.8) and 0.59 ‰◦C−1 (r=0.7) forδ18O anddexcess, respectively. Several firn cores
extracted from the ice caps adjacent to both stations were examined in order to study the implication of the precipi-tation data for the firn/ice core interpreprecipi-tation. From visual inspection and isotope analyses it is evident that all cores re-trieved below 600 m a.s.l. show evidence for percolation and refreezing due to summer melt. Moreover, from the high-resolution analyses (5 cm) several isotopic features can be recognized. Thedexcess slightly increases towards high
al-titudes probably reflecting a stronger influence of maritime conditions at coastal zones. Theδ18O from firn cores does not capture well the local seasonal temperature fluctuation, as a consequence of the low seasonal temperature oscilla-tion (σair=3.6◦C) and local post depositional effects. On
the other hand thedexcess, since it does not depend on the
local conditions exhibit a much better seasonality, thus al-lowing the dating of firn accumulated at this region. The syn-chronicity ofdexcessand air temperature implies a local
mois-ture source for the precipitation arriving at this region. Low absolutedexcess values indicate a moisture source with
typ-ical oceanic characteristics with an estimated mean relative humidity of 87 %, according to the relationship calculated by Uemura et al. (2008). A backward trajectory analysis (3 days backward) of all registered precipitation events show that the air masses follow two main paths before snow and/or rain falls: one from the South Pacific (50◦–60◦S) and a
sec-ond one from the Bellingshausen-Amundsen Sea (south of 60◦S); the first occurring preferentially in summer-autumn and the second in winter-spring. Correspondingly the north-ern path shows more positiveδ18O and lowerdexcess values,
confirming that both parameters are sensitive to changes in the moisture source region. Hence, stable isotope time se-ries of the firn cores were compared to different meteoro-logical variables such as: SST,h,Tair, and SIF. Thedexcess
show a strong correlation to humidity and sea surface tem-perature especially from the Bellingshausen Sea and Drake Passage area (r=0.7 to 0.8 for both parameters); as well as a correlation to the sea ice cover is observed (r=0.5 to 0.7), explained by the influence of sea ice directly on the air tem-perature and ocean-atmosphere interaction. Finally, the core retrieved at the Laclavere Plateau (1030 m a.s.l.), which was explored for the first time in 2010, represents very promising conditions for future glaciological investigations: restricted melt evidence of firn and snow, a high accumulation rate which ensures that a high resolution archive is stored in the ice cover, as well as low MAAT of this area estimated to be around−10◦C. In this paper we show the potential of the stable water isotope for the interpretation and reconstruction of the climate variability of this region.
Acknowledgements. We thank the generous scientific and logistic support of several institutions to this investigation. The Instituto Ant´artico Chileno (INACH) is specially acknowledged for their support in the field, the Chilean Air Force, Chilean Army, and the Chilean Meteorological Service (DMC) are thanked for their logistical organization and effort, as well as the Uruguayan station Artigas and the Instituto Ant´artico Uruguayo (IAU). We would like to express our gratitude to M. R¨uckamp, S. Suckro, T. Kleiner, J. Sobiech, N. Blindow and C. C´ardenas, as well as the crew of the stations for their collaboration in the field work. Cindy Springer and Lutz Sch¨onicke are thanked for the measurements carried out in the laboratory, as well as Mar Cartr´o for helping to process the data. Financial support was obtained from the DFG Project 444CHL-113/40/0-1, and the University of Concepci´on (Chile) DIUC internal scholarship. The PhD fellowship awarded to F. Fernandoy by the German Academic Exchange Service (DAAD) is gratefully acknowledged. We thank finally H. Oerter, T. Opel, M. Schwikowski, E. Thomas and G. Casassa for their constructive comments to this manuscript.
Edited by: G. Casassa
References
Abram, N. J., Thomas, E. R., McConnell, J. R., Mulvaney, R., Bracegirdle, T. J., Sime, L. C., and Aristarain, A. J.: Ice core evidence for a 20th century decline of sea ice in the Bellingshausen Sea, Antarctica, J. Geophys. Res., 115, D23101, doi:10.1029/2010jd014644, 2010.
Blindow, N., Suckro, S., R¨uckamp, M., Braun, M., Schindler, M., Breuer, B., Saurer, H., Simoes, J., and Lange, M.: Geometry and thermal regime of the King George Island ice cap, Antarctica, from GPR and GPS, Ann. Glaciol., 51, 103–109, 2010. Bracegirdle, T. J., Connolley, W. M., and Turner, J.: Antarctic
cli-mate change over the twenty first century, J. Geophys. Res., 113, D03103, doi:10.1029/2007JD008933, 2008.
Carrasco, J. and Gonz´alez, M. (Eds.): Climatolog´ıa de la Pen´ınsula Ant´artica y de la Base Presidente Eduardo Frei Montalva, Di-recci´on Meteorol´ogica de Chile, 2007.
Carrasco, J. F., Bromwich, D. H., and Monaghan, A. J.: Distribution and characteristics of mesoscale cyclones in the Antarctic: Ross Sea eastward to the Weddell Sea, Mon. Weather Rev., 131, 289– 301, 2003.
Chapman, W. L. and Walsh, J. E.: A Synthesis of Antarctic Tem-peratures, J. Climate, 20, 4096–4117, 2007.
Chen, J. L., Wilson, C. R., Blankenship, D., and Tapley, B. D.: Ac-celerated Antarctic ice loss from satellite gravity measurements, Nat. Geosci., 2, 859–862, 2009.
Clark, I. and Fritz, P. J. S. (Eds.): Environmental Isotopes in Hydro-geology, Lewis, Boca Raton, New York, 311 pp., 1997. Cook, A. J., Fox, A. J., Vaughan, D. G., and Ferrigno, J. G.:
Retreat-ing Glacier Fronts on the Antarctic Peninsula over the Past Half-Century, Science, 308, 541–544, doi:10.1126/science.1104235, 2005.
Craig, H.: Isotopic variations in meteoric waters, Science, 133, 1702–1703, doi:10.1126/science.133.3465.1702, 1961. Dansgaard, W.: Stable isotopes in precipitation, Tellus, 16, 436–
De Angelis, H. and Skvarca, P.: Glacier Surge After Ice Shelf Col-lapse, Science, 299, 1560–1562, doi:10.1126/science.1077987, 2003.
Draxler, R. R. and Hess, G. D.: An Overview of the HYSPLIT-4 modelling system for trajectories, dispersion and deposition, Aust. Meterol. Mag., 47, 295–308, 1998.
Gat, J. R.: Oxygen and hydrogen isotopes in the hydro-logical cycle, Annu. Rev. Earth Planet. Sci., 24, 225–262, doi:10.1146/annurev.earth.24.1.225, 1996.
Gillett, N., Kell, T. D., and Jones, P. D.: Regional climate impacts of the Southern Annular Mode, Geophys. Res. Lett., 33, 1–4, 2006. Gillett, N. P., Stone, D. A., Stott, P. A., Nozawa, T., Karpechko, A. Y., Hegerl, G. C., Wehner, M. F., and Jones, P. D.: Attribution of polar warming to human influence, Nat. Geosci., 1, 750–754, 2008.
GNIP Database: http://www-naweb.iaea.org/napc/ih/index.html, last access: 2011.
Hall, B.: Holocene glacial history of Antarctica and the sub-Antarctic islands, Quat. Sci. Rev., 28, 2213–2230, 2009. Hines, K. M., Bromwich, D. H., and Marshall, G. J.: Artificial
surface pressure trends in the NCEP-NCAR reanalysis over the southern ocean and Antarctica, J. Climate, 13, 3940–3952, 2000. HYSPLIT (HYbrid Single-Particle Lagrangian Integrated Trajec-tory) Model access via NOAA ARL READY. NOAA Air Re-sources Laboratory, Silver Spring, MD., available at: http:// www.arl.noaa.gov/ready/hysplit4.html, last access 2011. Ichiyanagi, K., Numaguti, A., and Kato, K.: Interannual
varia-tion of stable isotopes in Antarctic precipitavaria-tion in response to El Nino-Southern Oscillation, Geophys. Res. Lett., 29, 1001, doi:10.1029/2000gl012815, 2002.
IPCC, Solomon, S., Qin, D., Manning, M., Chen, Z., Marquis, M., Averyt, K. B., Tignor, M., and Miller, H. (Eds.): Climate Change 2007: The Physical Science Basis. Contribution of Working Group I to the Fourth Assessment Report of the Intergovern-mental Panel on Climate Change, Cambridge University Press, Cambridge, United Kingdom and New York, USA, 2007. Jouzel, J. and Merlivat, L.: Deuterium and Oxygen 18 in
Precipita-tion: Modeling of the Isotopic Effects during Snow Formation, J. Geophys. Res-Atmos., 89, 1749–1757, 1984.
Kalnay, E., Kanamitsu, M., Kistler, R., Collins, W., Deaven, D., Gandin, L., Iredell, M., Saha, S., White, G., Woollen, J., Zhu, Y., Leetmaa, A., Reynolds, R., Chelliah, M., Ebisuzaki, W., Higgins, W., Janowiak, J., Mo, K. C., Ro-pelewski, C., Wang, J., Jenne, R., and Joseph, D.: The NCEP/NCAR 40-Year Reanalysis Project, Bulletin of the Amer-ican Meteorological Society, 77, 437–471, doi:10.1175/1520-0477(1996)077<0437:TNYRP>2.0.CO;2, 1996.
Kanamitsu, M.: Description of the NMC Global Data Assim-ilation and Forecast System, Weath. Forecast., 4, 335–342, doi:10.1175/1520-0434(1989)004<0335:DOTNGD>2.0.CO;2, 1989.
King, J. C. and Comiso, J. C.: The spatial coherence of interannual temperature variations in the Antarctic Peninsula, Geophys. Res. Lett., 30, 1040, doi:10.1029/2002gl015580, 2003.
Legrand, M. and Mayewski, P.: Glaciochemistry of polar ice cores: A review, Rev. Geophys., 35, 219–243, 1997.
Levitus, S., Antonov, J., and Boyer, T.: Warming of the world ocean, 1955–2003, Geophys. Res. Lett., 32, L02604, doi:10.1029/2004gl021592, 2005.
Marshall, G. J.: Trends in the Southern Annular Mode from obser-vations and Reanalyses, J. Climate, 16, 4134–4143, 2003. Marshall, G. J., Orr, A., van Lipzig, N. P. M., and King, J. C.:
The Impact of a Changing Southern Hemisphere Annular Mode on Antarctic Peninsula Summer Temperatures, J. Climate, 19, 5388–5404, 2006.
Masson-Delmotte, V., Hou, S., Ekaykin, A., Jouzel, J., Aristarain, A., Bernardo, R. T., Bromwich, D., Cattani, O., Delmotte, M., Falourd, S., Frezzotti, M., Gall´ee, H., Genoni, L.,Isaksson, E., Landais, A., Helsen, M. M., Hoffmann, G., Lopez, J., Morgan, V., Motoyama, H., Noone, D., Oerter, H., Petit, J. R., Royer, A., Uemura, R., Schmidt, G. A., Schlosser, E., Simoes, J. C., Steig, E. J., Stenni, B., Stievenard, M., van den Broeke, M. R., van de Wal, R. S. W., van de Berg, W. J., Vimeux, F., and White, J. W. C.: A Review of Antarctic Surface Snow Isotopic Composition: Observations, Atmospheric Circulation, and Isotopic Modeling, J. Climate, 21, 3359–3387, doi:10.1175/2007JCLI2139.1, 2008. Meredith, M. and King, J. C.: Rapid climate change in the ocean west of the Antarctic Peninsula during the second half of the 20th century, Geophys. Res. Lett., 32, L19604, doi:10.1029/2005GL024042, 2005.
Meyer, H., Sch¨onicke, L., Wand, U., Hubberten, H. W., and Friedrichsen, H.: Isotope Studies of Hydrogen and Oxygen in Ground Ice – Experiences with the Equilibration Technique, Isot. Enviro. Healt. S., 36, 133–149, 2000.
Noone, D.: The influence of midlatitude and tropical overturning circulation on the isotopic composition of atmospheric water va-por and Antarctic precipitation, J. Geophys. Res-Atmos., 113, D04102, doi:10.1029/2007jd008892, 2008.
Noone, D. and Simmonds, I.: Sea ice control of water isotope trans-port to Antarctica and implications for ice core interpretation, J. Geophys. Res., 109, D07105, doi:10.1029/2003jd004228, 2004. Peel, D. A., Mulvaney, R., and Davison, B. M.: Stable-Isotope/Air-Temperature relationship in ice cores from Dolleman Island and the Palmer Land Plateau, Antarctic Peninsula, Ann. Glaciol., 10, 130–136, 1988.
Rau, F. and Braun, M.: The regional distribution of the dry-snow zone on the Antarctic Peninsula north of 70S, Ann. Glaciol., 34, 95–100, 2002.
Rayner, N. A., Parker, D. E., Horton, E. B., Folland, C. K., Alexan-der, L. V., Rowell, D. P., Kent, E. C., and Kaplan, A.: Global analyses of sea surface temperature, sea ice, and night marine air temperature since the late nineteenth century, J. Geophys. Res-Atmos., 108, 4407, doi:10.1029/2002jd002670, 2003.
Rignot, E., Casassa, G., Gogineni, S., Kanagaratnam, P., Kra-bill, W., Pritchard, H., Rivera, A., Thomas, R., Turner, J., and Vaughan, D.: Recent ice loss from the Fleming and other glaciers, Wordie Bay, West Antarctic Peninsula, Geophys. Res. Lett., 32, L07502, doi:10.1029/2004GL021947, 2005.
Rozanski, K., Aragu´as-Aragu´as, L., and Gonfiantini, R.: Isotopic Patterns in Modern Global Precipitation, in: Climate Change in Continental Isotopic Records, edited by: Swart, P. K., Lohman, K. C., McKenzie, J., and Savin, S., American Geophysical Union, Washington, USA, 1993.
R¨uckamp, M., Blindow, N., Suckro, S., Braun, M., and Humbert, A.: Dynamics of the ice cap on King George Island, Antarctica: field measurements and numerical simulations, Ann. Glaciol., 51, 80–90, 2010.
erod-ing West Antarctic Ice Sheet, Geophys. Res. Lett., 31, L23402, doi:10.1029/2004GL021106, 2004.
Sime, L. C., Marshall, G. J., Mulvaney, R., and Thomas, E. R.: Interpreting temperature information from ice cores along the Antarctic Peninsula: ERA40 analysis, Geophys. Res. Lett., 36, L18801, doi:10.1029/2009gl038982, 2009.
Sim˜oes, J. C., Bremer, U. F., Aquino, F. E., and Ferron, F. E.: Mor-phology and variations of glacial drainage basins in the King George Island ice field, Antarctica, Ann. Glaciol., 29, 220–224, 1999.
Sim˜oes, J., Ferron, F., Bernardo, R., Aristarain, A., Stievenard, M., Pourchet, M., and Delmas, R.: Ice core study from the King George Island, South Shetlands, Antarctica, Pesquisa Ant´artica Brasileira, 4, 9–23, 2004.
Smith, S. R., Legler, D. M., and Verzone, K. V.: Quantifying uncer-tainties in NCEP reanalyses using high-quality research vessel observations, J. Climate, 14, 4062–4072, 2001.
Steig, E. J., Schneider, D. P., Rutherford, S. D., Mann, M. E., Comiso, J. C., and Shindell, D. T.: Warming of the Antarctic ice-sheet surface since the 1957 International Geophysical Year, Nature, 457, 459–462, 2009.
Stenni, B., Masson-Delmotte, V., Selmo, E., Oerter, H., Meyer, H., R¨othlisberger, R., Jouzel, J., Cattani, O., Falourd, S., Fischer, H., Hoffmann, G., Iacumin, P., Johnsen, S. J., Minster, B., and Udisti, R.: The deuterium excess records of EPICA Dome C and Dronning Maud Land ice cores (East Antarctica), Quat. Sci. Rev., 29, 146–159, 2010.
Tedesco, M., Abdalati, W., and Zwally, H. J.: Persistent sur-face snowmelt over Antarctica (1987–2006) from 19.35 GHz brightness temperatures, Geophys. Res. Lett., 34, L18504, doi:10.1029/2007gl031199, 2007.
Thomas, E. R. and Bracegirdle, T. J.: Improving ice core interpre-tation using in situ and reanalysis data, J. Geophys. Res., 114, D20116, doi:10.1029/2009jd012263, 2009.
Thomas, E. R., Marshall, G. J., and McConnell, J. R.: A doubling in snow accumulation in the western Antarctic Peninsula, Geophys. Res. Lett., 35, 1–5, L01706, doi:10.1029/2007GL032529, 2008. Thompson, D. W. J. and Solomon, S.: Interpretation of Recent Southern Hemisphere Climate Change, Science, 296, 895–899, doi:10.1126/science.1069270, 2002.
Turner, J., Colwell, S. R., Marshall, G. J., Lachlan-Cope, T. A., Carleton, A. M., Jones, P. D., Lagun, V., Reid, P. A., and Iagov-kina, S.: The SCAR READER project: Toward a high-quality database of mean Antarctic meteorological observations, J. Cli-mate, 17, 2890–2898, 2004.
Turner, J., Colwell, S. R., Marshall, G. J., Lachlan-Cope, T. A., Carleton, A. M., Jones, P. D., Lagun, V., Reid, P. A., and Iagovk-ina, S.: Antarctic climate change during the last 50 years, Int. J. Climatol., 25, 279–294, 2005.
Turner, J., Bindschadler, R., Convey, P., di Prisco, G., Fahrbach, E., Gutt, J., Hodgson, D., Mayewski, P., and Summerhayes, C. (Eds.): Antarctic Climate Change and the Enviroment, 1st edn., Scientific Commitee on Antarctic Research, Cambridge, 2009. Uemura, R., Matsui, Y., Yoshimura, K., Motoyama, H., and
Yoshida, N.: Evidence of deuterium excess in water vapor as an indicator of ocean surface conditions, J. Geophys. Res., 113, D19114, doi:10.1029/2008JD010209, 2008.
van den Broeke, M., van de Berg, W. J., and van Meij-gaard, E.: Snowfall in coastal West Antarctica much greater than previously assumed, Geophys. Res. Lett., 33, L02505, doi:10.1029/2005gl025239, 2006.
van Lipzig, N. P. M., King, J. C., Lachlan-Cope, T. A., and van den Broeke, M. R.: Precipitation, sublimation, and snow drift in the Antarctic Peninsula region from a regional atmospheric model, J. Geophys. Res., 109, D24106, doi:10.1029/2004jd004701, 2004. van Ommen, T. D. and Morgan, V.: Calibrating the ice core pale-othermometer using seasonality, J. Geophys. Res-Atmos., 102, 9351–9357, 1997.
Vaughan, D. G., Marshall, G. J., Connolley, W. M., Parkinson, C., Mulvaney, R., Hodgson, D. A., King, J. C., Pudsey, C. J., and Turner, J.: Recent Rapid Regional Climate Warming on the Antarctic Peninsula, Climatic Change, 60, 243–274, 2003. Weatherly, J. W., Walsh, J. E., and Zwally, H. J.: Antarctic Sea Ice
Variations and Seasonal Air-Temperature Relationships, J. Geo-phys. Res-Oceans, 96, 15119–15130, 1991.
Wen, J. H., Kang, J. C., Han, J. K., Xie, Z. C., Liu, L. B., and Wang, D. L.: Glaciological studies on the King George Island ice cap, South Shetland Islands, Antarctica, Ann. Glaciol., 27, 105–109, 1998.