Genome-wide identification of genetic
determinants for the cytotoxicity
of perifosine
Wei Zhang,1Wanqing Liu,1Enrique Poradosu2and Mark J. Ratain1,3,4*
1Section of Hematology/Oncology, Department of Medicine, The University of Chicago, Chicago, IL 60637, USA 2Keryx Biopharmaceuticals, Inc., New York, NY 10022, USA
3Committee on Clinical Pharmacology and Pharmacogenomics, The University of Chicago, Chicago, IL 60637, USA 4Cancer Research Center, The University of Chicago, Chicago, IL 60637, USA
*Correspondence to: Tel:þ1 773 702 4400; Fax:þ1 773 702 3969; E-mail: mratain@medicine.bsd.uchicago.edu
Date received (in revised form): 17th June, 2008
Abstract
Perifosine belongs to the class of alkylphospholipid analogues, which act primarily at the cell membrane, thereby targeting signal transduction pathways. In phase I/II clinical trials, perifosine has induced tumour regression and caused disease stabilisation in a variety of tumour types. The genetic determinants responsible for its cytotoxicity have not been comprehensively studied, however. We performed a genome-wide analysis to identify genes whose expression levels or genotypic variation were correlated with the cytotoxicity of perifosine, using public data-bases on the US National Cancer Institute (NCI)-60 human cancer cell lines. For demonstrating drug specificity, the NCI Standard Agent Database (including 171 drugs acting through a variety of mechanisms) was used as a control. We identified agents with similar cytotoxicity profiles to that of perifosine in compounds used in the NCI drug screen. Furthermore, Gene Ontology and pathway analyses were carried out on genes more likely to be perifosine specific. The results suggested that genes correlated with perifosine cytotoxicity are connected by certain known pathways that lead to the mitogen-activated protein kinase signalling pathway and apoptosis. Biological processes such as ‘response to stress’, ‘inflammatory response’ and ‘ubiquitin cycle’ were enriched among these genes. Three single nucleotide polymorphisms (SNPs) located inCACNA2D1andEXOC4were found to be correlated with perifosine cytotoxicity. Our results provided a manageable list of genes whose expression levels or genotypic variation were strongly correlated with the cytotoxcity of perifosine. These genes could be targets for further studies using candidate-gene approaches. The results also provided insights into the pharmacodynamics of perifosine.
Keywords:perifosine, cytotoxicity, NCI-60, gene expression, genotype
Introduction
Perifosine (NSC639966; Figure 1) belongs to the class of phospholipid analogues or alkylphospholi-pids, which have anticancer activity in both in vitro
(cell culture studies) and in vivo (animal model-based studies) model systems.1,2 Functionally, perifosine resembles natural phospholipids and acts primarily at the cell membrane, thereby targeting
cells,4 HeLa cells3 and prostate carcinoma cells.2 Clinical studies have focused on daily oral dosing (after a loading dose), with two partial responses noted in soft tissue sarcoma (STS) patients, including one patient each with chondrosarcoma and leiomyo-sarcoma,6,7 as well as patients with renal cell carci-nomas.7 Furthermore, the phase II studies in STS patients were not designed to look for disease stabil-isation, a potentially important endpoint for drugs targeting signal transduction pathways.8
The genetic determinants that are responsible for perifosine’s activity have not been comprehensively studied, however. Traditional candidate-gene approaches require a priori knowledge and the selection of a small number of candidate genes for hypothesis testing, while an in silico genome-wide approach could be used to identify any associated genes as potential candidates in an unsupervised way. The US National Cancer Institute (NCI)-60 resources have allowed genome-wide studies using a panel of 60 human cancer cell lines.9 In addition to the genetic determinants, the NCI-60 resources also provide tools such as COMPARE10to identify com-pounds that show correlated cytotoxic patterns with a particular agent. These compounds, for example, could be potential agents for enhancing the response to a candidate drug or as a substitute for that drug.
The NCI-60 human cancer cell lines have been used in anti-cancer drug screens conducted by the NCI since the late 1980s.9 The cell lines represent nine distinct tumour types: leukaemia, colon, lung, brain, renal, melanoma, ovarian, breast and prostate. The Developmental Therapeutics Program (DTP) at NCI11has maintained a database for the cytotox-icity data, as represented by the GI50 (the
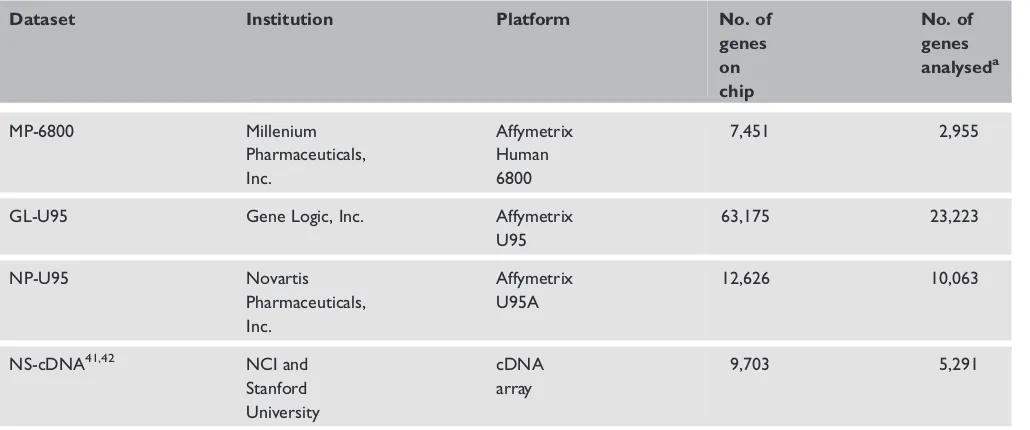
concentration required to inhibit cell growth by 50 per cent) on .40,000 cytotoxic agents, including perifosine.12 A handful of gene expression datasets using high-throughput platforms such as the Affymetrix oligonucleotide microarrays and cDNA arrays of the untreated NCI-60 cell lines are now publicly available at the DTP/NCI website (Table 1). Recently, the NCI-60 cell lines were gen-otyped for 120,000 single nucleotide polymorph-ism (SNP) markers using the Affymetrix Human 125K Mapping Array manufacturers details.13 By associating gene expression or SNP genotypes in untreated NCI-60 cell lines, investigators have been able to predict the chemosensitivity of various cytotoxic compounds.14 – 16 Here, we report a list of candidate genes whose expression levels or genotypic variation were found to be strongly correlated with the cytotoxicity of perifosine using these publicly available NCI-60 databases. The genes identified could be studied further using a candidate-gene approach. They also could provide new insights into the pharmacodynamics of perifosine.
Materials and methods
Cytotoxicity dataThe 60 NCI-60 human cancer cell lines were orig-inally exposed to .40,000 compounds at NCI/ NIH and outside laboratories. The growth inhibi-tory effects of each compound were measured for each cell line and reported as the GI50 (for details,
see the DTP/NCI website17) and maintained in the DTP/NCI online databases. Cytotoxicity data on perifosine (NSC639966) and other agents were obtained as the normalised – log10[GI50] values
(released in September 2005). The NSC numbers and common names for the standard agents were retrieved from the DTP/NCI website.
COMPARE analysis
The COMPARE software10,18,19 maintained at the DTP/NCI, was used to screen .40,000 synthetic or natural compounds for agents that showed corre-lated cell growth (GI50) patterns with that of
peri-fosine. COMPARE generates rank-ordered lists of compounds based on the similarities of cytotoxicity
Figure 1. The chemical structure of perifosine (NSC639966).
Molecular formula: C25H52NO4P; Chemical name: piperidinium,
patterns. Every compound from one of several specially prepared databases is ranked for similarity of its in vitro cell growth pattern to the in vitro cell growth pattern of a selected seed or probe com-pound (ie perifosine). Top-ranking agents based on Pearson correlation coefficient r, whose GI50
pat-terns correlated with that of perifosine, were reported by the software. To control false corre-lations due to small sample size, the minimum number of cell lines in common for two com-pounds to be included in the calculation was 50. We further set the cut-off for COMPARE analysis at jrj¼0.6 (equivalent to nominal p,0.000001, assuming 40,000 compounds and n¼60, Bonferroni corrected p,0.05).
NCI-60 microarray expression datasets
The NCI-60 microarray expression datasets (released in August 2005) were downloaded from the DTP/ NCI Molecular Target Databases.20 These datasets comprise gene expression data on untreated NCI-60 cell lines using different microarray platforms (Table 1). Genes or probe sets that had missing data in more than six cell lines (10 per cent) were not included in the final analysis dataset.
NCI-60 SNP genotyes
The genotype calls for 125,937 SNPs in 58 NCI-60 cell lines were to be downloaded from the DTP/NCI website using the Affymetrix Human 125K Mapping array.13 We removed uninformative SNPs, such as those with identical genotypes across all cell lines or those with missing data in more than six cell lines (10 per cent). Only SNP markers with at least two data points per genotype were included in the association studies. This left 34,040 highly informative SNPs in the final analysis dataset. Three exploratory genetic models (additive, dominant, recessive) were used to evaluate the association between genotype and cytotoxicity. Given the genotypes of a SNP marker (AA, AB, BB), the genotypes were encoded as (AA¼0, AB¼1, BB¼2) in the additive model, (AA/ AB¼1, BB¼0) in the dominant model and (AA/AB¼0, BB¼1) in the recessive model.
Identifying associated copy number alterations
Data on copy number alterations in the NCI-60 cell lines as reported by Garraway and colleagues13 were downloaded from the DTP/NCI website.
Table 1. NCI-60 microarray expression datasets
Dataset Institution Platform No. of
genes on chip
No. of genes
analyseda
MP-6800 Millenium
Pharmaceuticals, Inc.
Affymetrix Human 6800
7,451 2,955
GL-U95 Gene Logic, Inc. Affymetrix
U95
63,175 23,223
NP-U95 Novartis
Pharmaceuticals, Inc.
Affymetrix U95A
12,626 10,063
NS-cDNA41,42 NCI and
Stanford University
cDNA array
9,703 5,291
a
Linear regression model
We performed genome-wide associations between the gene expression (or genotype) and cytotoxicity data. Pearson correlation coefficients and the associ-ated p-values were computed using a linear regression model, which was implemented as the lm function in the R Statistical Package.21 Specifically, the cytotoxicity, as represented by – log10[GI50], was
modelled as dependent on either gene expression or genotype. To adjust for multiple tests, the false dis-covery rate (FDR) was controlled using the Benjamini and Hochberg step-up FDR procedure22 (FDRBH). An FDR cut-off of 10 per cent was used
to identify candidates for further analyses.
Associations with standard agents
Associations between the identified genes and the cytotoxicity data on the 171 anti-cancer agents in the NCI Standard Agent Database23 were per-formed to evaluate perifosine specificity for our gene list. The standard agents cover a variety of mechanisms, besides being phospholipid analogues, and were originally determined by Boyd.24 The same cut-off (FDRBH,0.10) was used to
deter-mine if an identified gene was associated signifi-cantly with any standard agents. The genes that
showed no significant associations with any of the 171 standard agents using any dataset were denoted ‘perifosine specific’. Genes that showed associations with any of the 171 standard agents using any dataset were denoted ‘non-specific’.
Gene ontology and pathway analyses
We used Onto-Express and Pathway-Express25 – 27 to search enriched biological processes and known physiological pathways among the perifosine-specific genes from the Gene Ontology (GO)28 and Kyoto Encyclopaedia of Genes and Genomes (KEGG) databases.29,30 GO terms or KEGG path-ways that were over-represented relative to the cor-responding analysis sets (two hits or more, binomial test at FDRBH,0.05) were called ‘enriched’ in
our gene list.
STS expression database
The identified perifosine-specific genes were queried against a STS expression database, which characterised eight gastrointestinal stromal tumours, eight monophasic synovial sarcomas, four liposarco-mas, one myxoid, 11 leiomyosarcoliposarco-mas, eight malignant fibrous histiocytomas and two benign peripheral nerve sheath tumours (Schwannoma).31
Table 2. Agents correlated with the GI50values of perifosine, as reported by COMPARE (r.0.6)
NSC# r Chemical name
605583 0.81 Miltefosin C; choline, hexadecyl hydrogen phosphate, inner salt
643826 0.75 Choline, hydroxide, 3-methoxy-2-[methyl(octadecyl)amino]propyl hydrogen phosphate, inner salt
643828 0.68 Choline, hydroxide, 2-methoxy-3-[methyl(octadecyl)amino]propyl hydrogen phosphate, inner salt
324368 0.68 Edelfosine; 1-octadecyl-2-methylphosphorylcholine
643827 0.68 Choline, hydroxide, 3-methoxy-1-[methyl(octadecyl)amino]-2-propyl hydrogen phosphate, inner salt
18268 0.65 Actinomycin D
678144 0.62 4H-1,3,6,2-dioxazaphosphocinium, 4-hexadecyltetrahydro- 2,6,6-trimethyl-, bromide, 2-oxide
337591 0.62 ES 12H; choline, hydroxide, 3-(dodecyloxy)propyl hydrogen phosphate, inner salt
87222 0.62 Actinomycin C3
266763 0.61 2-Propenamide,
Table 3a. Genes with expression levels specifically associated with the cytotoxicity of perifosine (FDRBH,0.10)
Gene symbol Gene title ra p Response
GL-U95
REG4 Regenerating islet-derived family, member 4
20.58 1.3E-06 Sensitivity
SLCO4A1 Solute carrier organic anion
transporter family, member 4A1
20.52 2.3E-05 Sensitivity
RPL18A Ribosomal protein L18a 20.50 4.7E-05 Sensitivity
OAZ2 Ornithine decarboxylase antizyme 2 0.53 1.6E-05 Resistance
DZIP3 Zinc finger DAZ-interacting protein 3 0.58 1.5E-06 Resistance
NP-U95
STK39 Serine threonine kinase 39 (STE20/
SPS1 homologue, yeast)
20.48 1.2E-04 Sensitivity
FAM32A Family with sequence similarity 32,
member A
20.46 2.5E-04 Sensitivity
MAPKAPK3 Mitogen-activated protein
kinase-activated protein kinase 3
20.45 3.0E-04 Sensitivity
RAB8A RAB8A, member Ras oncogene family 20.44 4.7E-04 Sensitivity
STK17B Serine/threonine kinase 17b
(apoptosis-inducing)
20.44 5.8E-04 Sensitivity
TCF3 Transcription factor 3 (E2A
immunoglobulin enhancer binding factors E12/E47)
20.44 5.8E-04 Sensitivity
PARP4 Poly (ADP-ribose) polymerase family,
member 4
20.43 6.1E-04 Sensitivity
PSMA2 Proteasome (prosome, macropain)
subunit, alpha type, 2
20.43 6.3E-04 Sensitivity
DGKE Diacylglycerol kinase, epsilon 64 kDa 20.43 6.9E-04 Sensitivity
PVT1 Pvt1 oncogene homologue, MYC
activator (mouse)
0.42 1.0E-03 Resistance
ELOVL2 Elongation of very long chain fatty
acids (FEN1/Elo2, SUR4/Elo3, yeast)-like 2
0.42 9.5E-04 Resistance
SMARCA3 SWI/SNF-related, matrix-associated,
actin-dependent regulator of chromatin, subfamily a, member 3
0.42 9.3E-04 Resistance
USP6 TL132 protein 0.43 7.1E-04 Resistance
IGF1R Insulin-like growth factor 1 receptor 0.44 5.3E-04 Resistance
Genes differentially expressed among different sar-comas were provided by the database using signifi-cance analysis of microarrays (SAM).32
Results
COMPARE analysis
At p,0.05 after Bonferroni correction, the COMPARE software10,18 identified 24 agents with
positive correlation with the cytotoxicity pattern of perifosine. By contrast, no agents with significant negative correlation were identified. Table 2 shows some top-ranking agents (r.0.6) with well-characterised chemical names. Among them, some clearly belong to the same drug class as perifosine: miltefosine (NSC605583, r¼0.81) and edelfosine (NSC324368, r¼0.68). Edelfosine was further used as a representative of phospholipid analogues
Table 3a. Continued
Gene symbol Gene title ra p Response
NFATC4 Nuclear factor of activated T-cells,
cytoplasmic, calcineurin-dependent 4
0.44 5.4E-04 Resistance
POU4F1 POU domain, class 4, transcription
factor 1
0.44 5.1E-04 Resistance
PDLIM3 PDZ and LIM domain 3 0.44 5.0E-04 Resistance
CBS Cystathionine beta-synthase 0.44 4.4E-04 Resistance
ARMCX2 Armadillo repeat containing, X-linked 2 0.45 3.9E-04 Resistance
OPHN1 Oligophrenin 1 0.46 2.5E-04 Resistance
ZNF609 Zinc finger protein 609 0.46 2.3E-04 Resistance
ATN1 Atrophin 1 0.47 1.5E-04 Resistance
DZIP3 Zinc finger DAZ-interacting protein 3 0.48 1.3E-04 Resistance
PPBPL2 Pro-platelet basic protein-like 2 0.49 9.3E-05 Resistance
MPDZ Multiple PDZ domain protein 0.53 1.3E-05 Resistance
SKIV2L Superkiller viralicidic activity 2-like
(Saccharomyces cerevisiae)
0.56 4.6E-06 Resistance
GABRG3 Gamma-aminobutyric acid (GABA) A
receptor, gamma 3
0.60 4.9E-07 Resistance
NS-cDNA
ATF2 Activating transcription factor 2 20.56 4.8E-06 Sensitivity
TRA2A Transformer-2 alpha 20.44 8.3E-04 Sensitivity
ETS2 V-ets erythroblastosis virus E26 oncogene homologue 2 (avian)
20.44 5.3E-04 Sensitivity
UBE2D3 Ubiquitin-conjugating enzyme E2D 3
(UBC4/5 homologue, yeast)
20.42 8.5E-04 Sensitivity
ANP32A Acidic (leucine-rich) nuclear
phosphoprotein 32 family, member A
0.49 1.6E-04 Resistance
a
Pearson correlation coefficients were calculated by linear regression in which cytotoxicity ( – log10[GI50]) was dependent on gene expression. A positiver-value indicates
to verify the associations detected from perifosine (Supplementary Table 1).
Genes with expression associated with perifosine cytotoxicity and GO and pathway analyses
Table 3a lists the perifosine-specific genes identified from the microarray expression datasets. The non-specific genes are listed in Supplementary Table 2. The GO and pathway analyses were then carried out to find any enriched biological processes and known KEGG pathways among the perifosine-specific genes (Table 4).
At FDRBH,0.10, no genes were associated
with perifosine cytotoxicty using the MP-6800 dataset, although at a more lenient cutoff (FDRBH,0.25), one gene, FABP5 (encoding
fatty acid binding protein 5), could be described as being significantly correlated with the sensitivity response to perifosine. The expression of FABP5
was denoted as non-specific, as it was also associ-ated with one standard agent. For the two Affymetrix U95 series of microarray datasets (GL-U95 and NP-U95), one gene, DZIP3 (encod-ing zinc f(encod-inger DAZ-interact(encod-ing protein 3), was correlated with the resistance response to perifosine using both datasets (FDRBH,0.10). DZIP3 was
denoted as perifosine specific, as it showed no associations with any standard agents. In total, ten genes were found to be correlated with perifosine cytotoxicity (FDRBH,0.10) using the GL-U95
dataset: five each with sensitivity and resistance. Of these, five did not show associations with any stan-dard agents. The GO biological process ‘ubiquitin cycle’ was enriched among all ten genes (two hits or more, binomial test at FDRBH,0.05);
however, it was not significant among the five perifosine-specific genes. No KEGG pathways were enriched among the identified genes. By contrast, 79 genes were found to be correlated with perifo-sine cytotoxicity (FDRBH,0.10) in the NP-U95
dataset. Among them, 30 genes were correlated with sensitivity, while 49 genes were correlated with resistance. Five GO biological processes were enriched among the 27 perifosine-specific genes (two hits or more, binomial test, FDRBH,0.05).
No KEGG pathways were enriched among the identified genes. Using the NS-cDNA dataset, 23 genes were identified, with significant associations with perifosine cytotoxicity (FDRBH,0.10).
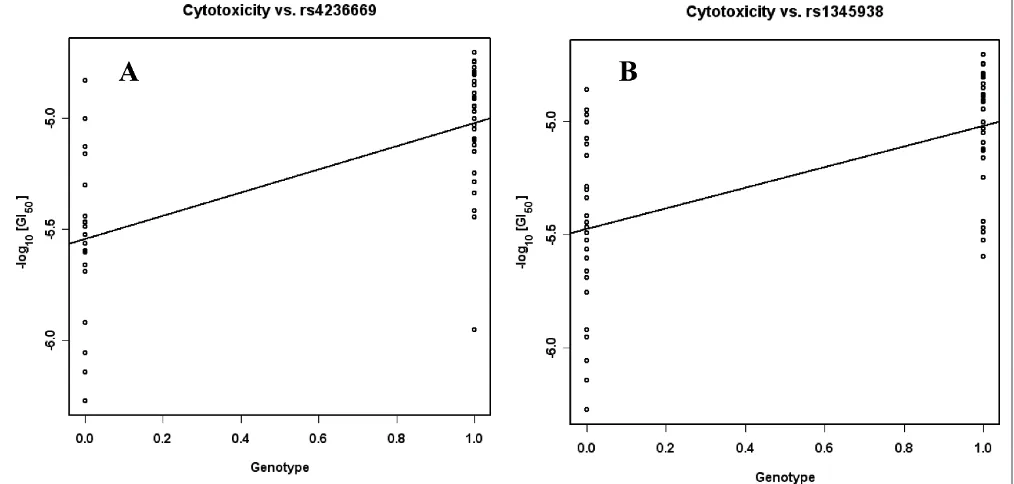
Table 3b. SNPs associated with the cytotoxicity of perifosine (FDRBH,0.10)
dbSNPa Gene
locus
Location r p Model
rs4236669 CACNA2D1 Intron 0.64 2.8E-07 Recessive
rs1468400 CACNA2D1 Intron 0.62 8.8E-07 Recessive
rs1345938 EXOC4 Intron 0.58 2.6E-06 Recessive
a
dbSNP Build 126 (May, 2006).
Table 4. Enriched Gene Ontology biological processes among the
perifosine-specific genes
GO ID Process p Gene
symbol
NP-U95
GO:0006950 Response to stress 3.8E-04 STK39 MAPKAPK3
GO:0006511 Ubiquitin-dependent protein catabolism
7.9E-04 PSMA2 USP6
GO:0006954 Inflammatory response
4.3E-03 NFATC4 PARP4
GO:0006512 Ubiquitin cycle 6.5E-03 DZIP3 USP6
GO:0006366 Transcription from RNA polymerase II promoter
7.8E-03 PPBPL2 NFATC4
NS-cDNA
GO:0006355 Regulation of transcription, DNA-dependent
Among them, 12 genes were correlated with sensitivity and 11 genes were correlated with resistance. One GO biological process, ‘DNA-dependent regulation of transcription’, was enriched among the five perifosine-specific genes. No KEGG pathways were enriched among the identified genes.
SNPs associated with perifosine cytotoxicity
Three SNPs under the recessive model were found to be significantly correlated with the resistance response to perifosine (FDRBH,0.10; Table 3b,
Figure 2). These included two SNPs located in the introns of CACNA2D1 (calcium channel, voltage-dependent, alpha 2/delta subunit 1). The third SNP is located in an intron of EXOC4 (exocyst complex component 4). Using both additive and dominant models, these three SNPs did not show significant associations with any standard agents. By contrast, rs1468400 in CACNA2D1 was correlated with one standard agent under the reces-sive model.
Copy number alterations and perifosine cytotoxicity
At FDRBH,0.10, no copy number alterations or
gene amplifications were found to be correlated with perifosine cytotoxicity.
Querying gene expression patterns in STS cells
Perifosine-specific genes in Table 3a were queried against the STS expression database.31 Genes that are either up- or downregulated in each type of tumour are listed in Supplementary Table 3. Six genes (STK17B, IGF1R, POU4F1, CBS, MPDZ,
EST2) were included in the database. With the exception of EST2, the other five genes were found to be up-or downregulated in certain STS cells.
Discussion
We performed a genome-wide analysis to identify genes whose expression levels were significantly
Figure 2. SNPs specifically associated with the cytotoxicity of perifosine in the recessive model. AA/AB¼0; BB¼1. (A) Genotypes
associated with perifosine’s activity, as represented by its cytotoxicity (GI50). Four independent gene
expression datasets of untreated NCI-60 cancer cell lines (Table 1), using different microarray plat-forms, were used to evaluate the association between cytotoxcity and gene expression. We further focused on the identified genes that are more likely to be perifosine specific (Table 3). Previous studies, using traditional candidate-gene approaches, have suggested that perifosine inhibits, or otherwise modifies, signal transduction through a number of different pathways, including MAPK and Akt.2 – 4 An in silico genome-wide scan without a priori knowledge in this work provided more candidate genes in an unsupervised way.
The use of COMPARE10,18 allowed us to identify compounds that have similar cell growth patterns with perifosine (Table 2). To limit the effects due to factors such as small sample size and multiple comparisons, we took measures to control potential false positives. Compounds including those belonging to the same drug class as perifosine (such as miltefosine and edelfosine) were among the top-ranking agents with strong positive correlation coefficients (r.0.6, p,0.05 after Bonferroni correction). Not surprisingly, a majority of the perifosine-specific genes were also significantly associated (nominal p,0.05) with edelfosine, which was used to represent phospholi-pid analogues (Supplementary Table 1). The remaining few genes showed at least marginal associations (nominal p,0.10) with edelfosine. This suggests that our list of perifosine-specific genes also contains a set of common genes that determines the pharmacodynamics of this drug class. To our knowledge, this is the most compre-hensive list of associated genes for phospholipid analogues. The COMPARE program also retrieved drugs acting through different mechan-isms (Table 2). The shared cytotoxicity profiles could be explained by the common pathways between these drugs and perifosine. For example, the correlation with actinomycin, which inhibits transcription by binding DNA at the transcription initiation complex and preventing elongation by
RNA polymerase,33 could be explained via general transcriptional modulation (Table 4).
We wanted to know the interactions among the perifosine-specific genes with known biological processes or pathways. Searches against the GO and KEGG databases identified six biological processes that were enriched among the perifosine-specific genes (Table 4). Among them, the biological process of the ubiquitin cycle was identified with
DZIP3 and USP6. Notably, DZIP3 was signifi-cantly associated with resistance to perifosine, using two of the Affymetrix U95 series of arrays (Table 3a). The function of DZIP3, a ubiquitin ligase,34 in the pharmacodynamics of perifosine has not been investigated, although, given the potential of ubiquitin ligases as anti-cancer targets,35,36
DZIP3 and the role of ubiquitin-dependent protein degradation could be an interesting candi-date for further studies. The perifosine-specific genes also over-represented such biological pro-cesses as ‘response to stress’ and ‘inflammatory response’, which are more evidently related to drug response. Although no particular known KEGG pathways were found to be enriched among the perifosine-specific genes, many of these genes could be connected by a network of known physiological pathways (Figure 3) which have inter-actions with perifosine through known mechanisms that lead to the MAPK signalling pathway and apoptosis. For example, perifosine can affect the phosphatidylinositol signalling pathway, Akt signal-ling pathway and MAPK signalsignal-ling pathway.37,38 Some of our identified perifosine-specific genes are known to be involved in these pathways; for example, DGKE (the phosphatidylinositol signal-ling pathway) andMAPKAPK3 (the MAPK signal-ling pathway). Furthermore, the gene product of
signalling pathways); and signal transduction (MAPK, Wnt, vascular endothelial growth factor and phosphatidylinositol signalling pathways).Given the fact that perifosine, as well as edelfosine, signifi-cantly affects the pathway of extrinsic apoptosis,38 –
40
our findings showed that while perifosine was involved in such pathways as the MAPK and phos-phatidylinositol signalling pathways that can lead to apoptosis,2 – 4 it could also influence other inter-connected pathways, such as those in cell communication.
Variation in DNA sequence is partially respon-sible for gene expression;41,42 therefore, we per-formed an association test between SNP genotypes13 and the cytotoxicity of perifosine. Different models (additive, dominant and recessive) were used to explore the genetic relationships between genotypes and cytotoxicity. Two SNPs (rs4236669 in CACNA2D1 and rs1345938 in
EXOC4) showed strong perifosine-specific associ-ations under the recessive model (Figure 2). Since the expression of CACNA2D1was not found to be significantly correlated with perifosine cytotoxicity, the relationship between gene expression and its genotypes is not straightforward. Given that
CACNA2D1 is involved in the MAPK signalling pathway,29 however, these SNPs could be interest-ing candidates for further studies.
Studies have shown that alkylphospholipids are a class of anti-cancer agents that perturb signal trans-duction pathways through inhibition of MAPK and Akt phosphorylation.2 – 4 These drugs have shown consistent clinical anti-cancer activity, but their systemic application has been limited by tox-icity. Therefore, one impact of our list of genes could be to help to identify better targeted cancer types for perifosine. One potential candidate, for example, could be multiple myeloma, given the
Figure 3. Some perifosine-specific genes are connected by common pathways leading to MAPK signalling pathway and apoptosis.
fact that the PSMA2 gene (associated with the sensitivity response to perifosine; Table 3a) was found to be highly upregulated in multiple myeloma cells.43 In fact, perifosine activity has been reported in myeloma preclinically.4,39 A recent multicentre phase II study of perifosine alone and in combination with dexamethasone for patients with relapsed or relapsed/refractory mul-tiple myeloma suggested promising activity (eg stabilisation of disease) as combination therapy, with manageable toxicity.44 Our results thus warrant further clinical trials for this tumour type. There is some evidence of perifosine having activity in STS, with responses reported in chon-drosarcoma and leiomyosarcoma.6,7 Based on these studies, continued assessment of perifosine in STS also appears to be warranted. Given the heterogen-eity of STS, it is a plausible hypothesis that there is an identifiable subset of tumours that will respond to this agent.45 A search against a STS expression database31 further indicated that a type of leiomyosarcomas that does not express calponin showed the best correlated pattern of gene expression with our perifosine-specific genes (Supplementary Table 4). For example, STK17B
(associated with the sensitivity response to perifo-sine; Table 3a) is significantly upregulated in this tumour type, while POU4F1 and MPDZ (associ-ated with the resistance response to perifosine; Table 3a) are significantly downregulated in this tumour type, suggesting that this type of leiomyo-sarcoma could be a better target for perifosine. As the available STS expression dataset contains only
5,000 genes,31 a more comprehensive dataset could provide more insights.
In summary, we used the public NCI-60 resources to identify a list of genes potentially rel-evant to the cytotoxicity of perifosine. Although there were some limitations; such as the gene cov-erage of the current microarray platforms, relatively small sample size of 60 cell lines and severity of multiple comparisons, our results not only con-firmed that perifosine is involved in some known pathways (eg MAPK signalling) that can lead to apoptosis, but also suggested that it could influence some new candidate genes and pathways. Our
unsupervised in silico analyses, therefore, could provide targeted candidates that are globally associ-ated with the perifosine response for further studies.
Acknowledgments
This research was supported by a grant from Keryx Biopharmaceuticals, Inc., New York. The authors declare competing financial interests. E.P. is an employee of Keryx Biopharmaceuticals, Inc., New York. His employment with Keryx could be construed as a conflict of interest because he may indirectly benefit from sales of their products.
References
1. Berdel, W.E., Bausert, W.R., Fink, U.et al. (1981), ‘Anti-tumor action
of alkyl-lysophospholipids (Review)’, Anticancer Res. Vol. 1,
pp. 345 – 352.
2. Kondapaka, S.B., Singh, S.S., Dasmahapatra, G.P. et al. (2003),
‘Perifosine, a novel alkylphospholipid, inhibits protein kinase B
acti-vation’,Mol. Cancer Ther. Vol. 2, pp. 1093 – 1103.
3. Ruiter, G.A., Zerp, S.F., Bartelink, H.et al. (2003), ‘Anti-cancer
alkyl-lysophospholipids inhibit the phosphatidylinositol 3-kinase-Akt/PKB
survival pathway’,Anticancer DrugsVol. 14, pp. 167 – 173.
4. Hideshima, T., Catley, L., Yasui, H.et al. (2006), ‘Perifosine, an oral
bio-active novel alkylphospholipid, inhibits Akt and induces in vitro and in
vivo cytotoxicity in human multiple myeloma cells’,BloodVol. 107, pp.
4053 – 4062.
5. Ruiter, G.A., Zerp, S.F., Bartelink, H. et al. (1999),
‘Alkyl-lysophospholipids activate the SAPK/JNK pathway and enhance
radiation-induced apoptosis’,Cancer Res. Vol. 59, pp. 2457 – 2463.
6. Bailey, H.H., Mahoney, M.R., Ettinger, D.S. et al. (2006), ‘Phase II
study of daily oral perifosine in patients with advanced soft tissue
sarcoma’,CancerVol. 107, pp. 2462 – 2467.
7. Van Ummersen, L., Binger, K., Volkman, J.et al. (2004), ‘A phase I trial
of perifosine (NSC 639966) on a loading dose/maintenance dose
sche-dule in patients with advanced cancer’, Clin. Cancer Res. Vol. 10,
pp. 7450 – 7456.
8. Michaelis, L.C. and Ratain, M.J. (2006), ‘Measuring response in a
post-RECIST world: From black and white to shades of grey’,Nat. Rev.
CancerVol. 6, pp. 409 – 414.
9. Shoemaker, R.H. (2006), ‘The NCI60 human tumour cell line
antican-cer drug screen’,Nat. Rev. CancerVol. 6, pp. 813 – 823.
10. Zaharevitz, D.W., Holbeck, S.L., Bowerman, C. et al. (2002),
‘COMPARE: A web accessible tool for investigating mechanisms of cell
growth inhibition’,J. Mol. Graph. Model. Vol. 20, pp. 297 – 303.
11. http://dtp.nci.nih.gov.
12. Paull, K.D., Shoemaker, R.H., Hodes, L. et al. (1989), ‘Display and
analysis of patterns of differential activity of drugs against human tumor cell lines: Development of mean graph and COMPARE algorithm’,
J. Natl. Cancer Inst. Vol. 81, pp. 1088 – 1092.
13. Garraway, L.A., Widlund, H.R., Rubin, M.A.et al. (2005), ‘Integrative
genomic analyses identify MITF as a lineage survival oncogene amplified
in malignant melanoma’,NatureVol. 436, pp. 117 – 122.
14. Staunton, J.E., Slonim, D.K., Coller, H.A. et al. (2001),
‘Chemosensitivity prediction by transcriptional profiling’, Proc. Natl.
Acad. Sci. USAVol. 98, pp. 10787 – 10792.
National Cancer Institute tumor cell line panel’,Toxicol. Sci. Vol. 61, pp. 218 – 223.
16. Moisan, F., Longy, M., Robert, J.et al. (2006), ‘Identification of gene
polymorphisms of human DNA topoisomerase I in the National Cancer
Institute panel of human tumour cell lines’, Br. J. Cancer Vol. 95,
pp. 906 – 913. 17. http://dtp.nci.nih.gov.
18. Fang, X., Shao, L., Zhang, H.et al. (2004), ‘Web-based tools for mining
the NCI databases for anticancer drug discovery’,J. Chem. Inf. Comput.
Sci. Vol. 44, pp. 249 – 257.
19. http://dtp.nci.nih.gov/docs/compare/compare.html. 20. http://dtp.nci.nih.gov/mtargets/download.html.
21. R Development Core Team (2006), ‘R: A language and environment for statistical computing’. R Foundation for Statistical Computing, Vienna, Austria.
22. Benjamini, Y. and Hochberg, Y. (1995), ‘Controlling the false discovery
rate: A practical and powerful approach to multiple testing’,J. R. Stat.
Soc. [Ser B]Vol. 57, pp. 289 – 300.
23. http://dtp.nci.nih.gov/docs/cancer/searches/standard_agent.html. 24. Boyd, M.R. (1989), ‘Status of the NCI preclinical antitumor drug
dis-covery screen’, in: DeVita, V.T., Jr, Hellman, S. and Rosenberg, S.A.
(eds), Cancer: Principles and Practice of Oncology (3rd Edn), Lippincott,
Philadelphia, PA, pp. 1 – 12.
25. Draghici, S., Khatri, P., Bhavsar, P. et al. (2003), ‘Onto-Tools, the
toolkit of the modern biologist: Onto-Express, Onto-Compare,
Onto-Design and Onto-Translate’, Nucleic Acids Res. Vol. 31,
pp. 3775 – 3781.
26. Draghici, S., Khatri, P., Martins, R.P.et al. (2003), ‘Global functional
profiling of gene expression’,GenomicsVol. 81, pp. 98 – 104.
27. Khatri, P., Bhavsar, P., Bawa, G.et al. (2004), ‘Onto-Tools: An ensemble
of web-accessible, ontology-based tools for the functional design and
interpretation of high-throughput gene expression experiments’,Nucleic
Acids Res. Vol. 32, pp. W449 – 456.
28. Ashburner, M., Ball, C.A., Blake, J.A. et al. (2000), ‘Gene Ontology:
Tool for the unification of biology. The Gene Ontology Consortium’,
Nat. Genet. Vol. 25, pp. 25 – 29.
29. Kanehisa, M. and Goto, S. (2000), ‘KEGG: Kyoto encyclopedia of genes
and genomes’,Nucleic Acids Res. Vol. 28, pp. 27 – 30.
30. Kanehisa, M., Goto, S., Kawashima, S. et al. (2004), ‘The KEGG
resource for deciphering the genome’, Nucleic Acids Res. Vol. 32,
pp. D277 – D280.
31. Nielsen, T.O., West, R.B., Linn, S.C.et al. (2002), ‘Molecular
character-isation of soft tissue tumours: A gene expression study’,LancetVol. 359,
pp. 1301 – 1307.
32. Tusher, V.G., Tibshirani, R. and Chu, G. (2001), ‘Significance analysis of
microarrays applied to the ionizing radiation response’,Proc. Natl. Acad.
Sci. USA, Vol. 98, pp. 5116 – 5121.
33. Sobell, H.M. (1985), ‘Actinomycin and DNA transcription’,Proc. Natl.
Acad. Sci. USA, Vol. 82, pp. 5328 – 5331.
34. Kreft, S.G. and Nassal, M. (2003), ‘hRUL138, a novel human
RNA-binding RING-H2 ubiquitin-protein ligase’,J. Cell Sci. Vol. 116,
pp. 605 – 616.
35. Pray, T.R., Parlati, F., Huang, J.et al. (2002), ‘Cell cycle regulatory E3
ubiquitin ligases as anticancer targets’, Drug Resist. Updat. Vol. 5,
pp. 249 – 258.
36. Sun, Y. (2006), ‘E3 ubiquitin ligases as cancer targets and biomarkers’,
NeoplasiaVol. 8, pp. 645 – 654.
37. Geroldi, D., Aldeghi, A. and Emanuele, E. (2007), ‘Perifosine may be of therapeutic usefulness in morbid obese females via inhibition of the
PI3K/Akt signaling pathway’,Med. HypothesesVol. 68, p. 236.
38. Elrod, H.A., Lin, Y.D., Yue, P.et al. (2007), ‘The alkylphospholipid
peri-fosine induces apoptosis of human lung cancer cells requiring inhibition
of Akt and activation of the extrinsic apoptotic pathway’,Mol. Cancer
Ther. Vol. 6, pp. 2029 – 2038.
39. Gajate, C. and Mollinedo, F. (2007), ‘Edelfosine and perifosine induce selective apoptosis in multiple myeloma by recruitment of death
receptors and downstream signaling molecules into lipid rafts’, Blood
Vol. 109, pp. 711 – 719.
40. Nyakern, M., Cappellini, A., Mantovani, I. et al. (2006), ‘Synergistic
induction of apoptosis in human leukemia T cells by the Akt inhibitor
perifosine and etoposide through activation of intrinsic and
Fas-mediated extrinsic cell death pathways’, Mol. Cancer Ther. Vol. 5,
pp. 1559 – 1570.
41. Zhang, W., Duan, S., Kistner, E.O.et al. (2008), ‘Evaluation of genetic
variation contributing to differences in gene expression between
popu-lations’,Am. J. Hum. Genet. Vol. 82, pp. 631 – 640.
42. Zhang, W., Ratain, M.J. and Dolan, M.E. (2008), ‘The HapMap
Resource is providing new insights into ourselves and its
application to pharmacogenomics’, Bioinform. Biol. Insights Vol. 2,
pp. 15 – 23.
43. Munshi, N.C., Hideshima, T., Carrasco, D.et al. (2004), ‘Identification
of genes modulated in multiple myeloma using genetically identical twin
samples’,BloodVol. 103, pp. 1799 – 1806.
44. Richardson, P., Lonial, S., Jakubowiak, A. et al. (2007), ‘Multi-center
phase II study of perifosine (KRX-0401) alone and in combination with dexamethasone (dex) for patients with relapsed or relapsed/refractory multiple myeloma (MM): Promising activity as combination therapy
with manageable toxicity’, ASH Annual Meeting Abstracts Vol. 110,
p. 1164.
45. Skubitz, K.M. and Skubitz, A.P. (2004), ‘Characterization of
sarcomas by means of gene expression’, J. Lab. Clin. Med. Vol. 144,
pp. 78 – 91.
46. Scherf, U., Ross, D.T., Waltham, M.et al. (2000), ‘A gene expression
database for the molecular pharmacology of cancer’,Nat. Genet. Vol. 24,
pp. 236 – 244.
47. Ross, D.T., Scherf, U., Eisen, M.B.et al. (2000), ‘Systematic variation in
gene expression patterns in human cancer cell lines’,Nat. Genet. Vol. 24,
Supplementary Table 1a. A majority of perifosine-specific gene expression levels are associated with the cytotoxicity of edelfosine
Symbol Perifosine
(p-value)
Edelfosine
(p-value)
Perifosine
(r-value)
Edelfosine
(r-value)
Notes
NS-cDNA
ATF2 0.0000 0.0075 20.560 20.348 Significant
TRA2A 0.0008 0.0005 20.438 20.456 Significant
ETS2 0.0005 0.0004 20.438 20.449 Significant
UBE2D3 0.0009 0.0026 20.419 20.382 Significant
VEGFB 0.0006 0.0001 0.443 0.502 Significant
ANP32A 0.0002 0.0003 0.492 0.469 Significant
GL-U95
REG4 0.0000 0.0004 20.579 20.443 Significant
SLCO4A1 0.0000 0.0060 20.518 20.351 Significant
RPL18A 0.0000 0.0093 20.500 20.333 Significant
OAZ2 0.0000 0.0018 0.527 0.394 Significant
DZIP3 0.0000 0.0001 0.580 0.478 Significant
NP-U95
STK39 0.0001 0.0004 20.479 20.449 Significant
FAM32A 0.0002 0.0529 20.460 20.253 Marginal
MAPKAPK3 0.0003 0.0920 20.454 20.221 Marginal
RAB8A 0.0005 0.0018 20.441 20.399 Significant
STK17B 0.0006 0.0243 20.435 20.293 Significant
TCF3 0.0006 0.0054 20.435 20.358 Significant
PARP4 0.0006 0.0000 20.433 20.519 Significant
PSMA2 0.0006 0.0060 20.432 20.354 Significant
DGKE 0.0007 0.0019 20.429 20.396 Significant
PVT1 0.0010 0.0018 0.418 0.398 Significant
ELOVL2 0.0009 0.0005 0.419 0.438 Significant
SMARCA3 0.0009 0.0038 0.420 0.371 Significant
USP6 0.0007 0.0094 0.428 0.335 Significant
NFATC4 0.0005 0.0305 0.437 0.282 Significant
IGF1R 0.0005 0.0570 0.437 0.249 Marginal
POU4F1 0.0005 0.0023 0.439 0.390 Significant
Supplementary Table 1a. Continued
Symbol Perifosine
(p-value)
Edelfosine
(p-value)
Perifosine
(r-value)
Edelfosine
(r-value)
Notes
PDLIM3 0.0005 0.0058 0.440 0.355 Significant
CBS 0.0004 0.0094 0.443 0.336 Significant
ARMCX2 0.0004 0.0008 0.447 0.425 Significant
OPHN1 0.0003 0.0194 0.459 0.304 Significant
ZNF609 0.0002 0.0091 0.462 0.337 Significant
ATN1 0.0001 0.0754 0.474 0.233 Marginal
DZIP3 0.0001 0.0093 0.479 0.336 Significant
PPBPL2 0.0001 0.0081 0.487 0.342 Significant
MPDZ 0.0000 0.0001 0.534 0.498 Significant
SKIV2L 0.0000 0.0007 0.557 0.427 Significant
GABRG3 0.0000 0.0000 0.601 0.533 Significant
Supplementary Table 1b. The perifosine-specific SNPs are associated with the cytotoxicity of edelfosine
dbSNP Perifosine
(p-value)
Perifosine
(r-value)
Edelfosine
(p-value)
Edelfosine
(r-value)
Notes
rs4236669 2.80E-07 0.64 1.75E-03 0.42 Significant
rs1468400 8.80E-07 0.62 6.27E-04 0.46 Significant
Supplementary Table 2. Genes whose expression levels were associated with the cytotoxicity of perifosine (FDRBH,0.10) but were
not perifosine specific
Symbol Gene title r p Control
totala
GL-U95
FNBP3 Formin-binding protein 3 20.53 3.5E-05 75
MOBKL2A MOB1, Mps One Binder kinase
activator-like 2A (yeast)
20.50 5.5E-05 43
TP53INP2 Tumour protein p53 inducible nuclear
protein 2
0.51 3.9E-05 24
FBXO44 F-box protein 44 0.52 2.4E-05 53
TMF1 TATA element modulatory factor 1 0.53 1.7E-05 57
NP-U95
HNRPDL Heterogeneous nuclear ribonucleoprotein
D-like
20.49 6.9E-05 3
DDX39 DEAD (Asp-Glu-Ala-Asp) box
polypeptide 39
20.49 7.3E-05 22
MRPL23 Mitochondrial ribosomal protein L23 20.49 8.7E-05 2
RPS24 Ribosomal protein S24 20.47 1.9E-04 21
LBR Lamin B receptor 20.47 2.0E-04 73
ERCC5 Excision repair cross-complementing
rodent repair deficiency, complementation group 5
20.47 2.0E-04 11
HDAC1 Histone deacetylase 1 20.46 2.2E-04 2
GTF3A General transcription factor IIIA 20.45 3.1E-04 11
EEF1B2 Eukaryotic translation elongation factor 1
beta 2
20.44 4.3E-04 68
ICAM3 Intercellular adhesion molecule 3 20.44 5.1E-04 43
SNRPF Small nuclear ribonucleoprotein
polypeptide F
20.44 5.2E-04 83
SH2D1A SH2 domain protein 1A, Duncan’s disease
(lymphoproliferative syndrome)
20.44 5.8E-04 61
KIR3DL1 Killer cell immunoglobulin-like receptor,
three domains, long cytoplasmic tail, 1
20.43 7.3E-04 76
RPL35 Ribosomal protein L35 20.42 8.1E-04 47
NUPL2 Nucleoporin-like 2 20.42 8.8E-04 1
PTMA Prothymosin, alpha (gene sequence 28) 20.42 9.0E-04 33
CORO1A Coronin, actin-binding protein, 1A 20.42 9.3E-04 104
Supplementary Table 2. Continued
Symbol Gene title r p Control
totala
LCN1 Lipocalin 1 (tear prealbumin) 20.42 9.3E-04 21
POLE3 Polymerase (DNA directed), epsilon 3
(p17 subunit)
20.42 9.2E-04 31
RPS27A Ribosomal protein S27a 20.42 9.4E-04 79
TRIM14 Tripartite motif-containing 14 20.42 9.3E-04 60
LHFPL2 Lipoma HMGIC fusion partner-like 2 0.42 1.0E-03 99
DOK5 Docking protein 5 0.42 9.5E-04 1
EIF4G1 Eukaryotic translation initiation factor 4
gamma, 1
0.42 9.6E-04 28
RGS19 Regulator of G-protein signalling 19
interacting protein 1
0.42 9.2E-04 116
COPB2 Coatomer protein complex, subunit beta
2 (beta prime)
0.42 8.9E-04 1
TLE2 Transducin-like enhancer of split 2 (E(sp1) homologue,Drosophila)
0.42 9.0E-04 4
ITGA7 Integrin, alpha 7 0.42 8.6E-04 13
SEMA3C Sema domain, immunoglobulin domain
(Ig), short basic domain, secreted, (semaphorin) 3C
0.42 8.2E-04 22
S100A13 S100 calcium binding protein A13 0.43 7.8E-04 88
FLOT1 Flotillin 1 0.43 6.5E-04 2
MLF1 Myeloid leukemia factor 1 0.43 6.0E-04 11
ARHGEF11 Rho guanine nucleotide exchange factor
(GEF) 11
0.44 5.5E-04 9
COL15A1 Collagen, type XV, alpha 1 0.44 4.9E-04 1
DAG1 Dystroglycan 1 (dystrophin-associated glycoprotein 1)
0.44 4.9E-04 118
IFNA14 Interferon alpha 14 0.44 4.8E-04 2
PHLDB1 Pleckstrin homology-like domain, family B,
member 1
0.44 4.5E-04 12
PTPRS Protein tyrosine phosphatase, receptor
type S
0.45 4.0E-04 2
SASH1 SAM and SH3 domain containing 1 0.45 4.1E-04 52
ACVR1B Activin A receptor, type IB 0.45 3.2E-04 18
CTNNA1 Catenin (cadherin-associated protein),
alpha 1, 102 kDa
0.46 3.0E-04 30
Supplementary Table 2. Continued
Symbol Gene title r p Control
totala
IL6ST Interleukin 6 signal transducer (gp130,
oncostatin M receptor)
0.46 2.9E-04 68
ATP6V1D ATPase, Hþtransporting, lysosomal
34kDa, V1 subunit D
0.46 2.5E-04 2
SUOX Sulphite oxidase 0.46 2.1E-04 58
TFAP2A Transcription factor AP-2 alpha (activating
enhancer binding protein 2 alpha)
0.48 1.3E-04 51
GRINA Glutamate receptor, ionotropic, N-methyl
D-asparate-associated protein 1 (glutamate binding)
0.49 9.3E-05 1
ABCB6 ATP-binding cassette, sub-family B (MDR/
TAP), member 6
0.49 8.2E-05 8
CTSF Cathepsin F 0.49 7.4E-05 9
VEGFB Vascular endothelial growth factor B 0.50 4.6E-05 6
GGCX Gamma-glutamyl carboxylase 0.52 2.1E-05 23
LAPTM4B Lysosomal-associated protein
transmembrane 4 beta
0.53 1.6E-05 84
FYN Sialidase 1 (lysosomal sialidase) 0.55 6.3E-06 59
NS-cDNA
LBR Lamin B receptor 20.47 1.3E-04 1
TRA2A Transformer-2 alpha 20.44 8.3E-04 13
ETS2 V-ets erythroblastosis virus E26 oncogene homolog 2 (avian)
20.44 5.3E-04 30
UBE2D3 Ubiquitin-conjugating enzyme E2D 3
(UBC4/5 homologue, yeast)
20.42 8.5E-04 4
RRM1 Ribonucleotide reductase M1 polypeptide 20.41 9.8E-04 1
ATP6V1C1 ATPase, Hþtransporting, lysosomal
42kDa, V1 subunit C, isoform 1
0.42 7.7E-04 51
VEGFB Vascular endothelial growth factor B 0.44 6.3E-04 57
RDX Radixin 0.45 4.2E-04 29
APOD Apolipoprotein D 0.45 3.1E-04 3
PTMS Parathymosin 0.47 1.8E-04 2
a
![Figure 1. The chemical structure of perifosine (NSC639966).4-[[hydroxy(octadecyloxy)phosphinyl]oxy]-1, 1-dimethyl-, innerMolecular formula: C25H52NO4P; Chemical name: piperidinium,salt.](https://thumb-us.123doks.com/thumbv2/123dok_us/266266.1519594/2.609.56.300.71.157/chemical-structure-perifosine-octadecyloxy-phosphinyl-innermolecular-chemical-piperidinium.webp)