Journal Pre-proof
Effect of partial replacement of coarse aggregate by polystyrene balls on the shear behaviour of deep beams with web openings
Ibrahim G. Shaaban, Amr H. Zaher, Mohamed Said, Wael Montaser, Mohamed Ramadan, Ghada N. Abd Elhameed
PII: S2214-5095(19)30430-9
DOI: https://doi.org/10.1016/j.cscm.2019.e00328
Reference: CSCM 328
To appear in: Case Studies in Construction Materials
Received Date: 11 September 2019
Revised Date: 6 December 2019
Accepted Date: 16 December 2019
Please cite this article as: Shaaban IG, Zaher AH, Said M, Montaser W, Ramadan M, Abd Elhameed GN, Effect of partial replacement of coarse aggregate by polystyrene balls on the shear behaviour of deep beams with web openings,Case Studies in Construction Materials (2019), doi:https://doi.org/10.1016/j.cscm.2019.e00328
This is a PDF file of an article that has undergone enhancements after acceptance, such as the addition of a cover page and metadata, and formatting for readability, but it is not yet the definitive version of record. This version will undergo additional copyediting, typesetting and review before it is published in its final form, but we are providing this version to give early visibility of the article. Please note that, during the production process, errors may be discovered which could affect the content, and all legal disclaimers that apply to the journal pertain.
Effect of Partial Replacement of Coarse Aggregate by Polystyrene balls on
the Shear Behaviour of Deep Beams with Web Openings
Ibrahim G. Shaaban1, Amr H. Zaher2, Mohamed said3, Wael Montaser4, Mohamed
Ramadan4, Ghada N. Abd Elhameed4
1 Civil Engineering and Built Environment, University of West London, UK 2Structural Eng. Dept., Faculty of Eng., Ain Shams University, Cairo, Egypt
3 Civil Engineering Department, Faculty of Engineering, Shoubra, Benha University, Egypt. 4 Structural Eng. Dept., Faculty of Eng., October 6 University, Giza, Egypt.
Highlights Size and location of the web openings has a major impact on the failure mode and
ultimate shear strength of reinforced LWC deep beams.
Application of finite element modelling to test beams, very good prediction of load-carrying capacities, cracking pattern and load-deflection relationships.
It is recommended that the depth of opening should not exceed 20% of the total depth of the deep beam otherwise internal strengthening around its perimeter is essential.
Strut-and-tie model can be used as a rational approach for predicting deep beams with openings, which contain polystyrene balls as coarse aggregates.
Abstract
Thirteen specimens were experimentally tested under single midspan concentrated loads to study the shear behavior of lightweight concrete (LWC) and normal weight concrete (NWC) deep beams with web openings. In this research, the term LWC refers to the concrete obtained by partially replacing aggregate by polystyrene foam balls not the concrete containing lightweight aggregate. This resulted in a weight reduction of LWC beams in this research by approximately 30% compared to NWC compartments. The studied variables were the dimensions and location of openings, transverse reinforcement ratio, and shear span to depth ratio (a/d). It was found that the overall shear behavior and failure mode for LWC deep beams are comparable to those of the NWC specimens. This is very promising and encouraging to build lighter deep beams of similar structural behaviour as that of NWC deep beams. Dimensions of the openings have a significant effect on the behaviour of failure and shear strength of LWC and NWC deep beams. It was found that increasing the depth of the opening from 20% to 40% of the beam depth led to a reduction in the ultimate load by up to 46.4%. Finite element modelling of the test beams was carried out to verify numerical results versus experimental work and both were very well correlated. In addition, a parametric study was conducted to assess the effect of internal stiffening around openings in deep beams. The maximum enhancement in the shear capacity was approximately 30% for beams, internally strengthened by additional reinforcement on the perimeter of openings compared to the beams without any reinforcement around the openings. Strut-and-Tie model (STM) was carried out as a rational approach to predict the shear behaviour of studied beams. It was found that STM underestimates the shear of the studied beams compared to experimental results for different tested beams but the agreement between both of them was acceptable. It is recommended that the depth of opening should not exceed 20% of the depth of the deep beam and if the depth of opening is more than that or lies in the shear span it is highly
recommended to strengthen the opening internally by additional reinforcement around its perimeter.
Keywords: Coarse Aggregate; Polystyrene balls; Deep beams; Shear strength; web openings; finite element model; Strut-and-Tie model
stL ostoNs o tsiL
Sh: spacing between horizontal web reinforcement;
Sy: spacing between vertical web reinforcement;
dv: diameter of vertical stirrups;
ρv: transverse reinforcement ratios;
Av: the area of a vertical stirrup within a distance; w/c: water cement ratio;
F; a function of the principal stress state; σxp, σyp, σzp;
S; failure surface expressed in terms of principal stresses and the strength parameters ft, fc, fcb, f1 and f2;
ft; ultimate uniaxial tensile strength;
fc; ultimate uniaxial compressive strength;
fcc; concrete peak stress
fcb; ultimate biaxial compressive strength;
f1; ultimate compressive strength for a state of biaxial compression superimposed on
hydrostatic stress state;
f2; ultimate compressive strength for a state of uni-axial compression superimposed on
hydrostatic stress state;
fcu : cube compressive strength of concrete;
fc′; cylinder compressive strength;
a/d; shear span-to-depth ratio;
fs and εs; the average stress and strain of steel bars, respectively;
fy and εy; the yield stress and strain of steel bars, respectively;
Es; the young's modulus of steel reinforcement;
fcr; the cracking strength of concrete;
εc; concrete strain;
εc1; concrete strain at ultimate stress;
εcc1; concrete strain at peak stress;
εn; strain in steel bars
FEM; Finite element method
h; the beam height;
d ; the beam depth;
b; the beam width;
a; the shear span;
a1; the height of node N1;
a2 ; the height of node N2;
b1 ; the length of bearing plate 1;
b2 ; the length of bearing plate 2;
Ld ; the internal lever arm between the tie force T, and compression strut S2
S; the force in strut S;
N1; the node N1;
N2 ; the node N2;
W11 ; the width of strut S at node N1, measured perpendicular to strut center line;
W12 ; the width of strut S at node N2, measured perpendicular to strut center line;
W1av ; the average width of strut W11 and W12;
L; the beam effective length;
α; the inclination of strut S;
C; the concrete cover;
Φstr; the stirrup diameter;
φi ; the longitudinal steel diameter;
n; the number of steel layers;
s; the spacing between steel layers;
As; the area of the reinforcement;
V ; the shear force at support;
f sce; the effective concrete compressive strength for strut S;
f N1ceeffective concrete compressive strength at node N1;
f N2ceeffective concrete compressive strength at node N2
1. Introduction
Deep beams are used in special structures such as transfer floors of high-rise buildings, offshore structures and complex foundation systems. The shear capacity is the governing design factor for deep beams. In simple deep beams, the zone of high shear coincides with the district of low moment. Different values of the span to depth ratio (Le/d) and the shear
span to depth ratio (a/d) are proposed by different design codes to define deep beams (ACI 318-14 and Eurocode-2, 2004). Openings in the web area are often provided for critical services and accessibility. The ventilating slots are the ideal example for the opening in deep beams. Such openings may affect the capacity or the stresses distribution, particularly when openings exist in the critical regions. The shear capacity of beams with openings is based on numerous factors, such as: location, dimensions of the opening, and properties of used materials (e.g. concrete and steel) (Shaaban, 1999; Yang et al., 2006). Simplified design methods for deep beams without special consideration to the influence of web openings are described in most of the available international design codes (ACI 318-14 and Eurocode-2, 2004).
Extensive analytical, numerical, and experimental investigations have been carried out for studying deep beams with web openings (Haque et al. 1986; El Maaddawy and Sherif, 2009; Amiri et al. 2011; Ahmed et al. 2012; Beshara et al. 2015; Lafta and Ye, 2016; Nair and Kavitha, 2016; Moradi and Esfahani, 2017; Shather et al. 2018). Mansur and Alwist (1984) experimentally tested 12 reinforced fiber concrete deep beams (1300x650mm) with small size openings (175x125mm). Their results indicated that the amount of web reinforcement (fibers or continuous steel reinforcement), and the location of opening are the principal parameters that affect the strength of deep beams. They predicted the strength using equations for non-fiber concrete deep beams with reasonable accuracy. Shanmugam, and Swaddiwudhipong (1988) developed an empirical formula to predict the ultimate strength of experimentally tested fiber reinforced concrete deep beams containing openings. Their results showed that the ultimate strength primarily depends upon the extent to which the opening intercepts the natural load path. Ashour et al. (2000), developed a model for a mechanism of shear failure of analyzed specimens. The model presented that a/d ratio has a higher influence on the shear capacity than that of the Le/d ratio.
Sahoo et al. (2012) investigated the performance of two RC and two steel fiber-reinforced concrete (SFRC) deep beams with large openings under monotonically increased concentrated loads. The boundary regions near the supports of two studied specimens were strengthened with steel cages formed by steel reinforcement bars. They found that the RC
specimen with strengthened boundaries exhibited a ductile mode of failure and had significantly higher ultimate strength than that predicted by Strut and Tie Models (STMs). They found also that the SFRC specimens with 1.5% volume fraction of fibers reached much higher strength than the design load and exhibited significant postpeak residual strength and a ductile mode of failure. Doh et al. (2012) carried out a parametric study for high strength concrete deep beams with various web openings configurations using nonlinear-layered finite element method (LFEM). Their results confirmed that the current design methods are inadequate in predicting the maximum shear strength when web openings are present.
Abduljalil (2014) carried out an experimental work to study shear resistance of reinforced concrete deep beams with opening strengthened by CFRP strips. He found that externally CFRP strips significantly increased the ultimate shear capacity and they limited the shear crack width of the deep beams with openings. Adam et al. (2016) carried out experimental and finite element study for self-compacted concrete solid deep beams with fibers. They found that both vertical and horizontal web reinforcement are efficient in shear capacity enhancement of studied specimens. They also found that ultimate shear capacity was increased by about 47% with increasing the longitudinal steel ratio from 1.0% to 2.2%. Hussain (2017) developed a finite element model using ANSYS software release 12.0 program to study the ultimate load and crack propagation for reinforced NSC specimens provided with openings. His results presented acceptable agreement with experimental results of ultimate beam capacity, corresponding mid span deflection, and detected inclined cracks. The use of LWC structures, especially deep beams, is increasing widely. These beams are efficient since their ultimate strength can be comparable to NWC counterparts at an approximate weight of only sixty percent of that for NWC deep beams. Huang, et al. (2011) studied experimental shear behavior of full dimension LWC solid deep beam specimens. Their results concluded that the failure modes of LWC beams are similar to those of NWC beams, including shear-compression failure and shear-tension failure. Sathiyamoorthy (2016) found that shear strength of LWC beams increased with the decrease of a/d ratio. He reported that LWC beams showed higher number of cracks and wider crack width at failure compared to their NWC counterparts. He also mentioned that the international design building codes (ACI 318-14 and Eurocode-2, 2004) are conservative in predicting shear strength of shear/non-shear reinforced LWC beams. Back in 1973, Kong and Sharp (1973) studied the shear strength of LWC deep beams with small size of their openings and they developed a semi-empirical method for the analysis of deep beams with small openings. It is worth mentioning that LWC deep beams studied in literature and mentioned above are those containing light weight aggregates.
It can be seen from the review above that further research is needed for accurate prediction of strength and behaviour of LWC deep beams cast by partially replacing coarse aggregates by polystyrene foam balls with openings of large dimensions. The authors of the current investigation started a project in 2015, funded by two Egyptian universities, namely: Ain Shams and October 6, to study the LWC deep beams containing polystyrene balls with openings (Ramadan, 2017; Abd Elhameed, 2018). The current study investigates the effect of opening size, location and number of openings on the shear behavior of both LWC and NWC deep beams subjected to concentrated loads. Other studied variables include the transverse reinforcement ratio and a/d ratio. Experimental work is carried out and theoretical work included prediction of experimental results using the rational method, Strut-and-Tie Model (STM), and the more accurate one, three-dimensional Finite Element Modeling (FEM). STM approach follows Foster and Gilbert (1998) while FEM is developed using ANSYS package (ANSYS 13.0) to predict the results and to evaluate its sensitivity to the studied parameters. In addition, a parametric study is carried out to further study the effect of
increasing the longitudinal main reinforcement ratio, the internal stiffening of the opening perimeter using additional reinforcement on the shear behavior of LWC deep beams with openings. Ultimately, recommendations are introduced for the analysis and design of LWC deep beams with openings.
2. Experimental Program
2.1 Preparation of Test Specimens
The program includes thirteen LWC and NWC deep beams. Beams were tested under a single midspan concentrated load. Deformed steel, grade 40/60 were used for longitudinal top and bottom reinforcement. The bottom bars consisted of four deformed bars of 16 mm diameter in two layers while the top reinforcement consisted of two bars of 10mm diameter. The specimens were designed to ensure that shear failure occurs. Adequate anchorage was provided to the longitudinal bars. Mild steel, grade 24/35, of 6-mm and 8-mm diameter was used as horizontal and vertical shear reinforcement. Additional precautions were taken at the supports by placing bearing plates (100x100x15mm) under the load position in order to prevent local failure by bearing. Specimens were divided into three groups as indicated in Table 1. All the tested specimens had the same rectangular cross-section of 80 mm width and 400 mm total height as shown in Figures 1-2. Mix design, of both of NWC and LWC, was carried out to achieve similar target cube strength after 28 days. Light weight concrete (LWC) were made by partially replacing coarse aggregate by polystyrene foam balls. This resulted in a reduction of overall weight of the LWC test beams by approximately 30% compared to their counterparts of NWC ones. Table 2 displays the mix design for LWC and NWC. Mechanical properties of LWC and NWC mixes are recorded in Table 3.
2.2 Description of Test Specimens
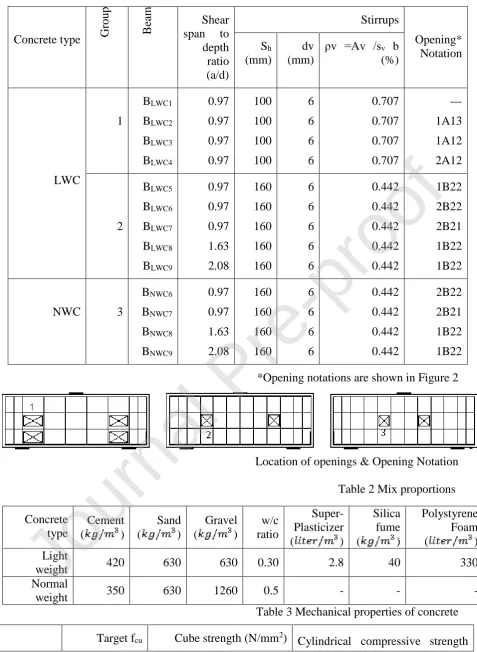
Table 1 and Figure 2 show that the openings arrangements were either single row of openings, having a height equals to 20 % of the beam total height; or double rows of openings having a height equals to 40 % of the beam total height. Three different locations of the openings were tested; location 1, 2 and 3. For location 1, the opening lies between the first stirrup at the support and the second one. For location 2, the opening lies between the second stirrup from the support and the third one. Regarding location 3, the opening lies between the third stirrup from the support and the fourth one. The locations of web openings were selected to test three different load flows to the support. Spacing (Sv) between the
vertical web reinforcement was 100 mm and 200 mm. Three different values of a/d ratio; 0.97, 1.63 and 2.08, were considered. The beam notation, as indicated in Table 1, included four parts. The first part refers to the number of openings in the shear span (1 or 2) and the second part indicated the size of opening (A= width x height = 80 x 80 mm and B =140 x 80 mm). The third part referred to the web reinforcement arrangement (1 for Sv=100 mm and 2
for Sv=200 mm) and the fourth part referred to the position of the openings (location 1, 2 and
3).
2.3 Loading and Test Procedure
Specimens were loaded in increments up to failure. Specimens were instrumented to measure their deformational behavior. The recorded data include measurements of strain in concrete, main steel, transverse reinforcement (stirrups) and longitudinal bars strain; deflection and crack propagation. The strain gauge was shown in Figure 1. The deflections were recorded using three LVDT, Figure 3. LVDT were arranged to measure the deflection distribution. The cracks were traced at each increment.
3. Experimental Results and Discussion
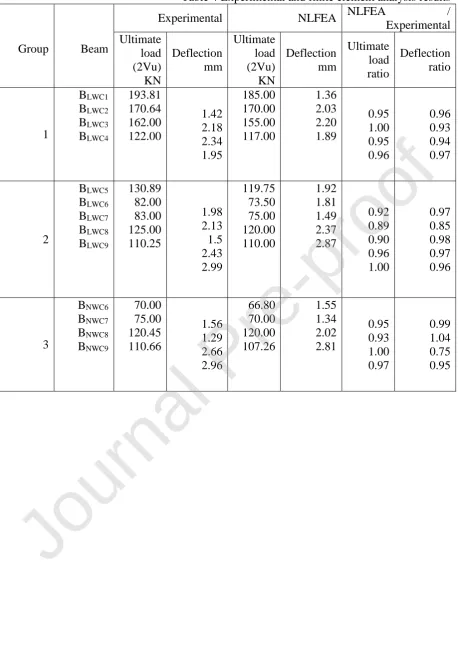
Crack pattern and failure modes, deflections, and steel strains for horizontal, vertical stirrups and main bars reinforcement were noted for each of the thirteen specimens and the relationships are plotted in Figures 4-11. The ultimate loads and deflections are recorded, Table 4.
3.1 Crack Pattern and Failure Modes
Figure 4 displays the crack patterns which were in terms of flexural and shear cracking for all the test specimens. For all specimens, the flexural crack was initiated at the central of the beam span. Flexural cracks were distributed as the load increased. For solid beam BLWC1, the
tensile cracks initiated on the tension side of the beam span. The cracks propagated upward with the increase of loading. Diagonal cracks suddenly developed at the shear span. The cracks were detected parallel to the compression strut. The cracks were spread towards the loading region and supports. A typical shear compression failure of beam BLWC1 occurred
suddenly by crushing in the concrete compression struts resulting also in a loud noise. Finally, sudden shear failure occurred instantly after main diagonal cracks formed within one or two side of the shear span as shown in Figure 4.
For the studied beams with small opening size, BLWC2 and BLWC3; the first observed cracks
were flexural on the tension side at the middle of the beam span. These cracks rapidly propagated with the load increase towards the lower corners of the opening. With the increase of the applied load, shear diagonal cracks were initiated and extended from the support plates to the edges of the openings. At higher loading stages, the width of the main diagonal crack increased as shown in Figure 4. For these beams, failure occurred above the web opening with inclined cracks starting form loaded plate to the upper corners of the opening. Alsaeq (2013) reported similar observations for deep beams with openings.
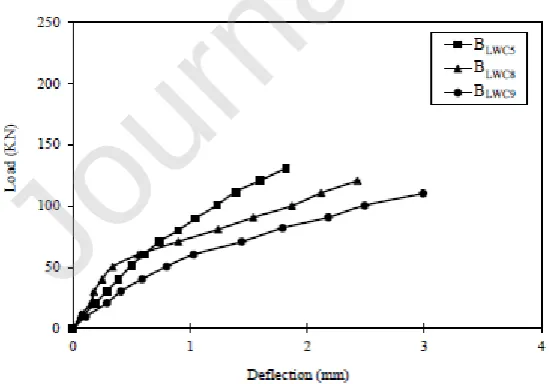
For the specimens with large openings, BLWC5 and BLWC6, inclined cracks appeared first from
loading point till corner of the upper opening parallel to the compression strut, and then further diagonal cracks were initiated at opening corners. Then, cracks propagated towards loading zone and supports. More diagonal cracks appeared parallel to the strut, passing through the opening corners and propagated towards the loading region and the supporting plates. Three a/d ratio were chosen, the first ratio was 0.97, beam BLWC5, the second ratio was
1.63, beam BLWC8, and the third ratio was 2.08, beams BLWC9. The development of flexural
cracks was faster in samples with a large value of a/d ratio; beams BLWC9 and BLWC5 (see
Figure 4). The recorded ultimate strength of specimen BLWC5 tested at a / d equals 0.97 was more than that of Specimens BLWC8 and BLWC9 by 11% and 18%, respectively. Referring to
Figures 4 and 5, it is clear that the dimensions and position of the openings have major effects on the crack pattern, ultimate strength and failure of studied specimens. This agrees with the findings of Jasim et al. (2019) who reported in his experimental and theoretical study of deep beams with a/d ratio equals 1.1 that the large web openings have a great effect on the shear strength of deep beams. It can be seen from the above observations that when the openings interrupt the load path between the loading and reaction points, the crack path changes to a more complex one. It is worth mentioning that failure of all tested specimens was shear failure as shown in Figure 4).
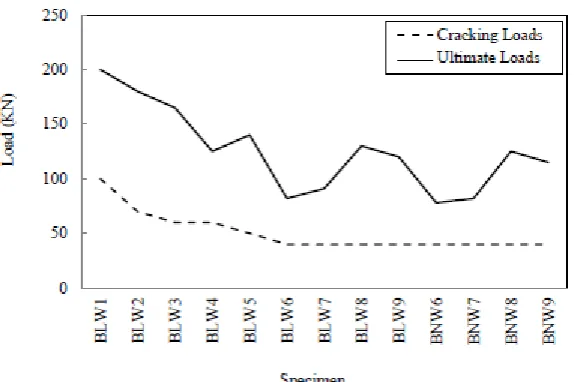
3.2 Cracking Loads and Ultimate Loads
Figure 5 displays the cracking loads and ultimate loads of the studied specimens. It can be seen that the cracking load of LWC specimens, BLWC6, BLWC7, BLWC8 and BLWC9, are nearly
equal to the cracking load of NWC specimens, BNWC6, BNWC7, BNWC8 and BNWC9. On the other
hand, ultimate loads of LWC specimens were approximately 90 to 96% of the ultimate loads
of NWC counterparts. The cracking load of specimens BLWC2, BLWC3 and BLWC4 was 70%,
65%, and 60% of the cracking loads of solid specimens. As far as the specimens with double rows of openings of depth, 40%, of the beam depth, the ultimate loads of specimens BLWC6
and BLWC7 were approximately 41% and 46% of the ultimate load of the solid specimen
BLWC1. Generally, increasing the width of the opening in the shear zone led to drop in the
ultimate load of the specimens. The ultimate load of specimens BLWC6 was 66% of that
BLWC4. It should be noted that the dimensions and position of the web opening have
significant effect on the mode of failure and ultimate strength of LWC and NWC deep beams. The presence of openings in the shear span considerably reduced the ultimate strength of the specimens. Similar observations were reported by Yang et al., 2006, who found that the ultimate shear strength of HSC deep beams with openings reduced rapidly with the presence of openings in the shear span.
3.3 Load-Midspan Deflection of Test Specimens
The deflection at mid-span was measured and recorded at each load increment during testing of each beam. Load-deflection relationships are shown in Figures 6-10 for all test beams. It can be seen from Figure 6 that for specimen BLWC1, the beams behaved in a truly elastic
manner at early stages of loading. In addition, beams with small web openings; BLWC2 and
BLWC3 showed load deflection behavior very similar to that of the solid beam. Figure 7
shows that the ultimate load of specimens decreased with increasing the size of openings. It was noticed also that specimens with small openings, BLW2, BLW3, and BLW4 (see Figure 6)
have stiffness higher than those with large openings, BLW5, BLW6, and BLW7, shown in Figure
7. For example, the ultimate load of BLWC2 equals to 1.06 that of BLWC3 with opening near the
support (see Figure 6). The effect of concrete type on the mid span displacement for deep beams with web openings is shown in Figure 8. It can be seen from the figure that the ultimate loads and stiffness of LWC studied beams, BLWC6, BLWC7, BLWC8, BLWC9 and their
counterparts NWC specimens, BNWC6, BNWC7, BNWC8, BNWC9, have a similar pattern. Figure 9
displays the influence of openings on the reduction of stiffness of the studied deep beams. For example, the ultimate loads of specimens with opening height represent 40% of the depth of beams, BLWC4 and BLWC6, were approximately 75% and 63% of that of the beams of opening
height equals 20% of the beam depth. For BLWC6 with large opening (opening size notation,
2B22), the mid span deflection was higher than that of BLWC4 with opening size notation,
2A12, and BLWC5 with opening size notation, 1B22. This agrees with the findings of Ibrahim
et al. (2018) who reported the relationship between opening dimensions, position, the stiffness and ultimate capacity. Figure 10 shows that the reduction in the ultimate load of the studied specimen was 16% with increasing a/d ratio from 0.97 to 2.08.
3.4 STEEL STRAINS
Strain gauges were attached to the tensile steel reinforcement of specimens to examine the disparity of strain in bottom reinforcement. These gauges were attached at mid-span of specimens. Figure 11 displays a typical measured strain of the specimens. The strain deviation in tensile reinforcement was nearly comparable for all test beams. The development of a tie-action was detected and the strain increased rapidly in the locality of the first crack. Finally, the strains were increased at almost constant loading level until the failure occurred. The maximum strain in flexural reinforcement was less than that of the yield strain value. The measured strains were ranged from 25% to 50% of yield strain of the longitudinal reinforcement. The recorded strain in tension bars showed that the tension failure was protected for all of the specimens to permit for shear failure mode. The maximum recorded strain in longitudinal bars was 0.0009 for Specimen BLWC8 (see Figure 11). Similar
tensile steel reinforcement strain was observed by Ibrahim et al. (2018). Figure 11 shows also that the strain in vertical stirrups was recorded at the critical shear locations. Prior to the occurrence of the first crack, the internal shear resistance was provided by the beam section. Once the diagonal cracks occurred, strains of the vertical stirrups were recorded, representing shear resistance role by the vertical stirrups. The maximum strain in vertical stirrups was approximately 0.002 for Specimen BLWC9. The yielding of vertical stirrups occurred before
failure of deep beams. The maximum horizontal stirrups’ strain was 0.00046 for Specimen BLWC7 as shown in Figure 11.
4. Finite Element Modelling of Deep Beams
The experimentally tested thirteen specimens were numerically modeled using ANSYS 13.0, 2010, package to predict their results versus the experimental results for the main studied parameters, dimension and position of opening, the design concrete compressive strength, the transverse reinforcement ratio, and a/d ratio. Details of the finite element modelling, predictions of the results using the tested model are reported and discussed in the following sections.
4.1 Element Types, Material Properties and Constitutive Models
Concrete and steel are the two main materials used in the numerical analysis of the deep beam in which their properties and constitutive models are presented. The solid element used in this study was Solid65 which is one of the elements in ANSYS program to model the three-dimensional behavior of concrete. Solid65 was assumed to model the concrete as it is capable of cracking in tension and crushing in compression. The geometrical characteristics of the 3-D Solid65 element are shown in Figure 12. The element is defined by eight nodes and each node has three degrees of freedom. The flexural and shear reinforcement in the tested beams were idealized using the Link8 element as shown in Figure 13. The axial stress is assumed to be uniform over the entire element. Full bond was assumed between concrete and reinforcing steel. Both linear and non-linear behaviors of the concrete were considered. For the linear stage, the concrete is assumed to be an isotropic material up to cracking. For the non-linear segment, the concrete may undergo plasticity. The numerical solution scheme adopted for non-linear analysis was an incremental load procedure based on the iterative solution using Newton-Raphson method. The convergence criterion currently used was based on the iterative nodal displacement where only transitional degrees of freedom were considered.
4.1.1 Constitutive modeling for concrete
The concrete material model assigned for Solid65 element used throughout this study is characterized by its capability to predict the failure of brittle materials. Both cracking and crushing failure modes are accounted for. The criterion for failure of concrete due to a multi-axial stress state can be expressed in the form:
0 S f F c (1) To model concrete behavior, nonlinear stress-strain curves were used in compression and tension (Montoya et al., 2001). Such models account for compression & tension softening, tension stiffening and shear transfer mechanisms in cracked concrete as presented in Figure 14.
4.1.2 Constitutive modeling for steel
The average stress-strain curve developed earlier by Soroushian and Lee (1989) for steel bars embedded in concrete is used in the current research (see Figure 15). The stress-strain relationship is expressed by two straight lines as follows:
For s n :
fs Ess (2)
and for s n:
y s ys f 0.91 2B 0.02 0.25B
f
(3) Where n y
0.932B
.And the parameter B is given as
/ f
f 1.5
y cr
The recommended value of fcr is given as:
/ c
cr 0.31 f
f
In MPa (4)
4.1.3 Modelling of simple deep beams
The beams are modeled using nonlinear solid element (solid 65) and Link 8 -3D bars. The cross section is divided into five strips according to the main bottom and top as shown in Figure 16. Strip (S1) is 20 mm thick and represents the concrete cover at the bottom of beam section only. The second strip (S2) is (30 mm) thick and represents the concrete part at the bottom of the beam section that contains two bars of the main reinforcement (4 Ø 16) and represents the upper part of concrete that contains the top secondary steel (2 Ø 10) reinforcement in that part of the upper concrete cover. Longitudinally, the distance between point load and support is meshed with twenty-two strips (50 mm×22). In addition, a finer mesh was generated under the point loads and supports (20 mm (4 × 20 mm) for different beams) as shown in Figure 17 for typical studied beams. Three stiff reinforced concrete solid elements were meshed and used to model the two supports and the point load as shown in Figure 17. The two-hinged supports are located at the lower parts of the reinforced concrete elements. The point load was represented by five nodes of the reinforced concrete elements.
4.2 Finite Element Results
4.2.1 Prediction of crack patterns and failure mode
Figure 18 shows a comparison between finite element prediction and experimentally observed crack patterns for selective specimens, which were previously introduced in Figure 5. In addition, Table 4 shows the predicted values for the ultimate loads and corresponding deflection for the studied beams. It can be seen from Figure 18 that the crack patterns for deep beams predicted by finite element model are in good agreement with the experimentally observed ones. At approximately 43% of the ultimate load of capacity of specimens, a rapid main inclined tension crack formed nearly in the middle part of the shear span. In addition, inclined cracks spread to the beam support. For beams with openings, the cracks spread
above openings to the point load. Then the crack extended down from the openings to supports. Finally, failure occurred in opening region. Compression stresses were concentrated along the load path. The tensile stresses were eliminated in the finite element analysis generating cracks in concrete and they were relocated to steel crossing this region. The stress level depends mostly on the dimension and position of the opening. In addition, the concrete strength has a greater effect with a decreasing a/d ratio. The higher compressive stresses occurred at nodal zones, whilst a reduction in the compressive stresses occurred in the inclined struts linking the points load and supports. This reduction is due to the opening in the load path. Figure 19 displays the deformed shape and vertical displacement before failure for selected beams. The above comparison shows also that the ultimate load of LWC is slightly higher than that of NWC and this may be attributed to the fact that actual concrete cube strength for LWC specimens was slightly higher than that of NWC companions in this study.
4.2.2 Prediction of Load-deflection relations
Figure 20 shows comparisons between experimental load-deflection relationships and those predicted numerically. In addition, Table 4 shows comparisons between experimental and numerical results for ultimate loads and corresponding deflection. Figure 20 and Table 4 reveal that there is a very good agreement between the numerical and the experimental test results. The ratio of the predicted ultimate loads to the experimental ones for the tested deep beams ranged between 0.89-1.0.
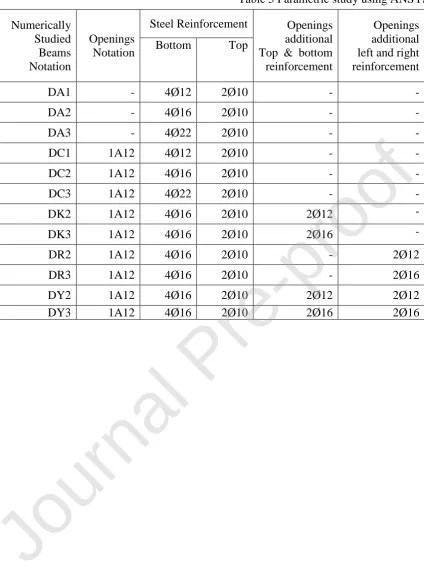
4.2.3 Parametric Study (Effect of Interior Strengthening)
A parametric study was carried out by adding more parameters, other than those used in the experimental study in this research, to examine the performance of LWC deep beams with openings having different configurations. The extra studied parameters reported in Table 5 were changing the bottom (tensile) reinforcement ratio for solid deep beams and those with openings, adding top and bottom reinforcement adjacent to the edges of the opening, adding right and left reinforcement adjacent to the opening edges, and adding reinforcement at all sides of the opening. It is worth mentioning that the opening notation is the same as that for experimentally tested beams in Table 1. Figure 21a shows the numerical load-deflection for solid deep beam specimens with different bottom reinforcement. It can be seen from the figure that the increase of longitudinal bottom reinforcement led to a reasonable increase in the ultimate capacity. For example, Specimen DA3 of higher tensile reinforcement ratio of 0.54% (4Ø22 bottom reinforcement) exhibited more ductile behavior compared to that of specimen DA1 of 0.16% tensile reinforcement ratio (4Ø12 bottom reinforcement). The increase in ultimate load of specimens DA3 was approximately 18%. The same change in bottom reinforcement was applied to Specimens, DC1, DC2, and DC3 as indicated in Table 5. Figure 21b shows the load- deflection relationships for those specimens. The tensile steel reinforcement has a profound effect on the post-peak response of these LWC specimens. The maximum increase in the ultimate load was 11% as the tensile reinforcement ratio increased from 0.16% (4Ø12) to 0.54% (4Ø22).
Figure 21c shows that, Specimens DK2 and DK3, provided with additional steel reinforcement above and below opening, exhibited more ductile behavior compared to that of Specimen DC2, which had no additional reinforcement. The increase in ultimate load of Specimens DK2 and DK3 was approximately 9% and 15%, respectively. Adding 2Ø16 additional reinforcement for Specimen DK3 above and below the opening led to an increase in the ultimate deflection by 30% over that of Specimen DC2, which has no additional reinforcement around edges of the opening. Figure 21d shows load deflection relationships
for specimens with additional vertical bars left and right the opening. The enhancement in the ultimate load was 13% and 23%, for Specimens DR2 and DR3 over that of Specimen DC2, which has no additional reinforcement. Figure 21e shows the load-deflection relationships for specimens provided with additional reinforcement at all sides. It can be seen from the figure that the load carrying capacity increases with increasing addition reinforcement around all side of the opening. For example, the increase in the ultimate load and corresponding ultimate deflection for Specimen DY2 were 18% and 12%, compared to those of Specimen DC2, which has no additional reinforcement. In addition, the increase in the ultimate load and corresponding ultimate deflection of Specimen DY3 were 30% and 28% over those of Specimen DC2, which has no additional reinforcement. The parametric results showed that adding additional reinforcement around the openings could be considered as internal stiffening of the beams around openings.
5. Rational Prediction of Results (Strut-and Tie-Modelling)
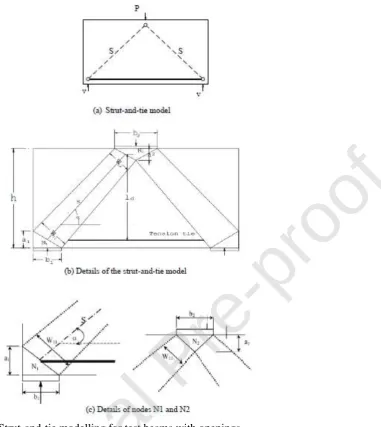
Most of Strut-and-tie models (STM) for simple deep beams with openings in literature are based on experimental results for crack patterns and modes of failure (Marti, 1985; Tan et al., 2003; Foster and Gilbert, 1998; Elazab, 2007; Sahoo, 2012; ACI 318-14, 2014; El-Demerdash eta l., 2015). In the current research, the STM was applied to the studied specimens similar to the analysis carried out earlier by Foster and Gilbert, 1998; Elazab, 2007; El-Demerdash, 2015 who had single midspan loading (Type I) which is similar to the applied loads in the current research. Figure 22 shows a simple deep beam with a single top point load at its mid-span along with the proposed Strut-and-Tie model (Figure 22a). The model has two concrete struts, S, one tension tie T, and three nodes N1 and N2 (Figures 22b and c). The load transferred directly from point load to support through the concrete, S (Figure 22c). The steps for solving the beams by the numerical procedure for one concentrated point Loads is detailed as follows:
(a) Input data
The terms of beam size (h, b, b1, and b2), (a/d), and the used concrete and reinforcement
strength (f ′c, and f y) are known as input data.
(b) The internal lever arm Ld
a =2 c+
1
1
n
s
str
i
i
(5)Thus
1 2
Ld h 0.50 a a (6)
And a2 =0.80a1
(c) Inclination of strut S
1 =tan a d L (7)
(d) Strut widths W1av and W2:
From the details of node N1, shown in Figure 22c, W11 may be obtained from:
11 1 1
W
a
cos
b
sin
(8) from equilibrium of truss forces,T = S cos (a) (9) At node 1
T = 0.80 fc a1 b (10)
Where the value (0.80), represents the effectiveness factor of the nodal zone (νn) (Foster and
Gilbert, 1998) at node N2.:
Scosα = 1.0 f a bc 2 (11) Where the value (1.0), represents the effectiveness factor of the nodal zone (ν).
a2 = 0.8 a1
Also, from the geometry of node N2, W12 is given by:
2 12 2
W cos sin
2
b
a
(12) 11 12 1 W W W 2 av (13)
(e) Truss forces
Assuming that the steel bars reach their yield strength (fs = fy), the compressive and tensile
forces in the truss members are as follows:
T = As fy (14)
V = S sinα (15)
(f) Check of the stress limits
- Concrete struts:
The effective concrete compressive strength in the concrete struts can be obtained from:
'
ce s c
f = f
v
(16)Where the values of effectiveness factor (νs) for struts S1 and S2 are chosen (Foster and
Gilbert, 1998), then check if
1
s ce av
S f W b (17)
- Nodes:
The effective concrete compressive strength in the nodal zones can be obtained from:
'
ce c
f =
v
nf
(18) Where the values of effectiveness factor (νn) for nodes N1 and N2 are chosen (Foster andGilbert, 1998).
Check the following conditions at node N1:
1 W
ceN 11
S f b (19) 1
ceN 1
V f b b (20) 1
ceN 1
T f a b (21) 2
ceN 12
S f W b (22) 2
ceN 2
P f b b (23)
If the above-mentioned checks are satisfied, the required ultimate shear capacity can be obtained.
The proposed (STMs) for tested deep beams are plotted in Figure 23 where the dotted lines indicate the compression members while continuous lines indicate the tension members. All the experimentally tested beams were solved using STM approach using the steps in the above equations and the models for tested beams are detailed in Figure 23. Results obtained
by the STM are recorded in Table 6. It can be seen from Table 6 that the STM underestimates the shear of the studied beams compared to experimental results for different tested beams. In addition, the experimental results were in acceptable agreement with those obtained using STM in most cases. Moreover, comparing the results in Table 4 with those in Table 6 shows that the finite element results are more accurate than those obtained by STM. However, the STM can be used as a rational approach for the analysis of LWC deep beams with openings which contain polystyrene balls as coarse aggregates.
6. CONCLUSIONS
This paper covers the gap in the literature since it contains more studied variables such as partial replacement of coarse aggregate by polystyrene foam balls, the number of openings, web reinforcement ratio and positioning the openings in shear zone. The authors carried out experimental work, finite element technique, and rational STM approach in this research to study the shear behavior of studied beams subjected to single midspan concentrated loads. The following conclusions can be drawn from this study:
1. The overall weight of deep beams containing polystyrene foam balls as partial replacement of coarse aggregate was less than their counterparts of NWC deep beams by approximately 30% while their shear behavior and mode of failure were almost similar to their counterparts of NWC ones. This is very interesting and promising to build lighter deep beams with efficient structural behaviour.
2. Shear span-to-depth ratio (a/d) has a considerable effect on the cracking and the ultimate shear strength of deep beams with openings. The development of initial flexural cracks was more rapid in specimens with a larger value of shear-span-to depth ratio. Increasing a/d ratio from 0.97 to 2.08 led to reduction of the cracking and the ultimate shear strengths by approximately 50% and 12%, respectively.
3. The presence of openings in the shear span considerably reduced the ultimate strength of the specimens. Size of the web openings has a major impact on the failure mode and ultimate shear strength of reinforced LWC deep beams. Increasing the depth of the opening from 20% to 40 % of the total beam depth led to reduction in the ultimate load by 28% and 46.4% compared to that of similar solid deep beams.
4. Locating the opening in mid shear span zone leads to a high reduction in shear strength. Increasing the width of the opening in the shear zone led to reduction of the ultimate load of the specimens up to 66%.
5. Application of finite element modelling to test beams, yielded very good prediction of load-carrying capacities, cracking pattern and load-deflection relationships.
6. The parametric study carried out by finite element showed that increasing tensile steel reinforcement ratio (bottom reinforcement) led to an increase of the ultimate shear capacity and ultimate displacement. In addition, internal stiffening of the beams around openings increased the shear capacity and the displacement ductility. The enhancement of shear capacity was approximately up to 30%.
7. Prediction of experimental results using strut-and-tie model was carried out successfully and the agreement was acceptable in most cases but the finite element
results were more accurate than those obtained by STM. However, the STM can be used as a rational approach for the analysis of LWC deep beams with openings which contain polystyrene balls as coarse aggregates.
8. Based on the results of this research, it is recommended that the depth of opening should not exceed 20% of the deep beam depth. If the depth of opening is more than that or lies in the shear span it is highly recommended for strengthening the opening internally by additional reinforcement around perimeter of the opening.
Conflict of interest
This is to declare that all the authors have no conflict of interest.
ACKNOWLEDGENMENT
October 6 Universities is acknowledged for funding this research project. The experimental work was carried out in the reinforced concrete laboratory at Ain Shams University. Technicians and staff are acknowledged for their valuable assistance.
REFERENCES
Abd Elhameed, G. (2018). “Analytical Study for Behavior of Reinforced Lightweight Concrete Deep Beams with and without Web Openings”, MSc Thesis, Ain Shams University, Egypt, 140 pp.
Abduljalil, B. S., 2014, “Shear Resistance of Reinforced Concrete Deep Beams with Opening Strengthened By CFRP Strips” Journal of Engineering and Development, Vol. 18, No.1, ISSN 1813- 7822, pp. 14-32.
ACI Committee 318, ″ Building Code Requirements for Reinforced Concrete and Commentary (ACI 318-14), ″ American Concrete Institute, Farmington, Hills, MI, 2014. Adam, M. A., Said, M., and Elrakib, T. M. (2016). “Shear performance of fiber reinforced self-compacting concrete deep beams,” International Journal of Civil Engineering and Technology (IJCIET), Volume 7, Issue 1, January-February, pp. 25 – 46.
Ahmed, A, Fayyadh, M. M., Naganathan, S., and Nasharuddin, K. (2012). “Reinforced concrete beams with web openings: A state of the art review”, Materials and Design, Vol. 40, pp. 90-102. http://dx.doi.org/10.1016/j.matdes.2012.03.001
AL Nasser, S., Jamal Shannag, M., and Charif, A. (2014). “Structural Behavior of Reinforced Concrete Beams made with Natural Lightweight Aggregates” Proc. of the Second Intl. Conf. on Advances In Civil, Structural and Environmental Engineering, ACSEE 2014.
Alsaeq, H.M. (2013). “Effects of Opening Shape and Location on the Structural Strength of R.C. Deep Beams with Openings”, World Academy of Science, Engineering and Technology International Journal of Civil, Environmental, Structural, Construction and Architectural Engineering Vol. 7, No 6, pp. 494-499.
Al-Shora, A. T. (2005). “Design and Detailing of Deep Beams,” Ph. D thesis in Structural Engineering, awarded from the Faculty of Engineering, El-Mansoura University Egypt, 2005.
Amiri, S., Masoudnia, R., and Ameri, M. A. (2011). “A review of design specifications of opening in the web for simply supported RC beams”, Journal of Civil Engineering and Construction Technology, Vol. 2, No. 4, pp. 82-89, April, http://www.academicjournals. org/jcect
ANSYS 13.0, Coupled Structural/Thermal Analysis, (ANSYS Tutorials). Copyright 2010 by University of Alberta.
Ashour, A. F. (2000). “Shear Capacity of Reinforced Concrete Deep Beams,” Journal of Structural Engineering, V. 126, No. 9, September 2000, pp. 1045-1052.
Beshara, F. B.A., Shaaban, I.G. and Mustafa, T.S. (2015). "Strut-and-Tie Modelling of R.C. Continuous Deep Beams", ASEC 2015 Conference in Algeria, 12- 15 December 2015.
Brown, M. D, Sankovich, C. L., Bayrak, O., Jirsa, J. O., Breen, J. E. and Wood, S. L. (2006). “Design for Shear in Reinforced Concrete Using Strut and-Tie Models.” Report No. 0-4371-2, Center for Transportation Research, University of Texas at Austin, Austin, Texas.
Doh, J-H., Yoo, T-M., Miller, D., Guan, H., & Fragomeni, S. (2012). “Investigation into the behavior of deep beam with web openings by finite element”, Computers and Concrete, Vol. 10, No. 6, pp. 609-630. https://doi.org/10.12989/cac.2012.10.6.609.
Elazab, M.F., 2007, “Behavior of Reinforced High Strength Concrete Deep Beams with Web Openings”, MSc. Thesis, Mansoura University, 169 pp.
El-Demerdash, W.E., El-Metwally, S.E., El-Zoughiby, M.E., and Ghaleb, A.A., 2015, “Behavior of RC Shallow and Deep Beams with Openings Via the Strut-and-Tie Model
Method and Nonlinear Finite Element”, Arabian Journal for Science and Engineering, ISSN 1319-8025, DOI 10.1007/s13369-015-1678-x
El Maaddawy, Tamer, and Sayed Sherif. "FRP composites for shear strengthening of reinforced concrete deep beams with openings." Composite Structures 89, no. 1 (2009): 60-69.
European Committee for standardization. (2004) EN 1992-1-1 Eurocode-2: design of concrete structures – Part 1-1: general rules and rules for buildings, European Committee. Foster,J. S, and Lan Gilbert, R., “Experimental Studies on High- Strength Concrete Deep
Beams, ” ACI Structural Journal, V. 95, No. 4, July 1998, pp. 382-390.
Haque, M., Rasheeduzzafar, and Al- Tayyib, A.H. (1986). “Stress Distribution in Deep Beams with Web Openings,” Journal of Structural Engineering, Vol. 112, No. 5, pp. 1147-1165.
Huang, C. H., Chen, L. H., Kan, Y.C., Wu, C. H., and Yen, T. (2011). “Shear behavior of full size reinforced lightweight concrete beam. Dahan Institute of Technology, Hualien, Taiwan. Hussain, H. K. (2018). “FINITE ELEMENT ANALYSIS OF DEEP BEAM UNDER DIRECT AND INDIRECT LOAD. Kufa Journal of Engineering Vol. 9, No. 2, pp. 152-167, http://dx.doi.org/10.30572/2018/kje/090212
Ibrahim, M.A., El Thakeb, A., Mostafa, A.A., and Kottb, H.A. (2018). “Experimental Study of New Reinforcement Details for Reinforced Concrete Deep Beams with Shear Opening”, Al-Azhar University Civil Engineering Research Magazine (CERM), Vol. 40, No. 1, pp. 347-367.
Jasim, W. A., Allawi, A. and Oukaili, N.K. (2019). “Effect of Size and Location of Square Web Openings on the Entire Behavior of Reinforced concrete Deep Beams”, Civil Engineering Journal, Vol. 5, No. 1, pp. 209-226.
Jensen, D. F. (2014). “Reliability Analysis for Shear in Lightweight Reinforced Concrete Bridges Using Shear Beam Database”, Msc. Thesis, Utah State University.
Kong, F., and Sharp, G. (1973). “Shear strength of lightweight reinforced concrete deep beams with web openings”, The Structural Engineer, Vol. 51, No 8, pp. 267-275.
Lafta, J. L. and Ye, K. (2016). “Specification of Deep Beams Affect the Shear Strength Cap”, Civil and Environmental Research, ISSN 2224-5790 (Paper) ISSN 2225-0514 (Online), Vol.8, No.2, 2016, www.iiste.org
Mansur, M.A., and Alwist, W.A., 1984, “Reinforced Fiber Concrete Deep Beams with Web Opening”, International Journal of Cement Composites and Lightweight Concrete, Volume 6, No. 4, pp. 263-271.
Marti, P. (1985). ″Truss Models in Detailing, ″, Concrete International, Vol. 7, No. 12, pp. 66-73.
Montoya E, Vecchio FJ and Sheikh SA (2001) “Compression field modeling of confined concrete”, Struct. Eng. Mech 123: 231–248.
Moradi, M. and Esfahani, R. (2017). “Application of the strut-and-tie method for steel fiber reinforced concrete deep beams”, Construction and Building Materials, Vol. 131, pp. 423–
437. http://dx.doi.org/10.1016/j.conbuildmat.2016.11.042 Moussa, A., Mahmoud, A., Abdel- Fattah, W., and Abu- Elmagd, S. (2003). “Behavior of
R.C. Deep Beams with and without Openings, ” Proceedings of the 5th Alexandria International Conference on Structural and Geotechnical Engineering, Structural Engineering
Department, Faculty of Engineering, Alexandria University, 20-22 December 2003, pp. CR185-CR202.
Nair, N and Kavitha P.E. (2016). “Effect of openings in deep beams with varying span to depth ratios using strut and tie model method”, IOSR Journal of Mechanical and Civil Engineering (IOSR-JMCE) e-ISSN: 2278-1684,p-ISSN: 2320-334X, PP 78-81. www.iosrjournals.org
Ramadan, M., 2017, “Experimental Study of Behavior of Reinforced Lightweight Concrete Deep Beams with Web Openings”, MSc. Thesis, Ain Shams University, 115pp.
Sahoo, D. R., Flores, C. A., and Chao, Shih-Ho, 2012, “Behavior of Steel Fiber-Reinforced Concrete Deep Beams with Large Opening”, ACI Structural Journal, Vol 109, No. 2, pp. 193-204.
Sathiyamoorthy, K. (2016). “Shear and Flexural Behaviour of Lightweight Self-Consolidating Concrete Beams”, A PhD Thesis Presented to Ryerson University In Partial Fulfillment of the Requirements for the Degree of Master of Applied Science In the Program of Civil Engineering Toronto, Ontario, Canada.
Shather, L.M., Hussein, S.N., and Hasan, L. F. (2018). “Theoretical Evaluation of RC Deep Beam with Web Opening by Using Nonlinear Finite Element Software [ABAQUS]”, International Journal of Scientific & Engineering Research Vol. 9, No. 5, ISSN 2229-5518. Shaaban, I. G. (1999). “Structural Behaviour of Reinforced Concrete Deep Beams with and without Openings,” Civil Engineering Research Magazine (CERM), Al-Azhar University, Cairo, Egypt, Vol. 21, No. 4, pp. 879-899.
Shanmugam. N.E., and Swaddiwudhipong, S., 1988, “Strength of fiber reinforced concrete deep beams containing openings”, International Journal of Cement Composites and Lightweight Concrete, Volume 10, No. 1, pp. 53-60.
Smith, N. K., and Vantsiotis, S. A. (1982). “Deep Beam Test Results Compared with Present Building Code Models,” ACI Journal, Vol. 79, No. 3, pp. 280-287.
Soroushian P and Lee CD (1989) ‘Constitutive modeling of steel fiber reinforced concrete under direct tension and compression’, fiber reinforced cements and concrete: recent developments. Proceedings of International Conference, Cardiff, UK, pp. 363–377.
Tan, K. H., Tong, K., and Tang, C. Y., (2003), “Consistent strut-and-tie model of deep beams with web openings”, Magazine of Concrete Research, Vol. 55, No. 1, pp. 65-75.
Yang, Keun-Hyeok, Hee-Chang Eun, and Heon-Soo Chung. "The influence of web openings on the structural behaviour of reinforced high-strength concrete deep beams." Engineering Structures 28, no. 13 (2006): 1825-1834.
Figure 1 Reinforcement details
Figure 2 Typical dimensions of tested beam
Figure 3 Test setup
Figure 4 Crack pattern and failure of tested deep beams
Figure 5 Crack and ultimate load of tested deep beams
Figure 6 Effect of small opening on load-midspan deflection of specimens
Figure 7 Effect of wide opening on load-midspan deflection of specimens
Figure 8 Effect of concrete types on load-midspan deflection of specimens
Figure 9 Effect of number of rows of openings on the load-midspan deflection of specimens
Figure 10 Effect of shear span to depth ratio on the load-midspan deflection of specimens
Figure 11 Strain in steel reinforcement of different studied specimens
Figure 12 Geometry of 3-D Solid 65 Element (ANSYS 13.0)
Figure 13 Link8-Element (ANSYS 13)
Figure 14 Stress-strain curve for concrete (Montoya et al., 2001)
Figure 15 Stress-strain curve for steel reinforcement (Soroushian and Lee, 1989)
Figure 16 Meshing of cross section
Figure 18 Comparison between predicted and experimental crack pattern and failure modes for selected beams.
Figure 19 Deformed shape of selected beams.
Figure 20 NLFEA and experimental Load-deflection for tested deep beams
Figure 21 Parametric study for the effect of tensile and additional reinforcement on the load-midspan deflection relationships
Figure 22 Symbols and details of Type I model for simple deep beam subjected to single point load
Figure 23 Strut-and-tie modelling for test beams with openings
Table 1 Experimental program
*Opening notations are shown in Figure 2 Location of openings & Opening Notation Table 2 Mix proportions
Table 3 Mechanical properties of concrete Opening*
Notation Stirrups
Shear span to depth ratio (a/d) B ea m Gr oup Concrete type b v
ρv =Av /s (%) dv (mm) h S (mm) ---1A13 1A12 2A12 0.707 0.707 0.707 0.707 6 6 6 6 100 100 100 100 0.97 0.97 0.97 0.97 1 C LW B 2 C LW B 3 C LW B 4 C LW B 1 LWC 1B22 2B22 2B21 1B22 1B22 0.442 0.442 0.442 0.442 0.442 6 6 6 6 6 160 160 160 160 160 0.97 0.97 0.97 1.63 2.08 5 C LW B 6 C LW B 7 C LW B 8 C LW B 9 C LW B 2 2B22 2B21 1B22 1B22 0.442 0.442 0.442 0.442 6 6 6 6 160 160 160 160 0.97 0.97 1.63 2.08 6 C NW B 7 C NW B 8 C NW B 9 C NW B 3 NWC Concrete type Cement ) ( Sand ) ( Gravel ) ( w/c ratio Super-Plasticizer ) ( Silica fume ) ( Polystyrene Foam ) ( Light
weight 420 630 630 0.30 2.8 40 330 Normal
weight 350 630 1260 0.5 - -
-cu
Target f Cube strength(N/mm2)
Cylindrical compressive strength
Concrete type
)
2
(N/mm
7 days 28 days
)
2
(N/mm 28 days LWC 25 19.7 26.3 20.16 NWC 25 17.6 25.6 19.62
Table 4 Experimental and finite element analysis results Group Beam
Table 5 Parametric study using ANSYS
Table 6Error! No text of specified style in document. Prediction of experimental results using the strut-and-tie model Group Beam (2Vuexp)KN (2VuSTM)KN VuSTM/Vuexp
Numerically Studied
Beams Notation
Openings Notation
Steel Reinforcement Openings additional Top & bottom
reinforcement
Openings additional left and right reinforcement Bottom Top
DA1 - 4Ø12 2Ø10 - -DA2 - 4Ø16 2Ø10 - -DA3 - 4Ø22 2Ø10 - -DC1 1A12 4Ø12 2Ø10 - -DC2 1A12 4Ø16 2Ø10 - -DC3 1A12 4Ø22 2Ø10 - -DK2 1A12 4Ø16 2Ø10 2Ø12 -DK3 1A12 4Ø16 2Ø10 2Ø16 -DR2 1A12 4Ø16 2Ø10 - 2Ø12 DR3 1A12 4Ø16 2Ø10 - 2Ø16 DY2 1A12 4Ø16 2Ø10 2Ø12 2Ø12 DY3 1A12 4Ø16 2Ø10 2Ø16 2Ø16