O R I G I N A L P A P E R
Open Access
Determinants of urban public transport
efficiency: case study of the Czech Republic
Hana Fitzová, Markéta Matulová
*and Zden
ě
k Tome
š
Abstract
Purpose:The aim of this paper is to identify the factors influencing efficiency of urban public transport (UPT) systems and to benchmark Czech UPT systems according to their efficiency.
Methods:The analysis was carried out on a sample of 19 UPT systems in the Czech Republic during 2010–2015. Efficiency was evaluated through a two-stage analysis. Data envelopment analysis (DEA) was used in the first stage. It was based on three inputs (employees, rolling stock and energy) and one output (passengers). DEA efficiency scores were computed for all 19 systems for each year and under two different assumptions regarding returns to scale. In the second stage of the analysis, DEA scores were used in Tobit regression with a set of operational, socio-economic, and demographic explanatory variables in order to find determinants of efficiency.
Results:Several variables were identified as factors increasing efficiency - proportion of drivers, average vehicle age, the presence of tramlines in the city, total vehicle kilometres, and population density. Some variables were identified as decreasing efficiency–ticket price, proportion of subsidies in revenues, and presence of a two-city system. Czech cities with most efficient transport systems were Prague, Brno, Mariánské Lázně, Olomouc, and Pilsen. The least efficient cities were Chomutov–Jirkov, Ostrava, and Děčín.
Conclusions:The principal lesson from this study is that bigger cities with greater population densities are more efficient than smaller cities, and the key efficiency factors that local authorities have under their control are the ticket price, rate of subsidies, and structure of the city transport system. The paper contributes to current debate about the efficiency of the urban transport systems and their determinants. There was not much difference between the constant and variable returns to scale results. The results from the second stage could help policy makers make the public transport systems more efficient. Future research could be devoted to gaining data on additional operators which would also enable using additional inputs and outputs for DEA analysis.
Keywords:Czech Republic, DEA, Efficiency, Public transport, Tobit regression
1 Introduction
Urban public transport is currently rising in importance. Increasing traffic congestion in cities and growing inter-est in environmental issues mean that urban public transport constitutes the preferred transport mode in cities. In the Czech Republic, urban public transport companies function as monopolies in their cities because they operate solely within their own local markets. Thus, the companies are not directly disciplined by market forces. Moreover, their operations are usually subsidized using public funds. Therefore, their efficiency in providing
transport services is not automatically guaranteed. So it is useful to measure, evaluate, and benchmark the efficiency of their operations. Higher efficiency in public transport systems can lead to better services and more appropriate use of public money. The results of such analysis help to identify the operating conditions that are the most import-ant to achieving good performance and that can be used as a guide for public policy.
The importance of this issue is high in post-communist countries within Central and Eastern Europe, because public transport used to be the dominant mode of trans-port in post-communist cities in Central Europe, but now it is threatened by the growing usage of cars. Pusher and Buhler [1] stated that increasing car ownership and rapid * Correspondence:marketa.matulova@econ.muni.cz
Faculty of Economics and Administration, Masaryk University, Lipová 41a, 60200 Brno, Czech Republic
motorization pose significant challenges to public trans-port in these countries. They argued that those problems which increased car ownership brought to Western Euro-pean cities, such as pollution, noise, and accidents, are now also plaguing post-communist countries and that re-solving them will require efforts to expand and improve urban public transport services. The advantage that Cen-tral European countries have is their extensive public transport networks that can be still utilized, but they must be efficient. The presented case of Czech urban transport systems is typical of Central European countries in that it has extensive network lines but has been through serious decline in public transport ridership [2–4]. Therefore, such an efficiency analysis can be useful for systems that have undergone serious decline in ridership and are con-templating revitalization.
There is a lack of systematic research in this area in Central Europe. A survey of 461 articles on data en-velopment analysis (DEA) applied to transport efficiency during 1989–2016 performed by Cavaignac and Petiot [5] showed that the region is covered by only a few stud-ies of this type. No post-communist Central and Eastern European countries are mentioned in the survey by De Borger et al. [6]. We are aware of no study in Poland, only one study in Hungary [7], and three studies in Slovakia [8–10]. Only two studies have been performed in the Czech Republic – Roháčová [11] evaluated the cost efficiency of 8 selected operators and Matulová and Fitzová [12] used network DEA to assess 19 Czech pub-lic transport operators over 13 years. Building on this previous work, the current paper broadens the scope and evaluates the efficiency of urban public transport systems in the Czech Republic during 2010–2015 as well as the determinants of their efficiency.
One of the objectives of this paper was to benchmark Czech UPT systems. Efficiency was evaluated using two-stage data envelopment analysis with one output (passengers) and three inputs (employees, rolling stock and energy). DEA efficiency scores were computed for all 19 systems for each year. The contribution of this study lies not only in throughout analysis of the Czech cities, furthermore due to panel data we were able to analyse changes in time. Main objective of the paper was to identify the determinants of the efficiency, so in the second stage of analysis, DEA scores were used in Tobit regression on a set of operational, socio-economic, and demographic explanatory variables. The uniqueness of our approach lies in fact that in order to identify poten-tial effects we utilized a wide portfolio of explanatory variables; some of them are quite original and have not been used in previous studies. The methodology of the paper controlled for differences between constant and variable returns to scale and inclusion/exclusion of the biggest cities, therefore its results add to the debate how
efficiency of the urban transport systems is affected by economies of scale.
The paper is structured as follows: Section 2 reviews relevant literature, Section 3 explains the methodology, Section4describes the data, Section5describes and dis-cusses the empirical results.
2 Literature review
regression is often preferred, as efficiency scores are bounded by zero from below and by one from above with a positive probability to take on the value at the end of the interval.
The most important step in this research methodology is to identify the explanatory factors in Tobit regression. Their specification is affected by the transport mode and the aim of the analysis. Therefore, in an analysis of rail transport, Cantos et al. [18] included management’s de-gree of autonomy and financial independence, with the result that these factors increased efficiency. Driessen et al. [20] utilized total area, GDP per capita, population density, traffic structure, and traffic density as explanatory variables and found that traffic density increased effi-ciency. Merkert and Hensher [21] analysed airline effi-ciency and utilized as explanatory variables airline size, aircraft size, stage length, aircraft families, and fleet age, all of which had a significant influence. The most relevant studies are studies from urban transport. Nolan [29] ana-lysed data on mid-sized bus transit companies in the United States and determined that average fleet age and peak-to-base ratio increased efficiency and average speed decreased efficiency. The effect of subsidies was unclear. Tsai et al. [23] performed an international comparison of the efficiency of urban rail systems and found that the number of stations significantly influenced technical ciency, with the key determinant of allocative and cost effi-ciency being population density. Important determinants of efficiency levels can be also identified on the demand side of public transport. Following this line of reasoning, Paulley et al. [30] analysed the effects of fares, quality of services, income, and car ownership on demand and Metz [31] ana-lysed the effect of demographic determinants on demand.
Understanding of efficiency determinants is an import-ant tool for guiding public policy on urban transit. The relationship between a public authority and an urban public transport firm can be viewed as an application of the principal–agent problem [32, 33], where the agent has motivation to hide actual information about its per-formance from the principal in order to obtain more le-nient conditions for operation. It is therefore important for municipal authorities to have information about the relative performance of different urban public transport systems as well as the determinants of performance dif-ferences among them.
There has been little research regarding the efficiency of urban public transport in countries within Central and Eastern Europe. Some relevant studies have come from Budapest [7] and Slovakia [8–10]. Only a few stud-ies have used data from the Czech Republic. Roháčová [11] analysed the cost efficiency of eight Czech public transport operators in 2009. She utilized DEA and came to the conclusion that the most efficient urban transport systems in 2009 were found in Prague, Brno, Pardubice,
and Chomutov–Jirkov and the least efficient was in Os-trava. Matulová and Fitzová [12] analysed the efficiency of 19 operators over 2004–2016 using a different meth-odology. However, this existing research lacks identifica-tion of efficiency determinants.
3 Methodology
The analysis consisted of five steps: selecting decision-making units (DMUs), specifying input and output vari-ables, specifying the model, calculating scores, and an ex-planatory analysis of technical efficiency.
3.1 Selection of DMUs
The selected DMUs were publicly owned transport com-panies fully owned by the respective city councils. The transport systems involved in the analysis included all Czech multi-mode operators (there are 17 multi-mode sys-tems; all of them have buses, 7 of them operate also tram lines, 13 operate trolleybus systems, and 1 in Prague oper-ates a metro) and bus operators in 2 cities (Děčín, which has special geographic characteristics, and the spa city of Karlovy Vary). This selection was motivated in part by the operators’membership in the Czech Association of Public Transport Companies (SDP ČR), which provided statis-tical data essential for the analysis. Since there is only one operator in each member city, we denoted units by the names of the cities (with the exception of four operators providing urban transport in the agglomeration of two cit-ies, namely Chomutov–Jirkov, Liberec–Jablonec, Most– Litvínov, and Zlín–Otrokovice). Figure1 presents a map of the DMUs selected.
3.2 Specification of input and output variables
standard deviations of input and output variables and length of lines divided into three groups: all DMUs, all DMUs except Prague, and all DMUs except Prague and Brno (see Section5).
3.3 Specification of the model
DEA represents a suitable approach for comparing relative performance in cases where multiple inputs and outputs are present but their relative weights are not evident. Ac-cording to Link [34], DEA is a practical tool for efficiency analysis in transport and can be successfully applied to rela-tively small samples. DEA uses linear programming on ob-served data in order to construct a production frontier against which the efficiency of each unit is measured. The principle advantage of DEA is that it enables measurement of efficiency levels without the need to specify the frontier’s functional form. It also does not require information about input prices or behaviour aimed at profit-maximization or cost-minimization. There are some limitations to DEA, es-pecially its sensitivity to outliers. There are two basic DEA models: the model suggested by Charnes et al. [35] as-suming returns to scale (RTS) to be constant (so called CCR model) and the model of Banker, Charnes, and Cooper (so called BCC model) which allows variable RTS (see [36] or [37]). According to Agarwal et al. [38], RTS do not have a clear tendency in the area of public transport. A slight majority of the units in that study operated under increasing RTS, but there were also some units with constant or decreasing RTS. We de-cided to employ models with both variable returns to scale (VRS) and constant returns to scale (CRS) and compare their results.
In the CRS models, the sample ofnDMUs with input vectors Xj and output vectors Yj, (j= 1,…,n) is consid-ered. The relative efficiency score of the j0-th DMU is
calculated from the linear programming problem
max
u;v uYj0 ð1Þ
subject to the constraints
vXj0¼1 ð2Þ
uYj≤vXj;j¼1;…;n; ð3Þ
u≥ε;v≥ε; ð4Þ
where ε is a positive infinitesimal constant. When this model is used, it is common practice to select a very small value forε; the exact value ofεused for calculation in this study was 10−6. The VRS model includes the add-itional variableμof arbitrary sign, which is added to the virtual output uYj0in the objective function and to vir-tual outputsuYj in the constraints. The efficiency score
of the DMU under evaluation is given by the optimal value of the objective function. Only those DMUs with an efficiency score equal to 1 can be evaluated as technic-ally efficient units. Other units have scores lower than one which represents the level of input reduction necessary to achieve frontier performance. This study employed“input orientation”because we assumed inputs to be more freely adjustable for most public transport companies.
3.4 Calculation of scores
This step represents the final output of the first stage of the analysis. Scores were calculated using the R Project for Statistical Computing.1 Table 3 presents the results. To check robustness, both the CRS and VRS models were employed and three different cases were considered for each model (see Section5).
3.5 Explanatory analysis of technical efficiency
In the second stage of the analysis, we tried to explain the obtained DEA scores using a number of variables ex-pressing various characteristics of the DMUs and also to evaluate their impact on the level of efficiency. Explana-tory variables for the model were selected according to available sources in the literature. In addition to com-monly used economic, socio-economic, and operational variables, some political and demographical variables were used (see Table 4). We used a common approach employing two-limit Tobit regression to estimate this re-lationship, as efficiency scores are bounded by zero from below and by one from above with a positive probability to take on the value at the end of the interval. We used the data sample from 6 years as this approach enlarges the total number of observations which makes it possible to use more explanatory variables in the model. This ap-proach has been commonly used in similar studies, such as [23, 29, 39]. There is a possibility of a presence of panel effect as for the same city but different years, the CRS scores are similar. However, we did not employ the panel dimension of the data sample. The use of fixed ef-fect panel model was limited by the importance of time-invariant explanatory variables. Results of Haus-mann test and intratemporal correlations contradicted the suitability of random effect panel model. In the case of a longer time period, it would be suitable to incorporate the panel structure into the model to get more consistent estimates. It remains our topic for further research and we need more observations and possibly more time-varying explanatory variables to investigate it.
4 Data
after 16 years of the programme’s existence. DMUs were selected as described in Section 3, with 19 DMUs in-cluding all multi-mode operators and two bus compan-ies operating in Děčín and Karlovy Vary. All units were members of the SDP ČR, which guarantees that all data were based on the same methodology. Figure 1 depicts the location of the given cities within the Czech Republic.
Table 1 shows the average data for 2010–2015 in the following categories: vehicle-kilometres (VKM) in mil-lions (“VKM”), number of employees calculated as
full-time equivalents (“employees”), total number of ve-hicles (“roll_stock”), material and fuel costs in millions of CZK (“enrg”), total number of passengers in millions (“passengers”), and length of lines in kilometres (“lines_length”).
Table 2 summarizes descriptive statistics (means and standard deviations) for the DMUs. Means and standard deviations differed considerably depending on whether or not Prague was included. This was also true for Brno, but the difference was not as large. For this reason, we
Fig. 1Map of investigated locations
Table 1DMUs and their average characteristics (2010–2015)
City VKM Employees roll_stock enrg Passengers lines_length
Brno 37.7 2720 773 643.5 353.3 938
České Budějovice 5.7 397 142 99.2 38.8 223
Děčín 3.5 195 54 53.1 8.5 146
Hradec Králové 6.1 401 130 94.3 35.7 323
Chomutov–Jirkov 1.9 232 47 51.1 5.8 199
Jihlava 2.9 173 63 26.0 13.7 108
Karlovy Vary 2.6 259 68 50.7 13.0 315
Liberec–Jablonec 8.1 411 200 101.7 38.0 885
Mariánské Lázně 0.5 31 14 6.3 3.9 84
Most–Litvínov 4.8 464 138 97.6 27.5 272
Olomouc 6.2 432 143 86.2 54.2 321
Opava 3.0 182 66 30.2 10.9 203
Ostrava 33.0 2017 631 443.7 95.6 1005
Pardubice 5.7 408 130 69.8 26.6 565
Pilsen 15.1 920 327 214.3 100.9 548
Prague 110.5 10,689 2886 2948.1 1342.7 2238
Teplice 5.6 263 108 186.4 14.9 573
Ústí nad Labem 7.2 486 148 113.2 46.4 477
Zlín–Otrokovice 4.8 338 93 66.2 33.0 247
decided to calculate the models for all three cases – all DMUs, all DMUs except Prague, and all DMUs except Prague and Brno.
Table 3 presents average descriptive statistics for the variables used in the second stage of the analysis. We used variables suggested by economic theory and reviewed lit-erature. All of the variables varied over time except for the three binary variables Is_tram, Doublecity, and Bottleneck, which were constant over time. DMU data comes from the SDP ČR and the companies’annual reports. Popula-tion density was calculated based on data from the Czech Statistical Office, while political information was taken from the city councils. The last seven variables were not included in the models due to lack of statistical signifi-cance (VKM_tot, subs_cost, inv_rate, avr_inv, bottleneck, Party_right, Vehicle_lines).
5 Empirical results
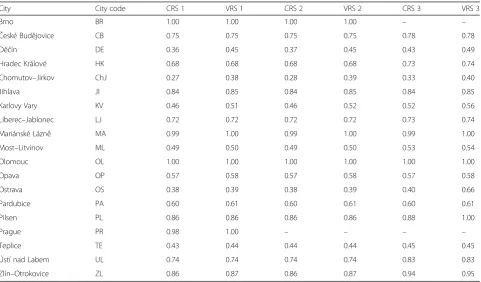
As a result of the first stage of the analysis, we calculated the DMUs’ efficiency scores. Table 4 shows the average efficiency scores during 2010–2015. Models CRS 1 and VRS 1 included all operators, models CRS 2 and VRS 2 excluded Prague, and models CRS 3 and VRS 3 excluded both Prague and Brno.
The most efficient cities are Prague, Brno, Mariánské Lázně, Olomouc, and Pilsen. The least efficient cities were Chomutov–Jirkov, Ostrava, and Děčín. There was not much difference between scores under the CRS and VRS assumptions, with the exceptions of Děčín, Chomu-tov–Jirkov, and Karlovy Vary and also for Ostrava in the model without Prague and Brno.
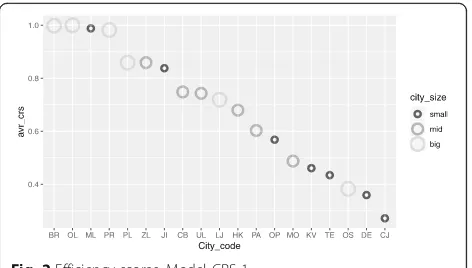
Figure 2 depicts the average efficiency scores from the CRS 1 model for particular DMUs during 2010–2015. Cities are ordered according to their average scores. Smaller and darker circles represent smaller cities (“big” denotes cities with more than 100,000 inhabi-tants, “mid” cities with 70,000–100,000 inhabitants, and“small”cities with fewer than 70,000 inhabitants).
Some patterns in efficiencies emerged from the results. These can be analysed separately for different clusters of
cities. We can distinguish the clusters of: large cities with a university (Prague, Brno, Ostrava, Pilsen, and Olomouc), medium-sized cities (Ústí nad Labem, Hradec Králové,
České Budějovice, and Pardubice), small cities (Opava, Jihlava, and Děčín), two-city systems (Chomutov–Jirkov, Liberec–Jablonec, Most–Litvínov, Zlín–Otrokovice), and spa cities (Karlovy Vary, Teplice, Mariánské Lázně).
The highest efficiency scores can be observed in the two biggest cities of Prague and Brno. This was probably due to high population density and agglomeration ef-fects. Operator efficiency seemed to correlate with city size, with the highest efficiency for the biggest cities, de-creased efficiency for medium-sized cities, and the low-est efficiency for the smalllow-est cities. Two-city transport systems were disadvantaged and had lower efficiency scores. In addition, spa cities generally had lower effi-ciency. There were some exceptions from these patterns, particularly Ostrava and Mariánské Lázně. Ostrava is a large city with very low efficiency and Marianské Lázně is the smallest city in the sample and was very efficient.
We will now turn to the main factors behind the effi-ciency scores of the most and least efficient operators. Be-ginning with the top performers, Prague has the largest public transport system in the Czech Republic. It has the only metro network in the Czech Republic. Prague is an almost fully efficient unit as it has a large passenger load from not only residents but also thousands of university students and tourists. On the other hand, Prague also had the highest proportion of subsidies, the price of a ticket was quite low. Brnois the second largest network in the Czech Republic. It is operated within tariff integrated re-gional system (IDS JMK). The system is based on cooper-ation among South Moravian operators with integrated routes, single fares, unified transport conditions, and opti-mized intervals between links. Trams play the most import-ant role in Brno. Brno has also made a large investment into CNG (a new station and several new vehicles). In addition, it carries out systematic renovation of rolling stock with an emphasis on savings and ecology and has re-constructed parts of several tram lines. Pilsen is also a Table 2Average descriptive statistics for all DMUs (2010–2015)
VKM Employees roll_stock Passengers enrg lines_length
All DMUs
Mean 13.9 1106 324 283 119 509
Standard deviation 24.9 2362 637 652 300 492
Without Prague
Mean 8.6 574 182 135 51 413
Standard deviation 10.0 675 198 160 78 280
Without Prague and Brno
Mean 6.9 448 147 105 33 382
mid-sized city with a university. It has the Pilsen Card system, which is an electronic wallet providing many discounts, not only for public transport. The operator has been systematically innovating since 2012 which may have contributed to rising efficiency of Pilsen. Olomouc is a mid-sized university city. It is fully efficient. It has carried
out large investments, especially from its own resources, aimed at saving fuel. It has low prices, a high proportion of drivers, and an increase in passengers of 5% in 2015, which has not been a common phenomenon recently. Looking at a different type of efficient city,Mariánské Lázněis a spa city with very few inhabitants and quite a large Table 3Descriptive statistics of explanatory variables
Variable Unit Description Min Max Mean St. dev.
Price CZK Price of average single ticket 2.3 9.7 4.3 1.6
Drivers_share % Proportion of drivers in total employees 0.4 0.7 0.5 0.08
Avr_old years Average age of rolling stock 3.1 14.4 8.3 2.2
Is_tram binary Presence of tramway in the system 0 1 0.4 0.5
Subs_rev % Proportion of subsidies in revenues 0.9 2.8 1.5 0.5
Popul_density thousands of inhabitants/km2 Population density 0.26 2.56 1.12 0.57
Net_density km/km2 Line length divided by area 1.2 24.7 4.6 4.9
Doublecity Binary Two-city system 0 1 0.21 0.41
VKM_tot millions Total VKM 0.47 115 14.0 25.0
Bottleneck Binary Presence of public transport bottleneck 0 1 0.05 0.22
Subs_cost % Proportion of subsidies in costs 0.32 0.68 0.52 0.09
Inv_rate % Proportion of investment in costs 0 0.95 0.18 0.21
Avr_inv CZK thousands Average company investment 0.02 2958.5 55.9 653
Vehicle_lines vehicles Number of vehicles per km of line 0.15 1.32 0.45 0.27
Party_right Binary City hall leadership is a right-wing party 0 1 0.38 0.49
Table 4Average efficiency scores of DMUs (2010–2015), CRS and VRS models
City City code CRS 1 VRS 1 CRS 2 VRS 2 CRS 3 VRS 3
Brno BR 1.00 1.00 1.00 1.00 – –
České Budějovice CB 0.75 0.75 0.75 0.75 0.78 0.78
Děčín DE 0.36 0.45 0.37 0.45 0.43 0.49
Hradec Králové HK 0.68 0.68 0.68 0.68 0.73 0.74
Chomutov–Jirkov ChJ 0.27 0.38 0.28 0.39 0.33 0.40
Jihlava JI 0.84 0.85 0.84 0.85 0.84 0.85
Karlovy Vary KV 0.46 0.51 0.46 0.52 0.52 0.56
Liberec–Jablonec LJ 0.72 0.72 0.72 0.72 0.73 0.74
Mariánské Lázně MA 0.99 1.00 0.99 1.00 0.99 1.00
Most–Litvínov ML 0.49 0.50 0.49 0.50 0.53 0.54
Olomouc OL 1.00 1.00 1.00 1.00 1.00 1.00
Opava OP 0.57 0.58 0.57 0.58 0.57 0.58
Ostrava OS 0.38 0.39 0.38 0.39 0.40 0.66
Pardubice PA 0.60 0.61 0.60 0.61 0.60 0.61
Pilsen PL 0.86 0.86 0.86 0.86 0.88 1.00
Prague PR 0.98 1.00 – – – –
Teplice TE 0.43 0.44 0.44 0.44 0.45 0.45
Ústí nad Labem UL 0.74 0.74 0.74 0.74 0.83 0.83
area. On the other hand, the spa has many visitors an-nually (close to the number of inhabitants), and this fact probably strongly influences the number of pas-sengers and the system’s efficiency. The city is fully effi-cient in the VRS models and its score has a growing tendency in the CRS 1 model. The network is quite lim-ited. It is a system with low prices and low VKM but also one that had no investment prior to 2014. The last feature will probably cause problems in future. However, this phenomenon is not present in the other two spa cities (Karlovy Vary and Teplice).
Looking at the least efficient operators, Ostrava is quite a large city with a university and several big indus-trial companies. Ostrava has an unusual geographical pattern with many industrial locations inside inner city. The city suffered a decline in VKM accompanied by a sharp decrease in passengers despite large subsidies en-abling lower fares. It has recently carried out a large in-vestment, which may see positive effects in future.Děčín is a mid-sized city. It terminated its suburban traffic contract with the Ústí nad Labem Region at the end of 2014. Despite decreasing its staff, it suffered large losses especially due to fixed costs and its efficiency declined. Promotion of public transport in the city, shorter vehicles, optimization of the network, and lessoned personnel costs could help to improve the situation.
Chomutov–Jirkov is a very small two-city system with trolleybuses. The system suffered a sharp loss in trans-port volume. It started implementing CNG technology into public transport hoping for a fast return on invest-ment, but this activity will probably not be positively vis-ible in the data until later. The system of lines and stops has also been reorganized, which at first led to many negative reactions and probably also a loss of passengers, though after some rearrangements it seems the situation is improving. It is now under consideration to stop oper-ating trolleybuses, as the trolleybus system seems to be in-efficient. Our results for Chomutov-Jirkov seems to contradict Roháčová’s findings [11], but she uses VKM as an input (which is quite low in Chomutov- Jirkov, see Table1). Moreover she refers to the data from 2009 and according to our computations, Chomutov- Jirkov effi-ciency declined between 2010 and 2013.
Table 5 presents the results from the second research stage. It includes estimations of model parameters for the CRS and VRS assumptions for all DMUs (1), all DMUs except Prague (2), and all DMUs except Prague and Brno (3). The last three rows contain the total num-ber of observations, the numnum-ber of uncensored observa-tions, and the model fit for each model. Model fit was computed as the square of the correlation between the observed and predicted values. The variable VKM was chosen to express certain characteristics such as city size and returns to scale. Unfortunately, it was not
statistically significant in any model specification, so it was excluded from the models. The information about city size is partially contained in the variable Is_tram as trams are only present in large cities.
Larger systems with higher VKM_tot were more effi-cient, but this effect was not statistically significant. Ex-cluding VKM_tot from the models does not change signs of the other explanatory variables and statistical significance of the parameters remains nearly the same. We identified only a slight negative effect from the num-ber of vehicles per km of lines on efficiency in VRS models. Due to this fact, this variable was not included into the final model structure. Transport systems with high service density offer their users frequent services but at the same time are more sensitive to off-peak load factors, as they have to serve also places and times not used very frequently. There was a trade-off between effi-ciency and convenience to final users.
The estimated coefficient of population density was positive and statistically significant for some models; cities with a higher population density had more efficient public transport systems. The network density coefficient was negative, which may signal some redundant lines. We have also included variables measuring operational char-acteristics. Our results indicate that the presence of a tram system (Is_tram) increased efficiency. Doublecity, which denotes a public transport system shared by two close cit-ies, had a significant negative effect in all models. This means that joining cities together produced some ineffi-ciencies. For example, vehicles have to move from one city to another, while probably not many people travel between the cities, although for some people the doublecity trans-port systems is very helpful, especially for commuting to a job in the neighbouring city.
The proportion of drivers in total employees had a sig-nificant positive impact on total efficiency. This can be interpreted as meaning that a higher proportion of drivers means a lower proportion of administrative labour, which does not directly increase output and thereby the effi-ciency of the analysed urban transport systems. The pro-portion of drivers varied from 40% to 70%. The average
age of rolling stock was also statistically significant and surprisingly increased efficiency. The correlation of the average age of rolling stock with the other variables was very small. This surprising result may have been caused by the fact that the investigated period was quite short. Com-panies with lower investments into new vehicles had lower expenses, but the increasing age of their fleet will cause problems (and lower their efficiency) later in future–due to not only more frequent vehicle repairs, but also due to environmental concerns which are gaining in importance. We tried to overcome this problem using different forms of investments by the companies, such as the investment rate, average investment per company, and ratios of in-vestments to costs, line length, area, and population (al-ways with only one“investment variable”per model). The estimated coefficient was positive, which means that com-panies with greater investments had higher efficiency scores. This is more in accordance with our expectations. However, this phenomenon was present only in some model specifications.
We also investigated the proportion of subsidies in total revenues. The higher the proportion of subsidies was, the lower the efficiency score was. This negative effect was sta-tistically significant for all models. Proportion of subsidies in total costs was not statistically significant for any model. Although we tried also including investment rate in our re-gressions, it was not significant in any of the models. It therefore seems that investment in new rolling stock did not improve efficiency in the transport systems analysed. This is probably due to the fact that effects of the invest-ment will not be revealed until later with newer data; in addition, the data does not include the fact that new vehi-cles are friendlier to the environment.
The average price of a ticket had a significant negative ef-fect on efficiency in all models. The efef-fect was robust even
when Prague and Brno were excluded, for both CRS and VRS. We think that higher ticket prices discourage cus-tomers from using public transport,. Finally, we tried to identify the impact of political party, controlling for whether the presence of a left- or right-wing mayor in city hall influenced in any way the efficiency or subsidy level of urban transport systems. We were unable to obtain any robust results.
To summarize the results, positive effects of some trans-port systems operational characteristics on efficiency are in line with previous studies and can be interpreted as mean-ing that bigger and denser transport systems are more effi-cient. The fact that the proportion of drivers increased efficiency was expected as well because it improves the ra-tio of directly productive/unproductive workers in the total labour force. According to our findings both the price and subsidy proportion had significant negative effects. Similar results are prevailing in the literature, but some studies did not come to consistent conclusions [29,40]. By introducing a new dummy variable for two-city systems we found out that these systems had lower efficiency because they had lower densities of operations. Finally, the positive impact of old rolling stock and the non-significant impact of in-vestment rate were quite unexpected. The effect of fleet age may be related to the presence of trams which are usually older than buses. Investment rate would probably be significant in a longer time span. Moreover its influ-ence would be more pronounced if we take into account environmental impacts.
6 Conclusion
The article identified factors influencing urban public trans-port efficiency in a sample of 19 urban public transtrans-port sys-tems in the Czech Republic during 2010–2015. Two-stage analysis was used. DEA efficiency scores were calculated in Table 5Estimations of model parameters
Variable CRS 1 VRS 1 CRS 2 VRS 2 CRS 3 VRS3
Is_Tram 0.57*** 0.52*** 0.60*** 0.56*** 0.57*** 0.58***
Doublecity −0.56*** −0.53*** −0.57*** −0.53*** −0.54*** −0.52***
Drivers_share 0.79*** 0.84*** 0.91*** 0.97*** 0.97*** 0.96***
Price −2.10−5** −2.10−5** −2.10−5** −1.10−5 −2.10−5** −2.10−5**
Subs_rev −0.37*** −0.35*** −0.41*** −0.36*** −0.39*** −0.25***
Popul_density 0.19*** 0.22*** 0.19*** 0.18*** 0.17*** 0.19***
Avr_old 0.021*** 0.018*** 0.022*** 0.022*** 0.025*** 0.028***
Net_density −0.022*** −0.026*** −0.022*** −0.023*** −0.021*** −0.023***
Const 0.52*** 0.50*** 0.49*** 0.43*** 0.47*** 0.29***
Number of obs. 114 114 108 108 102 102
Uncensored obs. 95 91 92 89 90 81
Model fit 0.69 0.67 0.66 0.64 0.63 0.57
the first stage and these efficiency scores underwent regres-sion on a set of operational, socio-economic, and demo-graphic explanatory variables in order to find determinants of efficiency in the second stage.
In the first stage, we identified the two largest cities of Prague and Brno and the two other large cities of Olo-mouc and Pilsen as being among the most efficient cities; also the very small city of Mariánské Lázněhad high effi-ciency scores. The group of cities with the worst scores included Chomutov–Jirkov, Ostrava and Děčín. The inclu-sion or excluinclu-sion of the largest cities in the model had only marginal consequences for efficiency scores.
Regression in the second stage of the analysis revealed some statistically significant effects on efficiency scores. The proportion of drivers, average vehicle age, presence of trams, total VKM, and population density were identi-fied as variables increasing efficiency, meaning cities with higher values for these variables tended to have higher efficiency scores. The surprising effect was the positive impact of the average vehicle age, which is prob-ably a factor with a positive impact only over the short term, but one that will have negative impacts over a lon-ger horizon. The price of a ticket, proportion of subsid-ies in revenues, and presence of a two-city system were identified as variables decreasing efficiency. We also tried to include other control variables (proportion of subsidies in total costs, number of vehicles per km of lines, dummies for presence of right-wing mayor in city hall, bottleneck in a traffic network, etc.), however, they were not statistically significant. The results of the esti-mations were sufficiently robust for most models.
The findings contribute to the general debate in the area of urban public transport efficiency determinants and can be generalized to broader context. It would be interesting to see whether future studies from different countries will prove or contradict our results. Further research could be devoted to gaining data on additional DMUs (other Czech companies without multiple modes, Slovak companies). New data would also enable using another inputs and out-puts for DEA analysis. Comparison with results from net-work DEA or other methods could also provide broader understanding regarding the investigated issue.
7 Endnote
1
The software is available athttps://www.r-project.org/
Acknowledgements
This article was supported by the project "New Mobility - High-Speed Transport Systems and Transport-Related Human Behaviour", Reg. No. CZ.02.1.01/0.0/0.0/16_026/0008430, co-financed by the "Operational Programme Research, Development and Education".
Authors' contributions
HF did all the computations. The text is a joint work of all authors. All authors read and approved the final manuscript.
Competing interests
The authors declare that they have no competing interests.
Publisher’s Note
Springer Nature remains neutral with regard to jurisdictional claims in published maps and institutional affiliations.
Received: 12 May 2017 Accepted: 22 August 2018
References
1. Pusher J, Buehler R (2005) Transport policy in post-communist Europe. In: Button KJ, Hensher DA (eds) Handbook of transport strategy, policy and institutions. Emerald Group Publishing Limited, Bingley, pp 725–743
2. Pucher J (1999) The transformation of urban transport in the Czech Republic, 1988–1998. Transp Policy 6(4):225–236. https://doi.org/10.1016/S0967-070X(99)00023-2
3. Sailer-Fliege U (1999) Characteristics of post-socialist urban transformation in east Central Europe. GeoJournal 49(1):7–16
4. Stead D, de Jong M, Reinholde I (2008) Urban transport policy transfer in central and Eastern Europe. disP-Plan Rev 44(172):62–73
5. Cavaignac L, Petiot R (2017) A quarter century of data envelopment analysis applied to the transport sector: a bibliometric analysis. Socio-Econ Plan Sci 57(C:84–96.https://doi.org/10.1016/j.seps.2016.11.003
6. De Borger B, Kerstens K, Costa Á (2002) Public transit performance: what does one learn from frontier studies? Transp Rev 22(1):1–38.https://doi.org/10.1080/ 01441640010020313
7. Gaal G, Horváth E, Török A, Csete M (2009) Analysis of public transport performance in Budapest, Hungary. Polytech Soc Man Sci 23(1):68–72.
https://doi.org/10.3311/PPso.7724
8. Klieštik T (2009) Kvantifikácia efektivityčinností dopravných podnikov pomocou data envelopment analysis. E M Ekon Manag 12(1):133–145 (in Slovak) 9. KráľP, Roháčová V (2013) Measuring the efficiency of public road
transport companies in the Slovak Republic using DEA and SFA. Statistika 93(2):76–85
10. Roháčová V (2015) A DEA based approach for optimization of urban public transport system. Cent Eur J Oper Res 23(1):215–233.https://doi.org/10. 1007/s10100-013-0314-7
11. Roháčová V (2011) Nákladová efektívnosťvybraných dopravných podnikov
Českej republiky–aplikácia obalovej analýzy dát. Ekonomická revue 14(3): 175–182 (in Slovak)
12. Matulová M, Fitzová H (2018) Transformation of urban public transport financing and its effect on operators' efficiency: evidence from the Czech Republic. Cent Eur J Oper Res.https://doi.org/10.1007/s10100-018-0565-4
13. Roy W, Yvrande-Billon A (2007) Ownership, contractual practices and technical efficiency: the case of urban public transport in France. J Transp Econ Policy 41(2):257–282
14. Brons M, Nijkamp P, Pels E, Rietveld P (2005) Efficiency of urban public transit: a meta analysis. Transportation 32(1):1–21.https://doi.org/10.1007/ s11116-004-0939-4
15. Daraio C, Diana M, Di Costa F, Leporelli C, Matteucci G, Nastasi A (2016) Efficiency and effectiveness in the urban public transport sector: a critical review with directions for future research. Eur J Oper Res 248(1):1–20.
https://doi.org/10.1016/j.ejor.2015.05.059
16. Jarboui S, Forget P, Boujelbene Y (2012) Public road transport efficiency: a literature review via the classification scheme. Public Transp 4(2):101–128.
https://doi.org/10.1007/s12469-012-0055-3
17. Markovits-Somogyi R (2011) Measuring efficiency in transport: the state of the art of applying data envelopment analysis. Transport 26(1):11–19.
https://doi.org/10.3846/16484142.2011.555500
18. Cantos P, Pastor JM, Serrano L (1999) Productivity, efficiency and technical change in the European railways: a non-parametric approach.
Transportation 26(4):337–357.https://doi.org/10.1023/A:1005127513206
19. Cantos P, Pastor JM, Serrano L (2012) Evaluating European railway deregulation using different approaches. Trans Policy 11(24):67–72.https:// doi.org/10.1016/j.tranpol.2012.07.008
20. Driessen G, Lijesen M, Mulder M (2006) The impact of competition on productive efficiency in European railways. CPB Netherlands Bureau for Economic Policy Analysis, the Hague
DEA efficiency scores. Transp Res A 45(7):686–695.https://doi.org/10.1016/j. tra.2011.04.015
22. Kerstens K (1996) Technical efficiency measurement and explanation of French urban transit companies. Transp Res Part A 30(6):431–452.https:// doi.org/10.1016/0965-8564(96)00006-7
23. Tsai CHP, Mulley C, Merkert R (2015) Measuring the cost efficiency of urban rail systems: an international comparison using DEA and Tobit models. J Transp Econ Policy 49(1):17–34
24. Johnson AL, Kuosmanen T (2012) One-stage and two-stage DEA estimation of the effects of contextual variables. Eur J Oper Res 220(2):559–570.
https://doi.org/10.1016/j.ejor.2012.01.023
25. McDonald J (2009) Using least squares and Tobit in second stage DEA efficiency analyses. Eur J Oper Res 197(2):792–798.
https://doi.org/10.1016/j.ejor.2008.07.039
26. Simar L, Wilson PW (2001) Two-stage DEA: caveat emptor. J Prod Anal 36: 205–218.https://doi.org/10.1007/s11123-011-0230-6
27. Banker RD, Natarajan R (2008) Evaluating contextual variables affecting productivity using data envelopment analysis. Oper Res 56(1):48–58.
https://doi.org/10.1287/opre.1070.0460
28. Hoff A (2007) Second stage DEA: comparison of approaches for modelling the DEA score. Eur J Oper Res 181(1):425–435.https://doi.org/10.1016/j.ejor. 2006.05.019
29. Nolan JF (1996) Determinants of productive efficiency in urban transit. Logist Transp Rev 32(3):319–342
30. Paulley N, Balcombe R, Mackett R, Titheridge H, Preston J, Wardman M, White P (2006) The demand for public transport: the effects of fares, quality of service, income and car ownership. Transp Policy 13(4):295–306.
https://doi.org/10.1016/j.tranpol.2005.12.004
31. Metz D (2012) Demographic determinants of daily travel demand. Transp Policy 21:20–25.https://doi.org/10.1016/j.tranpol.2012.01.007
32. Gagnepain P, Ivaldi M (2002) Incentive regulatory policies: the case of public transit systems in France. RAND J Econ 33(4):605–629
33. Gagnepain P, Ivaldi M, Martimort D (2013) The cost of contract renegotiation: evidence from the local public sector. Am Econ Rev 103(6): 2352–2383.https://doi.org/10.1257/aer.103.6.2352
34. Link H (2015) Road and rail infrastructure costs. In: Nash C (ed) Handbook of research methods and applications in transport economics and policy. Edward Elgar, Cheltenham, UK, pp 9–37
35. Charnes A, Cooper WW, Rhodes E (1978) Measuring the efficiency of decision making units. Eur J Oper Res 2(6):429–444
36. Cooper WW, Seiford LM, Tone K (2000) Data envelopment analysis. Kluwer, Boston
37. Cooper WW, Lawrence MS, Zhu J (eds) (2011) Handbook on data envelopment analysis. Springer Science & Business Media, New York 38. Agarwal S, Yadav SP, Singh SP (2011) DEA based estimation of the technical
efficiency of state transport undertakings in India. OPSEARCH 47(3):216–230.
https://doi.org/10.1007/s12597-011-0035-4
39. Karlaftis MG (2004) A DEA approach for evaluating the efficiency and effectiveness of urban transit systems. Eur J Oper Res 152(2):354–364.
https://doi.org/10.1016/S0377-2217(03)00029-8