R E S E A R C H
Open Access
Research on optimization of image fast
feature point matching algorithm
Manyi Wu
1,2Abstract
The author studied the feature point extraction and matching based on BRISK and ORB algorithms, experimented with the advantages of both algorithms, and ascertained optimal pyramid layer and inter-layer scale parameters used in features extraction and matching for the same scale image and different scale images with BRISK and ORB algorithm, and analyzed the effectiveness of different parameters combinations on the accuracies of feature extraction and matching and proposed method to determine parameters based on the results. In addition, comparing with the traditional algorithm, using the optimal algorithm with the parameters combining Gaussian denoising, graying, and image sharpening, the ratio of feature points for detection improved 3%; the number of effective matching points increased by nearly 2%. Meanwhile, an algorithm experiment on UAV image mosaic was carried out. The transition of mosaic image color was more natural, and there was no clear mosaic joint with the stitching effect, which indicated that the optimized parameters and the extracted feature point pairs can be used for matrix operations and the algorithm is suitable for UAV image mosaic processing.
Keywords: BRISK and ORB algorithm, Fast feature detection, Algorithm optimization, UAV image mosaic processing
1 Introduction
Image feature point extraction and matching is a very important technical link in image processing. Image matching, image stitching, 3D (three dimension) model-ing and other technical implementations rely on image feature point extraction and matching. After years of in-depth research and application practice, the algorithm for feature point extraction and description is constantly improving and perfecting. It has a wide range of applica-tions in image matching [1, 2], image retrieval [3, 4], image recognition [5–7], video data tracking [8], image stitching [9], image classification [10], and many other aspects.
The image feature point extraction and matching algo-rithm is roughly divided into two types: descriptor-based matching algorithm and feature learning-based matching algorithm. This paper mainly studies the descriptor-based matching algorithm. The SIFT (scale-invariant feature
transform) [11] algorithm proposed by Lowe et al. has be-come the benchmark of this kind of algorithm because of its superior performance and stable performance, but the poor timeliness is the main obstacle affecting the applica-tion of the algorithm. In view of the poor timeliness of the SIFT algorithm, Bay et al. proposed the SURF (speeded up robust features) [12] algorithm, which is three to seven times [12,13] more time efficient than the SIFT algorithm. The calculation timeliness of the ORB (object request bro-ker) algorithm proposed by Rublee et al. [14] in 2011 is 100 times that of SIFT and 10 times that of SURF. The BRISK (binary robust invariant scalable keypoints) algo-rithm proposed by Leutenegger et al. [15] in 2011 is a fea-ture extraction and binary description operator. It also has good rotation invariance, scale invariance, and robustness. Compared with SIFT, SURF, and other algorithms, the computational load is significantly reduced.
Of course, in order to pursue the timeliness of the al-gorithm, the accuracy of the algorithm is inevitably lost. Among them, BRISK and ORB are typical fast feature point detection and description algorithms, which have strong timeliness. The advantages of the two algorithms are strong robustness, good affine performance, and high Correspondence:[email protected]
1
School of Geodesy and Geomatics, Wuhan University, Luoyu Road No.129, Wuhan, China
2The First Topographic Surveying Brigade of NASG (National Administration of Surveying, Mapping and Geoinformation of China), Cehui Road No.4, Xi’an, China
timeliness. The disadvantages are that they do not have scale invariance and high error matching rate, which leads to some limitations of the algorithm.
Aiming at the problem that the feature point matching algorithm causes a high error matching rate in the scale invariance and the use of binary strings as feature descriptions, this paper aims to use BRISK and ORB algorithms as examples to study the im-proved algorithm and feature point extraction experi-ments based on BRISK, ORB algorithm feature point matching and the combination of the two advantages. The effects of different algorithm parameters and scale image sources on the accuracy of feature match-ing are obtained, and the optimal algorithm model parameters are proposed. Combined with Gaussian denoising, graying, and image sharpening enhance-ment, the algorithm is optimized to make the number of feature points and matching accuracy of the algo-rithm better.
2 Related algorithms
The BRISK algorithm and the ORB (Oriented FAST (features from accelerated segment test) and Rotated BRIEF (binary robust independent elementary features)) algorithm are fast feature extraction algorithms, and the computational load is significantly reduced compared with algorithms such as SIFT and SURF.
2.1 FAST feature point extraction algorithm
2.1.1 Principle of FAST algorithm
The FAST algorithm is a feature detection algorithm
proposed by Rosten and Drummond [16], which is an
improvement of the SUSAN (small univalue segment as-similating nucleus) corner extraction algorithm. It re-tains the SUSAN algorithm to detect the characteristics of various feature points [17, 18], and the algorithm has the advantages of fast detection speed and high accuracy of feature point detection. The algorithm is as follows:
As shown in Fig. 1, p is the center pixel, taking the neighborhood radius as 3 pixels, and the pixels on the circumference are numbered clockwise 1 to 16
(denoted as p1, p2, …, p16). If the brightness of N
consecutive pixels on the circumference is brighter than the center pixel brightness plus the threshold t, or darker than the center pixel brightness minus the
threshold t, the center p pixel is called a corner
point.
2.1.2 Progress in FAST algorithm research
In order to improve the detection speed, scholars have proposed to detect four points first. First compare the first and ninth pixels of Fig. 1 with the central pixel p. When the intensity is within the range of the threshold value t, it means that it is not a corner point, and then the fifth and third points are detected. If there are at least three points that are not similar to the center point, then the point can be judged as a corner point [19,20]. Finally, in order to improve the accuracy of the feature detection, all the 16 points of the determined corner point P are detected to accurately determine whether it is a corner point. Of course, this algorithm has the fol-lowing shortcomings: (1) If only 2 of the four detection points are not similar to the center point, it is not clear that this is not a corner point; (2) the order of the detec-tion points and the distribudetec-tion around the corners will seriously affect the detection efficiency, and it is difficult to clearly select the pixel position to be the best reaction corner performance; (3) the results of the previous four-point test failed to fully use the latter test; and (4) feature points that are connected together are likely to detect adjacent locations.
In order to solve these problems, scholars have proposed several classic improvements. For example, the first to third questions can be solved by machine
learn-ing and the fourth problem can be solved by
non-maximum suppression.
Fig. 1FAST feature detection pixel number and detection range
2.2 BRIEF description
2.2.1 BRIEF description sub-principle
The BRIEF description [21] operator describes the char-acteristics of these feature points in a certain way after detecting the corner points, which is called the descrip-tor of the feature points. Take the key point P as the center anddas the radius, and arbitrarily selectNpairs in the circle. TakeN= 4 point pairs as an example to de-fine an operation function as T, as shown in Eq. 2-1; then:
T P Að ð ;BÞÞ ¼ 1IA>IB 0IA≤IB
ð21Þ
In the formula, IA and IB represent the gray value of
the point.
In this way, the pair of points can be subjected to a T operation, and the obtained operation result of each point pair is composed into a final description operator, for example, any combination of 1101, 0011, etc., forms a binary description operator.
2.2.2 Brief description of the research progress
The ideal feature descriptor should be in the image of dif-ferent size, direction, brightness, and darkness, and has a
descriptor that is similar enough to be extracted, which is called reproducibility of the descriptor. That is to say, the descriptor is not sensitive to illumination (brightness), scale consistency (size), rotation consistency (angle), etc.; of course, this is only an ideal descriptor. The descriptors obtained by the BRIEF algorithm do not have these prop-erties. Therefore, we must find ways to improve the algo-rithm in practical applications.
In terms of rotation consistency, we generally use the centroid method to obtain the image and regard the gray value of the image as a board with uneven density. The gray value is the quality of the pixel, and then, the center of mass Q is obtained. The feature point P is taken as the center of the circle, and PQ is used as the coordinate axis. At different rotation angles, the points taken out by the same point-taking mode are identical, which over-comes the problem of rotation consistency.
2.3 Gaussian filtering algorithm
Mean filtering, median filtering, and Gaussian filtering [22] are commonly used filtering algorithms for image noise processing. Mean filtering can only completely at-tenuate noise and cannot completely eliminate noise [23]; the median filter is sensitive to salt and pepper
Fig. 2Implementation process of Gaussian filtering algorithm
noise and easily leads to image discontinuity [24, 25]. The Gaussian filtering algorithm smoothes the image while retaining the overall grayscale distribution of the image. The algorithm essentially convolves the (gray-scale) image I with a Gaussian kernel, as shown in Eq. 2-2below:
Iσ ¼IGσ ð22Þ
In the above formula,“*”represents a convolution
op-eration, and Gσ is a two-dimensional Gaussian kernel
with a standard deviation ofσ, as defined by Eq.2-3:
Gσ ¼ 1
2πσe
−ðx2þy2Þ=2σ2
ð23Þ
Convolution can be approximated as a weighted aver-age process of pixel values in the imaver-age filtering process, as shown in Fig.2.
2.4 RANSAC algorithm
RANSAC (random sample consensus) algorithm [26]
is mainly used to filter out mismatching pairs in fea-ture point detection. The idea of the algorithm is to use RANSAC algorithm to find a best homography
matrix H (Homography Matrix) [27] with a matrix
size of 3 × 3. The method of continuous iteration is used to find the optimal parameter model, and the points that do not conform to the optimal model are filtered out, so as to filter out the mismatched
points [28]. The algorithm is implemented as
follows:
Firstly, the transformation matrix is calculated using four sample data of random sampling and is recorded as model M;
Secondly, calculate the projection error of all the data in the data set and the model M. If the error threshold is less than the preset threshold, add the inner point set I; otherwise, filter out.
Again, if the current number of inner point set I ele-ments is greater than the optimal inner point set I_best, then update I_best=I and update the iteration numberk.
Finally, if the number of iterations is greater than k, then exit; otherwise, the number of iterations is incre-mented by 1, and the above steps are repeated.
k¼ log 1ð −pÞ
log 1ð −wmÞ ð24Þ
Fig. 4BRISK algorithm for the same-scale image feature detection
Table 1Statistical table of the results of the gradual change of the scale parameters between the images when the pyramid layer is 4
Pyramid image inter-scale parameter (n) Time (ms) Detection points Match points Accuracy (%)
1.0 328 541 200 37.0
1.1 343 529 218 41.2
1.2 327 515 241 46.8
1.3 328 513 255 49.7
1.4 328 512 257 50.2
1.5 327 512 277 54.1
1.6 343 505 280 55.4
1.7 312 520 271 52.1
1.8 312 504 272 54.0
1.9 312 497 272 54.7
2.0 296 475 259 54.5
In the formula, p is the confidence, w is the ratio of “inner point”, m is the number of samples, the confi-dence is usually taken as 0.995, and the sample is taken as the least.
3 Method
3.1 Algorithm optimization
On the one hand, the algorithm optimizes the optimal parameter combination of the optimal feature point ex-traction and matching of BRISK and ORB algorithms and proposes the optimal parameter combination ac-cording to different data source scale relationships. On the other hand, combined with BRISK, the ORB is opti-mized and improved, so that the feature point matching algorithm has the scale invariance of integrated BRISK and the robustness and fast computing power of the ORB algorithm.
3.2 Algorithm optimization step
In order to ensure the algorithm has better
optimization effect, Gaussian algorithm is firstly used to filter out noise and image enhancement, then gen-erate multi-scale space of image, and detect stable
ex-treme points in multi-scale space, so that the
extracted feature points have scale. Constant informa-tion. The feature points are then binary described using the BRIEF descriptor to generate binary de-scriptors with rotation invariance, scale invariance, and robustness. Finally, the RANSAC algorithm is used to filter out mismatched pairs and complete fea-ture point matching.
The algorithm implementation steps are as follows:
Step 1: Read in the image to be detected and perform feature point detection
Fig. 5Relationship between scale parameter variation and matching time between pyramid images
Construct a difference window, select the threshold t
and satisfy the Formula 2-5 to determine the feature
corner:
N¼ X
x∀ðcircleð ÞpÞ
jI xð Þ−I pð Þ j>t ð25Þ
In the formula,I(p) is the gray value of the center of the circle,I(x) is the gray value of any point on the circumfer-ence, andtis the feature detection threshold. It is gener-ally considered that three-quarters of the surrounding circle points are larger than a given thresholdt, and it is judged thatpis a feature point, and all points in the image satisfying the above condition are recorded as the feature point set Q. In order to solve the problems of uneven dis-tribution of characteristic corner points or dense corner points, non-maximum value suppression is used to en-hance its robustness. The specific method is to first calcu-late the Vvalue of the feature point and then determine thesvalue of multiple feature points in the neighborhood
centered on the feature pointp.Ifpis the largest response value among all feature points in the neighborhood, it is reserved; otherwise, it is suppressed. The formula for cal-culating theVvalue is as shown in Eq.2-6:
V¼ max Xðpixel values−pÞif valuejð −pÞj>t
ð26Þ In the formula,Vrepresents the score andtrepresents the threshold.
Step 2: Create an image pyramid
First, re-sample the original image to generate a lower resolution image file and saving it. In order to form an image pyramid, lower resolution image sampling is se-quentially performed until a predetermined layering is completed. Finally, the image of each layer is cut and saved into a slice file.
Fig. 7Comparison of the number of feature points detected and the number of exact matches when the scale parameters of the pyramid image change
Table 2Statistical results of experimental results with constant number of layers when the scale parameter between pyramid images is 1.6
Pyramid layer (i) Time (ms) Detection points Match points Accuracy (%)
1 218 498 276 55.4
2 281 506 283 55.9
3 312 505 280 55.4
4 405 504 280 55.6
5 344 504 280 55.6
6 328 504 280 55.6
7 328 504 280 55.6
8 327 504 280 55.6
9 296 504 280 55.6
Next, in the scale space of each sample, the FAST al-gorithm is used, and the threshold value is taken to per-form the FAST9-16 detection operator positioning and detection. In addition, in order to facilitate subsequent non-maximum suppression processing, a FAST5-8 cor-ner detection is performed on the original image as a layer, which can be used to compare image feature points of adjacent scale spaces.
Step 3: Calculate the centroid direction of the feature points
n order to satisfy the rotation invariance, it is ne-cessary to select the appropriate feature point main direction. QX¼M10
M00,QY ¼
M01
M00 (Q is the pixel value
centroid position) are calculated separately, and the feature point P is fixed as a center of the circle and rotates as the object rotates. When we use PQ as
the coordinate axis, the centroid direction θ of the
feature point can be obtained by the calculation for-mula. Therefore, it is possible to take a consistent point in the same point mode under different rota-tion angles, which solves the problem of rotarota-tion consistency.
Step 4: Calculate the feature point descriptor
The exhaustive algorithm is used to calculate n
random point pairs, and the random point pairs are rotated according to the centroid direction of the feature points in the “third step.” On the image pyra-mid layer corresponding to the feature points, the following formula is used to generate the binary descriptors:
τðp:x;yÞ ¼ 10 otherwisep xð Þ<pð Þy
Fig. 8Correspondence diagram between pyramid layer number and feature detection time
In the formula, (x,y) is a random point pair after rota-tion and p(x) and p(y) are the pixel values of random pointsx= (u1,v1) andy= (u2,v2) respectively.
Step 5: Feature point matching usingK-nearest neighbor algorithm
Generally,Kis 2 or 3. Calculate the Hamming distance from each feature point to all feature points to be matched. The two closest feature points to be matched are reserved, and the feature points form a matching point pair.
Step 6: Filter the feature point matching pairs and output the detected image
Matching the matching points in the previous step to the RANSAC algorithm with a threshold of 5 to filter out the mismatched points, find the optimal parameter matrix so that the number of data points satisfying the matrix is the largest, and use the itera-tive method to find the optimal parameter model. The point that does not conform to the optimal model is defined as “outer point” for filtering, so as to filter out the mismatched point.
4 Algorithm optimization experiment results
The computer configuration used in this experiment is Inter(R) Core (TM) i7-3632QM, and the memory is 8.00 GB, 64-bit operating system. The feature matching algorithm experiment was performed using openCV in conjunction with the Visual Studio 2010 development program. The dataset selects images of the same scale in the experimental region and images that are trans-formed to generate different scales or rotate different angles, and perform feature matching experiments. The original image and the reduced and rotated image are shown in Fig.3.
4.1 Same scale feature point extraction experiment
Comparative analysis of BRISK and ORB algorithm in the same scale rotating 90° image feature point extrac-tion and different scale scaling 50% and rotating 90° image feature point extraction time, feature point extrac-tion number, accuracy, etc.
4.1.1 Experiment 1: BRISK algorithm
BRISK algorithm in the case of scale parameters n (i= 1.1, 1.2, 1.3, ..., 2.0) between the layersi(i= 1, 2,…, 9) of different pyramids and pyramid images. The feature matching result uses the RANSAC algorithm with a
Fig. 10Feature point detection number and exact matching number comparison chart when the scale parameter between pyramid images changes
Fig. 11Effect of the ORB algorithm on the same-scale image feature detection
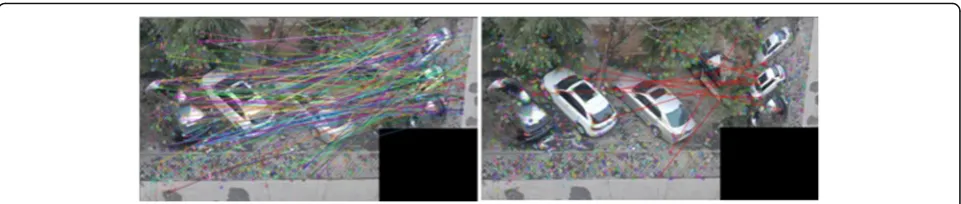
threshold of 5 to filter out the mismatched points and statistically characterize the experimental results. Experi-ments are carried out on the case where the image pyra-mid layer i is constant, the inter-image scale parameter nis gradually changed, the inter-image scale parameters are unchanged, and the pyramid layer number is grad-ually changed. The feature detection effect is shown in Fig.4.
The experiment and results are as follows:
(1) The first case: using the conclusions in the paper
“BRISK: Binary Robust Invariant Scalable
Keypoints”, when the pyramid layer is 4, the feature points are detected when the scale parameters between the pyramid images are gradually changed from 1.1 to 2.0. Then, the RANSAC algorithm with a threshold of 5 filters out the mismatched points, and the results of the detection time, the number of feature points, and the number of feature points before and after filtering the mismatched points are shown in Table1.
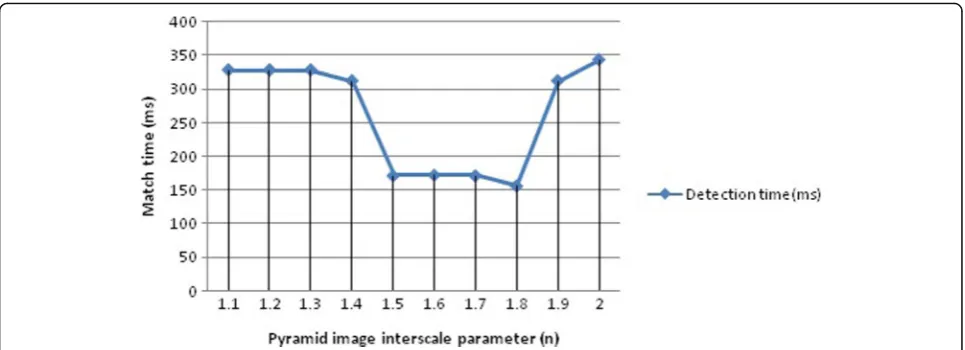
The relationship between the scale parameters be-tween the pyramid images from 1.1, 1.2, ..., 2.0 and the feature detection time is shown in Fig.5.
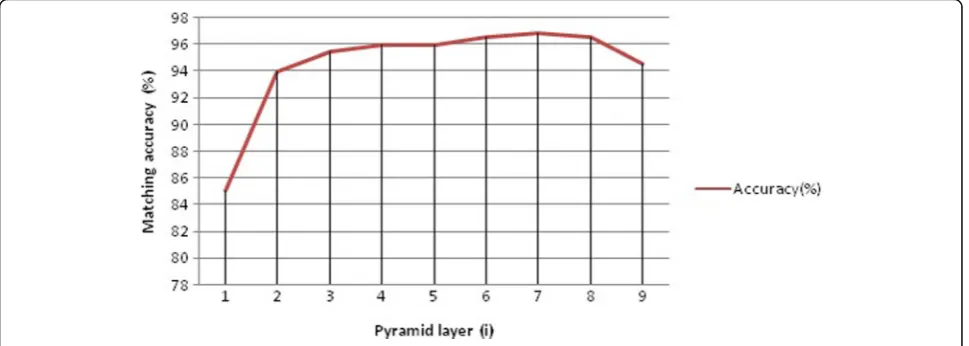
The relationship between the scale parameters of the pyramid image from 1.1, 1.2, ..., 2.0 and the accuracy of feature detection is shown in Fig.6.
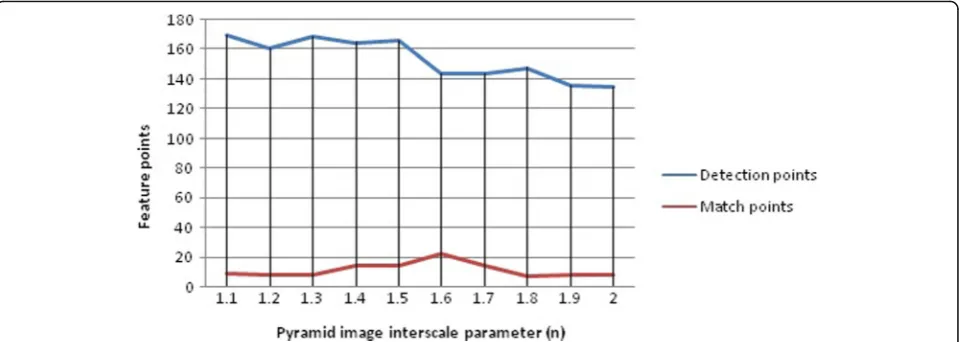
In the process of changing the scale parameters be-tween pyramid images from 1.1, 1.2, ..., 2.0, the corre-sponding relationship between feature point detection and exact matching points is shown in Fig.7.
Experimental summary:
1. As can be seen from Fig. 5, when the number of
pyramid layers of the same scale image is 4, the
scale parameter n between the pyramid images
changes from 1.1, 1.2, ..., 2.0. The time consumed by feature detection is generally decreasing, with a maximum of 343 ms and a minimum of 296 ms.
2. It can be seen from Fig.6that when the number of
pyramid layers of the same scale image is 4, during Table 3Statistics table of the results of the scale parameter of the image when the pyramid layer is 8
Pyramid image inter-scale parameter (n) Time (ms) Detection points Match points Accuracy (%)
1.1 234 348 336 96.6
1.2 203 368 350 95.1
1.3 156 383 340 88.8
1.4 141 347 297 85.6
1.5 140 330 288 87.3
1.6 125 321 284 88.5
1.7 109 328 291 88.7
1.8 109 314 272 86.6
1.9 156 321 290 90.3
2.0 94 320 278 86.9
the change of the scale parameternbetween the pyramid images from 1.1, 1.2, ..., 2.0, the accuracy of feature detection gradually increased, and it gradually stabilized from 37 to 54%.
3. It can be seen from Fig.7that when the number of
pyramid layers of the same scale image is 4, during the change of the scale parameter n between the pyramid images from 1.1, 1.2, ..., 2.0, the number of feature points detected is gradually decreasing, and the number of feature points that are accurately matched is gradually increasing.
(2) The second case: from the“first case”experiment results of “Experiment 1”, it is known that in the case of the same scale image, the feature matching accuracy is higher when the number of pyramid layers is 4 and the scale parameter between pyramid images is 1.6. Therefore, when the pyramid scale parameter is set to 1.6, the number of pyramid
layers i (i= 1, 2, ..., 9) is gradually changed from 1 to 9 for experiment. Finally, the RANSAC algorithm with a threshold of 5 is used to filter out the mismatched points. The experimental results are shown in Table2.
When the scale parameter between pyramid images is 1.6, the correspondence between the number of pyramid layersiand the detection time is shown in Fig.8.
When the scale parameter between pyramid images is 1.6, the relationship between the number of
pyra-mid layers i and the detection accuracy is shown in
Fig. 9.
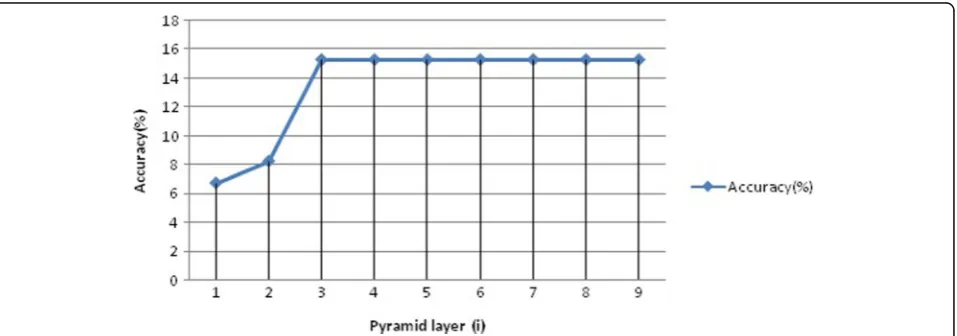
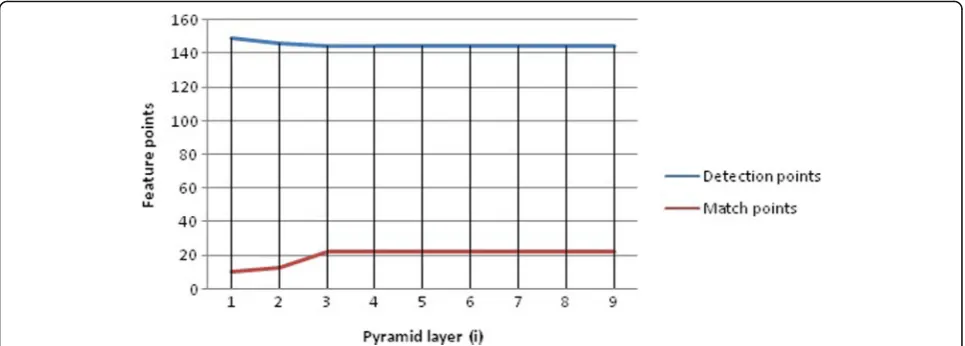
When the scale parameter between pyramid images is 1.6, the correspondence between the number of feature point detection points and the number of valid matching points in the process of pyramid change from 1 to 9 is shown in Fig.10.
Fig. 13Relationship between scale parameter variation and feature detection accuracy of pyramid images
Fig. 14Comparison of the number of feature points detected and the number of exact matches when the scale parameters of the pyramid image change
Experimental summary:
1. It can be seen from Fig.8that when the inter-scale image parameter of the pyramid image of the same scale image is 1.6, the consuming time of feature detection generally increases gradually during the gradual change of the number of pyramid layers from 1 to 9. However, when the number of pyramid layers is 7 to 9 layers, the consumption time has a tendency to fall.
2. As can be seen from Fig.9, when the scale parameter of the pyramid image of the same scale image is 1.6, the accuracy of the overall feature detection of the BRISK algorithm is stable at about 55% during the change of the pyramid layer from 1 to 9. The fluctuation of the layer number is 1 to 4. 3. As can be seen from Fig.10, when the scale
parameter of the pyramid image of the same scale image is 1.6, during the change of the number of pyramid layers from 1 to 9, the number of feature points detected and the number of feature points that match exactly do not change.
From the experimental statistics of the above two cases, the following conclusions can be drawn:
When the pyramid layer is 4 in the BRISK algo-rithm, the matching accuracy of the pyramid image between the same scale image is 1.6, which is about 54%. The change of the number of pyramid layers slightly increases the feature detection time and has no significant influence on the number of features de-tected and the matching accuracy. It shows that the BRISK algorithm pyramid layer change has little effect on the feature point detection number and matching accuracy.
4.1.2 Experiment 2: ORB algorithm
ORB algorithm performs feature matching in the case of different pyramid layer numbers i (i= 1, 2, ..., 9) and pyramid image inter-scale parameter n (n= 1.1, 1.2, ..., 2.0). And use the RANSAC algorithm with a threshold of 5 to filter out the mismatch points. The experiment was carried out in the same way as in “Section 4.1.1”, and the feature point detection results were counted. Table 4Statistical results of experimental results when the scale parameter of the pyramid image is 1.1
Pyramid layer (i) Time (ms) Detection points Match points Accuracy (%)
1 109 341 290 85.0
2 109 349 328 94.0
3 203 348 332 95.4
4 172 348 334 96.0
5 265 348 334 96.0
6 219 352 340 96.6
7 281 348 337 96.8
8 234 348 336 96.6
9 234 351 332 94.6
(1) The first case: the conclusion of the paper in the paper“ORB: an efficient alternative to SIFT or SURF”, the number of pyramid layers is 8 and the feature points are detected when the scale parameter of the pyramid image changes gradually from 1.1 to 2.0. The RANSAC algorithm with a threshold of 5 filters out the mismatch points. The experimental results are shown in Fig.11.
Table3shows the results of detection time, number of feature points, and number of feature points before and after filtering the mismatched points in the ORB algo-rithm feature detection.
The relationship between the scale parameter of the pyramid image from 1.1, 1.2, ..., 2.0 and the time con-sumption of feature detection is shown in Fig.12.
The relationship between the gradual change of the scale parameter of the pyramid image between 1.1, 1.2,
..., 2.0 and the accuracy of feature detection matching is shown in Fig.13.
When the scale parameter between pyramid images changes between 1.1, 1.2, ..., 2.0, the correspondence be-tween feature point detection and exact matching points is shown in Fig.14.
Experimental summary:
1. It can be seen from Fig.12that when the number
of pyramid layers of the same scale image is 8, the
scale parameternbetween the pyramid images
changes from 1.1, 1.2, ..., 2.0. The ORB algorithm feature detection consumption time is gradually decreasing, which takes up to 234 ms and the minimum time is 94 ms.
2. It can be seen from Fig.13that when the number
of pyramid layers of the same scale image is 8,
when the scale parameternbetween the pyramid
Fig. 16Diagram of pyramid layer change and matching accuracy
Fig. 17Comparison of the number of feature points detected and the number of exact matches when the number of pyramid layers changes gradually
images changes from 1.1, 1.2, ..., 2.0, the accuracy of feature detection of ORB algorithm is gradually decreasing, decreasing from 96 to 87%. During the change of scale parameters between pyramid images from 1.4 to 2.0, the matching accuracy fluctuates greatly and fluctuates around 87%.
3. It can be seen from Fig. 14 that when the
number of pyramid layers of the same scale
image is 8, the scale parameter n between the
pyramid images changes from 1.1, 1.2, ..., 2.0. The number of feature points and the number of exact matches are gradually decreasing, and the trend is reduced.
(2) The second case: from the results of the“first case” experiment of “Experiment 2”, when the number of pyramid layers in the same scale image is 8 and the scale parameter between the pyramid images is 1.1, the ORB algorithm has a high feature matching accuracy, but this method is time consuming. Because this paper mainly studies the optimization method to improve the accuracy of feature detection, the feature detection experiment with different scales of different gold characters is selected with the scale parameter of 1.1. Finally, the mismatching point is filtered by the
RANSAC algorithm with a threshold of 5. The
experimental results are statistically as follows (Table 4).
When the scale parameter between pyramid images is 1.1, the relationship between the number of
pyra-mid layers i from 1 to 9 and the detection time is
shown in Fig. 15.
When the scale parameter between pyramid images is 1.1, the relationship between the number of pyramid layers changing from 1 to 9 and the detection accuracy is shown in Fig.16.
When the number of pyramid layers changes from 1 to 9, the correspondence between the number of feature point detection points and the exact matching points is shown in Fig.17.
Experimental summary:
1. As can be seen from Fig.15, when the scale parameter between pyramid images of the same scale image is 1.1, during the change of the pyramid layer number i from 1 to 9, the ORB algorithm feature detection consumption time gradually increases, with the longest time of 281 ms and the minimum time of 109 ms.
2. As can be seen from Fig. 16, when the scale
parameter between the pyramid images of the
Fig. 18Results of BRISK algorithm in image detection of different scales
Table 5Statistics table of the results of the constant change of the inter-image scale parameters when the pyramid layer is 4
Scale parameter between pyramid images (n) Time (ms) Detection points Match points Accuracy (%)
1.1 328 170 9 5.3
1.2 328 161 8 5.0
1.3 328 169 8 4.7
1.4 312 165 14 8.5
1.5 171 166 14 8.4
1.6 172 144 22 15.3
1.7 171 144 14 9.7
1.8 156 148 7 4.7
1.9 312 136 8 5.9
same scale image is 1.1, the accuracy of the feature detection of the ORB algorithm gradually increases during the change of the number of pyramid layers i from 1 to 9, with a minimum of 85% and a maximum close to 97%.
3. As can be seen from Fig. 17, when the scale
parameter between the pyramid images of the same scale image is 1.1, the number of feature points and the number of exact matches are relatively stable during the change of the number of pyramid layers i from 1 to 9, which is basically a horizontal trend.
From the statistics of the experimental results of the above two cases, the following conclusions can be drawn:
When the pyramid layer is 8, when the scale par-ameter between the image pyramid images of the same scale is 1.1, the matching accuracy of the ORB algorithm is relatively high, about 97%. However, this
is the most time consuming, and the number of de-tection points and the number of exact matches are weakly related to the change in the number of pyra-mid layers.
4.2 Feature point extraction experiment of different scale images
4.2.1 Experiment 3: BRISK algorithm
For the feature matching result of BRISK algorithm in the case of different pyramid layer number i (i= 1, 2,
..., 9) and different pyramid image size parameter n
(n= 1.1, 1.2, 1.3, ..., 2.0), the RANSAC algorithm with threshold value of 5 is used to filter out the mis-matching point. The experiment is also carried out
according to the “Section 4.1” chapter in two cases.
The effect of feature detection and filtering mismatch is shown in Fig. 18.
The experimental development and results are as follows:
Fig. 19Time-dependent relationship between scale parameter variation and matching between pyramid images
Fig. 20Relationship between scale parameter variation and matching accuracy of pyramid images
(1) The first case: consistent with the idea in the
“Section4.1.1”, select the pyramid layer to be 4 and perform feature point detection under the scale parametern(n= 1.1, 1.2, ..., 2.0) between the pyramid images, and use the RANSAC algorithm with a threshold of 5 to filter out the mismatched points. Table5shows the results of detection time, number of feature points, and number of feature points before and after filtering of mismatched points during feature detection:
When the number of pyramid layers is 4, the relation-ship between the scale parameters between the pyramid images from 1.0, 1.1, ..., 2.0 and the feature detection time is shown in Fig.19.
When the number of pyramid layers is 4, the relation-ship between the scale parameters between the pyramid images from 1.0, 1.1, ..., 2.0 and the accuracy of feature detection is shown in Fig.20.
When the number of pyramid layers is 4, the relation-ship between the number of feature point detection points and the exact matching points is shown in Fig.21.
Experimental summary:
1. As can be seen from Fig.19, images of different scales (50% difference between the left and right image scales). The pyramid layer is 4 and the scale parameter of the pyramid image changes from 1.1 to 2.0. When the scale parameter is between 1.5 and 1.8, it takes less time, and the maximum time is 343 ms and the minimum time is 156 ms.
2. As can be seen from Fig.20, images with different scales (the difference between the left image and the right image scale is 50%) and the pyramid layer is 4, during the change of the scale parameter between the pyramid images from 1.1 to 2.0, except that the scale parameter between the pyramid images is 1.6, the detection accuracy is 16%, and
Fig. 21Comparison of the number of feature points detected and the number of exact matches when the scale parameters of the pyramid image change
Table 6Statistical results of the experimental results of the ever-changing pyramid layer when the scale parameter between pyramid images is 1.6
Pyramid layer (i) Time (ms) Detection points Match points Accuracy (%)
1 266 149 10 6.7
2 202 146 12 8.2
3 172 144 22 15.3
4 172 144 22 15.3
5 171 144 22 15.3
6 312 144 22 15.3
7 219 144 22 15.3
8 234 144 22 15.3
the detection accuracy of other parameters is less than 10%.
3. As can be seen from Fig.21, the images of different scales (the difference between the left image and the right image scale are 50%) and the pyramid layer is 4, during the change of the scale parameter between the pyramid images from 1.1 to 2.0, the number of feature points is very different from the number of exact matches. The algorithm has obvious defects and there is much room for improvement.
(2) The second case: from“Experiment 1 of Section 4.2.1”, when the scale parameter between pyramid images is 1.6, the matching accuracy is relatively high. Therefore, the pyramid scale parameter is 1.6, and the number of layersi(i= 1, 2, ..., 9) of the pyramid is gradually changed for experiment. Finally, the mismatch point is filtered by the
RANSAC algorithm with a threshold of 5. The experimental results are statistically as follows (Table6).
When the scale parameter between the pyramid im-ages is 1.6, the relationship between the pyramid layer
number i and the feature detection time is shown in
Fig.22.
The scale parameter between the pyramid images is 1.6, and the relationship between the pyramid layer
number i and the detection accuracy when changing
from 1 to 9 is shown in Fig.23.
In the process of changing the scale parameter be-tween pyramid images from 1 to 9, the correspondence between the number of points detected by the feature points and the number of exact matching points is shown in Fig.24.
Experimental summary:
Fig. 22Pyramid layer change and matching time relationship diagram
Fig. 23Diagram of the change of the number of layers of the pyramid and the matching accuracy
1. As can be seen from Fig.22, in the process of the pyramid layer changing from 1 to 9, when the scale between the different scales (the left image and the right image scale is 50%) and the scale parameter between the pyramid images is 1.6, the feature point detection takes time and fluctuates greatly. The maximum time is 312 ms and the minimum time is 172 ms.
2. As can be seen from Fig.23, when the scale parameter between the pyramid scales is 1.6 and the scale parameter between the pyramid images is 1.6, the detection accuracy is stable at around 16%. When the pyramid layer is 1 to 3, the feature detection accuracy increases significantly with the increase of the number of layers.
3. As can be seen from Fig. 24, when the pyramid
layer changes from 1 to 9, the image with different scales (the difference between the left image and the right image scale is 50%) and the scale parameter between the pyramid images is 1.6, the contrast between the number of feature points and the exact number of
matches is very large. The algorithm has the drawback of insufficient detection accuracy.
From the statistics of the experimental results of the above two cases, the following conclusions can be drawn:
In the process of changing the scale parameter of the pyramid image from 1.1 to 2.0, when the pyra-mid layer is 4, the image of different scales (the dif-ference between the left image and the right image scale is 50%), the average matching accuracy of the BRISK algorithm is less than 10%. The matching ac-curacy is only 16% when the scale parameter be-tween the pyramid images is 1.6; when the pyramid layer changes from 1 to 9, when the scale parameter between the pyramid images is 1.6, the average matching accuracy is lower than 16%. In the process of increasing the pyramid layer from 1 to 3, the matching accuracy increases to about 15%, and be-tween 4 and 9 layers, the matching accuracy tends to be stable.
Fig. 24Comparison of the number of feature points detected and the number of exact matches when the number of pyramid layers changes
4.2.2 Experiment 4: ORB algorithm
Testing the feature matching results of the ORB algo-rithm in the case of the number of layersi(i= 1, 2, ..., 9) of different pyramids and the scale parametern (n= 1.1, 1.2, ..., 2.0) between different pyramid images, the RAN-SAC algorithm with a threshold of 5 is selected to filter out the mismatched points, and the experimental results of the feature points are statistically analyzed. The ex-perimental results are shown in Fig.25.
The experimental development and results are as follows:
(1) The first case: when the pyramid layer is 8, the scale parameter of the pyramid image gradually changes from 1.1 to 2.0 for feature point detection. The results of the detection time, the number of feature points, and the number of feature points before and after filtering the mismatched points are shown in Table7.
When the number of pyramid layers is 8, the relation-ship between the scale parameters of the pyramid image
from 1.1, 1.2, ..., 2.0 and the feature detection time is shown in Fig.26.
When the number of pyramid layers is 8, the relation-ship between the scale parameters of the pyramid images from 1.1, 1.2, ..., 2.0 and the matching accuracy of the feature points is shown in Fig.27.
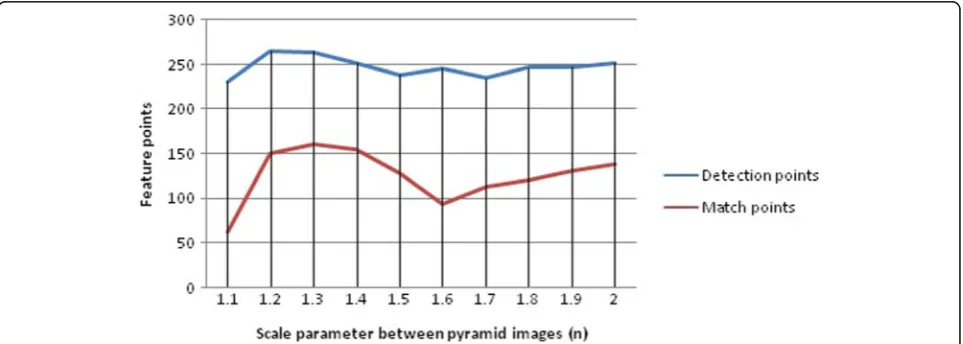
When the number of pyramid layers is 8, when the scale parameter of the pyramid image changes from 1.1 to 2.0, the correspondence between the number of fea-ture point detection points and the exact matching points is shown in Fig.28.
Experimental summary:
1. As can be seen from Fig. 26, the image of
different scales (the difference between the left image and the right image scale is 50%) and the pyramid layer is 8. When the scale
parameter between the pyramid images changes from 1.1 to 2.0, the time consumption of the algorithm gradually decreases. The maximum time is 219 ms and the minimum time is 78 ms.
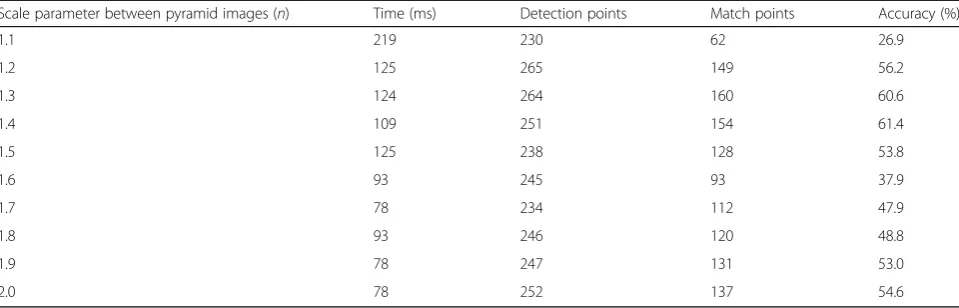
Table 7Statistics table of the results of the constant change of the inter-image scale parameters when the pyramid layer is 8
Scale parameter between pyramid images (n) Time (ms) Detection points Match points Accuracy (%)
1.1 219 230 62 26.9
1.2 125 265 149 56.2
1.3 124 264 160 60.6
1.4 109 251 154 61.4
1.5 125 238 128 53.8
1.6 93 245 93 37.9
1.7 78 234 112 47.9
1.8 93 246 120 48.8
1.9 78 247 131 53.0
2.0 78 252 137 54.6
Fig. 26Relationship between scale parameter variation and matching time between pyramid images
2. As can be seen from Fig.27, for the images of different scales (the difference between the left image and the right image scale are 50%) and the pyramid layer is 8. When the scale parameter between the pyramid images is 1.2–1.5 and 1.9, 2.0, the feature detection accuracy exceeds 50%. 3. As can be seen from Fig.28, for the images of
different scales (the difference between the left image and the right image scale are 50%) and the pyramid layer is 8. When the scale parameter between the pyramid images changes from 1.1 to 2.0, the number of feature points and the number of exact matches are larger. The number of detected feature points is proportional to the number of accurately matching feature points.
(2) The second case: from the experimental results of the previous case, the accuracy rate is higher when the scale parameter of the pyramid image is 1.4, but this method is time consuming. Since this paper
mainly studies the optimization method to improve the accuracy of feature detection, the feature detection experiment of different pyramid layer numbersi(i= 1, 2, ..., 9) is selected by selecting the scale parameter between pyramid images as 1.4. Finally, the mismatch point is filtered out by the RANSAC algorithm with a threshold of 5. The experimental results are shown in Table8.
When the scale parameter between pyramid images is 1.4, the relationship between the number of pyramid layers and the detection time is shown in Fig.29.
When the scale parameter between the pyramid im-ages is 1.4, the relationship between the continuous change of the pyramid layer and the detection accuracy is shown in Fig.30.
When the scale parameter between the pyramid im-ages is 1.4, the relationship between the number of fea-ture point detection points and the exact matching
Fig. 27Relationship between scale parameter variation and matching accuracy rate of pyramid image
points is shown in Fig.31during the change of the num-ber of pyramid layers from 1 to 9.
Experimental summary:
1. As can be seen from Fig. 29, for images with
different scales (the difference between the left image and the right image scale is 50%), the scale parameter between pyramid images is 1.4, and the algorithm takes a little time to increase the number of pyramid layers from 1 to 9. When the number of pyramid layers is 4 or 5, the algorithm takes a relatively long time.
2. As can be seen from Fig. 30, for images with
different scales (the difference between the left image and the right image scale is 50%), when the scale parameter between pyramid images is 1.4, the accuracy of the matching with the number of pyramid layers is higher and higher and finally approaches 60%.
3. As can be seen from Fig.31, the image size of the pyramid image is 1.4, and the number of feature points is slightly reduced when the number of
pyramid layers increases. However, the number of exact matches has increased significantly.
From the statistics of the above two cases, the follow-ing conclusions can be drawn:
(3) The ORB algorithm extracts and matches the image of different scales (the difference between the left image and the right image is 50%). When the scale parameter between the pyramid images is 1.6, the matching accuracy is generally low when the pyramid layer increases from 1 to 9. But better than the BRISK algorithm, the average matching
accuracy is close to 50%. When the scale parameter between pyramid images is 1.4, the number of pyramid layers changes from 1 to 9. As the number of pyramid layers increases, the matching accuracy increases significantly, with a maximum of 60%.
4.3 ORB algorithm optimization experiment
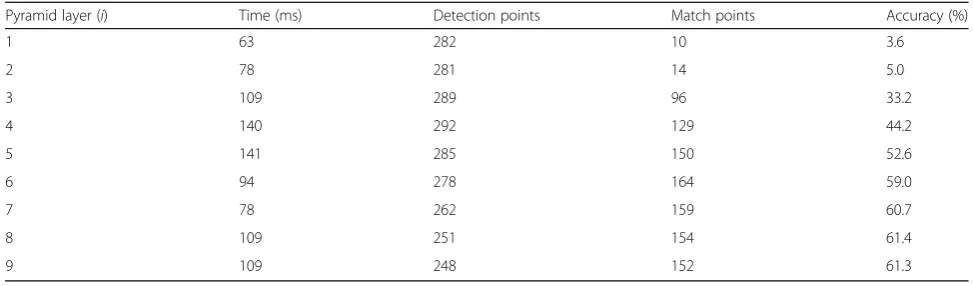
After the algorithm is optimized, the image matching ex-periments of the same scale and different scales are Table 8Statistical results of experimental results of pyramid layer transformation when the scale parameter between pyramid images is 1.4
Pyramid layer (i) Time (ms) Detection points Match points Accuracy (%)
1 63 282 10 3.6
2 78 281 14 5.0
3 109 289 96 33.2
4 140 292 129 44.2
5 141 285 150 52.6
6 94 278 164 59.0
7 78 262 159 60.7
8 109 251 154 61.4
9 109 248 152 61.3
Fig. 29Pyramid layer change and matching time relationship diagram
carried out, and compared with the previous experimen-tal results.
(1) Image matching experiment at the same scale
When the scale parameter between the pyramid images is 1.1 and the number of pyramid layers is 8, the Gaussian denoising process is performed after reading the image, and then the grayscale is performed. The experimental re-sults after Gaussian filtering are shown in Fig.32. The ex-perimental results after grayscale are shown in Fig.33.
The experimental results before and after the feature detection and filtering mismatch are shown in Fig.34.
(2) Image matching experiment at different scales
The right image is reduced by 50% at different
scales, and the algorithm is experimented by
taking the scale parameter between the pyramid image as 1.4 and the number of pyramid layers as
8. And summarize the relevant experimental
results.
(3) The experimental results before and after the algorithm optimization are shown in Table9.
It can be seen from Table 9 that after Gaussian
denoising and grayscale optimization, the number of feature points and the accuracy of feature points detected by the ORB algorithm are improved, indi-cating that the algorithm optimization has a certain effect. Of course, part of the time is lost as a cost. If you want to pursue fast processing, you do not need to perform denoising and graying. If you are
pursuing precision, you can perform related
optimization.
Fig. 30Relationship between pyramid layer number change and matching accuracy
5 Discussion and experiments
5.1 Experimental analysis of feature points extraction on the same scale
(1) Experimental analysis of BRISK algorithm
In the case of feature point matching on the same scale image, when the number of pyramid layers is un-changed (i= 4) and the scale parameters between pyra-mid images are gradually increasing, the following conclusions are drawn: first, the algorithm consumes a slight decrease in time consumption; and second, the ac-curacy of feature detection is gradually increasing and it tends to be stable from 37 to 54%. The best matching accuracy is achieved when the scale parameter between pyramid images is 1.6. Third, the number of feature points detected is gradually decreasing, and the number of feature points that are accurately matched is gradually increasing.
When the scale parameter between pyramid images is n= 1.6, there are several characteristics in the process of gradually increasing the number of pyramid layers: first,
the consumption time of feature detection is gradually increasing. Second, the accuracy of feature detection is stable at around 55%. Third, there is basically no change in the number of feature point detections and the number of feature points that are accurately matched.
(2) Experimental analysis of ORB algorithm
When the number of pyramid layers of the same scale image is 8, the variation of the scale parameter n be-tween the pyramid images from 1.1, 1.2, ..., 2.0 has the following characteristics: first, the feature detection con-sumption time is gradually decreasing, which takes up to 234 ms and the minimum time is 94 ms; and second, the accuracy of feature detection is gradually decreasing, from 96 to 87%. During the change of the inter-scale image parameters of pyramid images from 1.4 to 2.0, the matching accuracy fluctuates greatly and fluctuates around 87%. Third, the number of feature points and the number of exact matches are gradually decreasing, and the trend is reduced.
Fig. 32Gaussian filtered image
Fig. 33Grayscale image
When the scale parameter of the pyramid image of the same scale image is 1.1, the variation of the number of pyramid layersifrom 1 to 9 has the following character-istics: first, the feature detection consumption time is gradually increasing, the longest time is 281 ms, and the minimum time is 109 ms; second, the accuracy of fea-ture detection is gradually increasing, with a minimum of 85% and a maximum of close to 97%; and third, the number of feature points and the number of exact matches are relatively stable, basically forming a hori-zontal trend.
5.2 Experimental analysis of feature points extraction from different scale images
(1) Experimental analysis of BRISK algorithm
When the pyramid layer of the image is 4 at different scales (the difference between the left image and the right image scale is 50%), the variation of the scale par-ameter between the pyramid images from 1.1 to 2.0 has the following characteristics: first, the scale parameter takes the least time between 1.5 and 1.8, and the max-imum time is 343 ms and the minmax-imum time is 156 ms. Second, the accuracy of feature detection is very low. Ex-cept that the scale parameter between pyramid images is 16%, the detection accuracy of other parameters is less than 10%. Third, the number of feature points and the
number of exact matches are very large. The algorithm has obvious defects, and there is much room for improvement.
When the scale parameter between the pyramid im-ages is 1.6, the different scales (the left image and the right image scale differ by 50%) have the following char-acteristics in the change of the image pyramid layer from 1 to 9: first, the feature point detection takes time and fluctuates greatly, with a maximum time of 312 ms and a minimum time of 172 ms; second, when the pyramid layer is greater than or equal to 4, the feature detection accuracy rate is always stable at about 16%, and the fea-ture detection accuracy of the pyramid layer is 1 to 3 layers is significantly increased with the increase of the number of layers; and third, the number of feature points and the exact number of matches are very large, and the algorithm has the defects of insufficient detec-tion accuracy.
(2) Experimental analysis of ORB algorithm
The pyramid layer of different scale images (the differ-ence between the left image and the right image scale is 50%) is 8, and the scale parameter between the pyramid images varies from 1.1 to 2.0. First, the time-consuming of the algorithm is gradually decreasing. The maximum time is 219 ms, and the minimum time is 78 ms. Second, when the scale parameter between pyramid images is
Fig. 34Comparison of the effects before and after filtering the mismatch
Table 9Statistical results of experimental results before and after algorithm optimization
Project Feature points Number of matches Accuracy (%) Time (ms)
Before optimization
Same scale 348 336 96.6 234
Different scale 251 154 61.4 109
After optimization
Gaussian denoising, grayscale 363 353 97.3 296
Gaussian denoising 354 346 97.7 265
Gaussian denoising, grayscale 264 164 62.1 156
1.2–1.5 and 1.9, 2.0, the accuracy of feature detection exceeds 50%. Third, the number of feature points and the number of exact matches are large, and the number of detected feature points is proportional to the number of accurately matched feature points.
The scale parameter between the pyramid images is 1.4, and the number of pyramid layers changes from 1 to 9 as follows: First, the overall time consumption of the algorithm increases slightly. When the number of pyra-mid layers is 4 or 5, the algorithm takes a relatively long time. Second, as the number of pyramid layers increases, the matching accuracy becomes higher and higher, even-tually approaching 60%. Third, the number of feature points has a slight decrease, but the number of accurate matches has increased significantly.
5.3 ORB algorithm optimization experiment analysis
After the algorithm is optimized, the image matching ex-periment of the same scale and different scales is carried out. It can be seen from Table9that after the ORB algo-rithm performs Gaussian denoising and grayscale optimization, the number of detected feature points and
the accuracy of feature points are improved, indicating that the algorithm optimization has a certain effect. Of course, part of the time is lost. If you want to pursue fast processing, you do not need to perform denoising and graying. If you are looking for precision, you can per-form related optimization.
6 Optimization algorithm application
In order to verify the stitching effect of the ORB optimization algorithm, two adjacent drone images were selected for splicing experiments, and the experimental results were analyzed. The original dataset is shown in Fig.35.
6.1 Image stitching process
Image stitching mainly includes image preprocessing, image registration, image synthesis, and other major links. The main steps of the splicing experiment are:
(1) Perform basic operation experiments such as enhancement transformation and smoothing on the
Fig. 35Original image
Fig. 36Feature detection and feature point screening results
original image to prepare for the next image mosaic.
(2) Image registration is the core of image stitching, and the accuracy of registration directly determines the stitching quality of images. Perform feature point detection and screen out accurate feature points. Accurately find the location of the feature points between the two images and establish an accurate conversion relationship model. (3) After determining the conversion relationship
model between the two images, the image to be stitched is mosaicked into a visually visible image according to the information of the overlapping area.
In the image feature point selection process, image Gaussian filtering is first performed and grayscaled. The feature point detection uses the RANSAC algorithm with a threshold of 5 to filter the mis-match points, ensuring the accuracy of the feature points used to establish the mathematical model.
The image fusion process uses a weighted smoothing algorithm to perform a fast and simple weighted smoothing algorithm to complete the stitching of the final image.
6.2 ORB image mosaic implementation
The experimental dataset is an aerial photography image of a certain area of the UAV. The left and right image aerial scales are basically the same, the image size is 612*408, and the right image is slightly rotated.
(1) Firstly, the image to be stitched is read, and the RANSAC algorithm with a threshold of 5 is used to complete feature point matching and accurate matching point screening. The experimental results are shown in Fig.36.
(2) Calculate the transformation matrix and complete the right image perspective matrix transformation. The transformation result is shown in Fig.37. (3) Create the stitched image range and complete the
image stitching. The result is shown in Fig.38.
Fig. 37Result graph of the right image after perspective transformation
(4) There is a clear stitching seam after the image is stitched, which is due to the color difference between the two images. Therefore, smoothing processing is required, and the processing of the stitching seam is quickly completed by the weighted smoothing algorithm. The result of the image stitching seam processing is shown in Fig. 39.
7 Conclusions
In this paper, the feature point matching based on BRISK and ORB algorithm and the algorithm improve-ment and feature point extraction experiimprove-ment based on the combination of the two advantages are carried out. The main conclusions obtained through experiments are as follows:
(1) When the pyramid layer is 4 in the BRISK algorithm, the matching accuracy of the pyramid image between the data sources is high. In the case where the pyramid layer is 8 in the ORB algorithm, the matching accuracy of the pyramid image between the data sources is high. Therefore, the scale relationship between image sources has a direct impact on the accuracy of feature matching. It is recommended to prioritize the algorithm parameters before feature point extraction and matching.
(2) Combined with the characteristics of BRISK and ORB, the algorithm is optimized and improved, which makes the algorithm have both excellent illumination robustness and fast computing power, and BRISK scale invariance. Under the condition of optimal algorithm parameters, the number of feature points can be increased by 3%, and the effective matching point can be improved by nearly 2%.
(3) In this paper, the algorithm application experiment is carried out for the UAV image, and the feature extraction matching and image splicing work of the UAV image is completed. From the visual effect, the effect is good, and the optimization algorithm can be applied to the inorganic image processing application.
Abbreviations
3D:Three dimension; BRIEF: Binary robust independent elementary features; BRISK: Binary robust invariant scalable keypoints; FAST: Features from accelerated segment test; ORB: Object request broker; RANSAC: Random sample consensus; SIFT: Scale-invariant feature transform; SUSAN: Small univalue segment assimilating nucleus; UAV: Unmanned aerial vehicle
Availability of data and materials
We can provide the data.
Author’s contribution
Wu did all the work. The author read and approved the final manuscript.
Author’s information
Manyi Wu was born in 1983 and a Doctoral graduate student of Wuhan University, mainly concerned with UAV image processing and image feature extraction.
Ethics approval and consent to participate
Not applicable.
Consent for publication
Not applicable.
Competing interests
The author declare that he has no competing interests.
Publisher’s Note
Springer Nature remains neutral with regard to jurisdictional claims in published maps and institutional affiliations.
Received: 29 July 2018 Accepted: 4 October 2018
References
1. F. Schaffalitzky, A. Zisserman,Multi-view Matching for Unordered Image Sets. In Proc. ECCV. (2002), pp. 414–431.
2. T. Tuytelaars, L. Van Gool, Matching widely separated views based on affine invariant regions. Int J Comput Vis1(59), 61–85 (2004).
Fig. 39Image after processing the stitching seam
3. K. Mikolajczyk, C. Schmid,Indexing Based on Scale Invariant Interest Points. Vol. 1. IEEE International Conference on Computer Vision, (2002), pp. 525–531. 4. C. Schmid, R. Mohr, Local Grayvalue invariants for image retrieval. IEEE Trans.
Pattern Anal Machine Int19(5), 530–534 (May 1997).
5. V. Ferrari, T. Tuytelaars, L. Van Gool,Simultaneous Object Recognition and Segmentation by Image Exploration, In Proc. Eighth European Conf. Computer Vision. (2004), pp. 40–54.
6. D. Lowe, Distinctive image features from scale-invariant Keypoints. Int’l J. Comp Vis2(60), 91–110 (2004).
7. S. Lazebnik, C. Schmid, J. Ponce,Sparse Texture Representation Using Affine-Invariant Neighborhoods. In Proc. Computer Vision and Pattern Recognition. (2003), pp. 319–324.
8. J. Sivic, A. Zisserman,Video Google: a Text Retrieval Approach to object Matching in Videos. In Proc. Ninth Int’l Conf. Computer Vision. (2003), pp. 1470–1478. 9. M. Brown, D. Lowe,Recognising Panoramas(Proc. Ninth Int’l Conf. Computer
Vision, 2003), pp. 1218–1227.
10. R. Fergus, P. Perona, A. Zisserman,Object Class Recognition by Unsupervised Scale-Invariant Learning. In Proc. Conf. Computer Vision and Pattern Recognition. (2003), pp. 264–271.
11. D. Lowe, Distinctive image features from scale-invariant keypoints. Int’l Journal of Computer Vision60(2), 91–110 (2004).
12. H. Bay, T. Tuytelaars, L.V. Gool,SURF: Speed Up Robust Features. Proc. of the European Conf. on Computer Vision. (2006), pp. 404–417.
13. H. Bay, A. Ess, T. Tuytelaars, L.V. Gool, Speeded-up robust features (SURF). Comput. Vis. Image Underst.110(3), 346–359 (2008).
14. E. Rublee, V. Rabaud, K. Konolige, et al.,ORB: An Efficient Alternative to SIFT or SURF[C](International Conference on Computer Vision, 2011), pp. 2564–2571. 15. S. Leutenegger, M. Chli, R.Y. Siegwart,BRISK: Binary Robust Invariant Scalable
Keypoints[C]. International Conference on Computer Vision(IEEE, 2011), pp. 2548–2555.
16. E. ROSTEN, T. DRUMMOND,Fusing Points and Lines for High Performance Tracking[C], vol 2 (Tenth IEEE International Conference on Computer Vision. IEEE, 2005), pp. 1508–1515.
17. S.U.N. Bo,Research on the Corner Detection Algorithm of Digital Images[D]
(Hefei University of Technology, 2013).
18. L.I.A.N.G. Yan-ju, Q. Li, C.H.E.N. Da-peng, Y.A.N. Xue-jin, Fast and Robust LOG-FAST Corner Algorithm[J]. Computer Science39(6), 251–254 (2012). 19. E. Rosten, R. Porter, T. Drummond, Faster and better: a machine learning
approach to corner detection[J]. IEEE Trans. Pattern Anal. Mach. Intell.32(1), 105–119 (2010).
20. E. Rosten, T. Drummond,Machine Learning for High Speed Corner Detection[C]//9th European Conference on Computer Vision(Springer, ACM, Berlin, Heidelberg, 2006), pp. 430–443.
21. M. Calonder, V. Lepetit, P. Fua,BRIEF: Binary Robust Independent Elementary Features(Proc. of the 11th European Conf. on Computer Vision, Heraklion, Crete, 2010), pp. 778–792.https://doi.org/10.1007/978-3-642-15561-1_56. 22. A. Buades, B. Coll, J.M. Morel,A Non-local Algorithm for Image Denoising[C].
vol 2. (IEEE Computer Society Conference, 2005), pp. 60–65.
23. A. Buades, B. Coll, J.M. Morel, A review of image denoising algorithms, with a new one[J]. Multiscale Model Simul4(2), 490–530 (2005).
24. J. Weickert, B.M.T.H. Romeny, M.A. Viergever, Efficient and reliable schemes for nonlinear diffusion filtering[J]. Image Proc IEEE Trans7(3), 398–410 (1998). 25. I. Pitas, A.N. Venetsanopoulos,Nonlinear Digital Filters[M](Springer Science &
Business Media, 1990).
26. A. MARTIN, C.B. ROBERT, Random sample Concesus: proceeding of a parading for model fitting with applications to image analysis and automated cartography[J]. Commun. ACM24(6), 381–395 (1981). 27. S. Qiang, Y. Yutang, S. Yuncen, et al., Fast and stable method based on
optimized RANSAC algorithm for two-dimensional image[J]. China Comp. Federation Magazine33(6), 2373–2377 (2012).