ORIGINAL PAPER
A Data Envelopment Analysis approach for accessibility
measures: Simulating operational enhancement scenarios
for railway across Europe
F. Rotoli1&E. Navajas Cawood1&P. Christidis1
Received: 2 September 2014 / Accepted: 17 April 2015 / Published online: 10 May 2015
#The Author(s) 2015. This article is published with open access at SpringerLink.com
Abstract
Introduction As well known, infrastructure endowment influ-ences competitiveness of a region since the characteristics of a transport system in terms of capacity, connectivity, speeds, etc. determine the advantages/disadvantages of an area com-pared to other locations. This article attempts to investigate the potential impacts on rail accessibility across Europe when different possible operational enhancement scenarios are simulated.
Methods The simulations are carried out by means of a com-bination of the TRANSTOOLS rail network and Traffic An-alyst, the post-processing analyses are implemented in Matlab and the results for each zone (at NUTS3 level) are reported both in tabular form and in easy-to-read ArcGIS maps. Several accessibility measures are evaluated including two Data En-velopment Analysis (DEA) approaches aiming to construct a composite index for embracing all the complementary infor-mation provided by‘partial’ accessibility sub-indicators; to better evaluate and understand the results either sensitivity and robustness analyses are performed for both the aggregate indicators.
Results The outcomes provide insight into where major ben-efits in terms of accessibility can be expected; in particular the current infrastructure endowment already benefits many re-gions but improvements in speed could still increase signifi-cantly rail accessibility across Europe (mainly outside the core area as in Poland, Bulgaria, Romania, Slovakia, etc.). Further-more both the proposed global indexes, although associating different‘endogenous’weights to the various sub-indicators, appear to be worthy and robust against uniform random noise.
Conclusions Ultimately the results provide information useful for the prioritization of investment needs; moreover even if the interpretation of the partial accessibility indicators is clear and useful for policy-makers, the evaluation of a composite mea-sure could allow planners not only to compare or fully rank the level of accessibility for different regions but even to con-trol for eventual confusing and/or incomplete results that may appear when using only a partial approach.
Keywords Accessibility . European railway system .
Transport simulation and policy
1 Introduction
As stated in the White Paper on Transport [1]:BInfrastructure shapes mobility. No major change in transport will be possible without the support of an adequate network and more intelli-gence in using it. Overall, transport infrastructure investments have a positive impact on economic growth, create wealth and jobs, and enhance trade, geographical accessibility and the mobility of people. It has to be planned in a way that maxi-mizes positive impact on economic growth and minimaxi-mizes negative impact on the environment^. In this context, ascertained the strong relationship between accessibility and socio-economic regional development, in the last decades the
This article is part of the Topical Collection on Accessibility and Policy Making
* F. Rotoli
Francesco.Rotoli@ec.europa.eu
E. Navajas Cawood
elena.navajas-cawood@ec.europa.eu
P. Christidis
Panayotis.Christidis@ec.europa.eu
1 European Commission, Joint Research Centre–Institute for
topic of impacts on accessibility of transport policies has been widely treated in the scientific literature [2–17] and also in several European projects [18–21]. Beyond general assess-ment papers [2–7], several authors focused their attention ei-ther on particular corridors/areas [8–11] or on a wider scale [12–17].
This article simulates various European-wide scenarios as-suming different rail operational enhancements (such as im-proving speeds) and it attempts to assess qualitatively the po-tential impacts on railway accessibility across Europe.
Accessibility is a complex concept with various facets; in-ter alia it could be defined as‘the amount of effort for a person to reach a destination’or‘the number of activities which can be reached from a certain location’[3]. Indicators of accessi-bility measure the benefits households and firms in an area enjoy from the existence and use of the transport infrastructure relevant for their area [13]. As highlighted by Wegener et al. [13], accessibility could be calculated in function of origin, destination, spatial impedance, type and mode of transport. Our analysis focuses on European regions (origins and desti-nations) and rail passenger services; the spatial impedance between two regions is assumed equal to the travel time along the minimum path between the zones over the rail network.
The study analyses several accessibility indexes offering complementary information and mainly based on two con-cepts: travel resistance (cost, time, etc.) and attractiveness of urban agglomerations (depending on variables such as popu-lation, employment or gross domestic product). In particular four different indicators (emphasizing different cost or attrac-tion attributes) are explored: index of locaattrac-tion, relative effi-ciency of the network, potential and daily accessibility.
Since the location of each zone could influence the mea-sures of the mentioned sub-indicators (core-periphery pat-terns), the article also explores two different approaches trying to construct an accessibility composite indicator, thought as a synthetic parameter embracing all the complementary infor-mation delivered by the other four‘partial’accessibility mea-sures. In particular the research examines:
– a Data Envelopment Analysis (DEA) approach as already proposed among others by Martin, Gutiérrez, and Roman [22–25],
– a Benefit of Doubts (BOD) approach widely threated in the scientific literature for creating composite indicators (e.g. [26–37]), but according to the authors’knowledge, never used for synthetic accessibility index.
The Data Envelopment Analysis is a non-parametric meth-od for evaluating the relative efficiency of Decision Making Units; in the last years DEA has been extensively applied in several sectors, and also in transportation [38–44]. The meth-odology consists in obtaining from the available data an ap-proximation of theBbest-practice^ frontier by means of the
linear programming; efficiency measures are then investigated according to this surface [45–48].
Both the proposed approaches are based on the use of the DEA to create a composite indicator, but the main difference resides on the adopted model: in the first case the sub-indicators are either considered as inputs or outputs according to their characteristics and an output-oriented DEA with vari-able return of scale (VRS) is adopted to take in account the great heterogeneity among of the various European regions. The BOD approach, instead, as pointed out by Despotis [34], is formally equivalent to the original input oriented and constant-returns-to-scale DEA model presented by Charnes et al. [33], with the sub-indicators representing the different outputs and allocating a single‘dummy input’with value uni-ty to each country.
To test the proposed methodologies and also to better un-derstand the results, sensitivity and robustness analyses are performed on both the aggregate indicators; although associ-ating different weights to the various sub-indicators, both the models appear to be robust against uniform random noise. Furthermore the outcomes of the study show how the current European railway endowment already benefits many regions (mainly in Italy, Spain, Germany, Netherlands, UK, Austria, France, Belgium, etc.) but improvements in speed could still increase the accessibility of various areas.
Regarding the structure of this paper, after this introduction and brief review of the technical literature, the next paragraph describes in detail the proposed methodology and the utilized data while paragraph 3 illustrates the results of the analysis and finally paragraph 4 sets out our conclusions.
2 Data & methodology
This article summarizes the results of the model simulations carried out in order to estimate the potential impacts on rail accessibility of infrastructure enhancements across Europe (see also [17]). The model simulations have been performed by a combination of the TRANS-TOOLS rail network and Traffic Analyst: the TRANS-TOOLS (BTools for transport forecasting and scenario testing^) is a European transport net-work model that has been developed in collaborative projects funded by the European Commission’s Joint Research Centre and DG TREN (for more information see [49]) and it provides a quite detailed European rail network for 2005; its assign-ment module (Traffic Analyst by Rapidis, see [50]) allows the model to capture changes in route choice as a result of hypoth-esized changes in speed and frequency.
project on data collection for transport at European level aiming at providing a bridge between official statistics and applications within the transport policy theme; in practice it consists of an European Transport Policy Information System, combining data, analytical modelling with maps (GIS), and a single online interface for accessing the data.
The post-processing analyses of the results have been car-ried out with utilities developed in Matlab, while the outcomes for each zone have been also reported in easy-to-read ArcGIS maps (Fig.1).
Beyond the baseline (2005), three different scenarios have been implemented by changing speeds as follows:
& Scenario 200 km/h: speed increased up to 200 km/h for all links that currently have a speed lower than 200 km/h. For links with current speed higher than 200 km/h (high speed trains), no changes were introduced.
& Scenario 90 km/h: speed increased up to 90 km/h for all links that currently have a speed lower than 90 km/h. For links with current speed higher than 90 km/h, no changes were introduced.
& Scenario 45 km/h: speed decreased to 45 km/h for all links that currently have a speed higher than 45 km/h. For links with current speed lower than 45 km/h, no changes were introduced.
In practice the article assumes the best and worst (hypothetic) network settings by simulating respectively the Scenario 200 km/h and Scenario 45 km/h; this last one hy-pothesizes a degradation of the current network (or better an imaginary configuration previous to the baseline), to evaluate the benefits of the current infrastructure endowment compared to this lower bound. Subsequently the analysis estimates the effects of a more feasible and realistic interventions such as
increases of speed of some links (with current speed lower than 90 km/h).
As also proposed in other studies [18] our analysis con-siders the centroids of NUTS3 regions as origins and destina-tions. The all-or-nothing assignment module calculates the minimum paths through the networks, i.e. the path with min-imum travel times between the centroids of the regions. Ac-cording to the new travel times between each couple OD, for each scenario various accessibility indexes have been evaluated.
In the last decades, in fact, accessibility has been measured by several types of indicators often based on two different concepts: travel resistance (cost, time, etc.) and attractiveness of urban agglomerations (depending on variables such as pop-ulation, employment or gross domestic product). In this anal-ysis we have considered four different accessibility measures offering complementary information and highlighting differ-ent cost or attraction attributes.
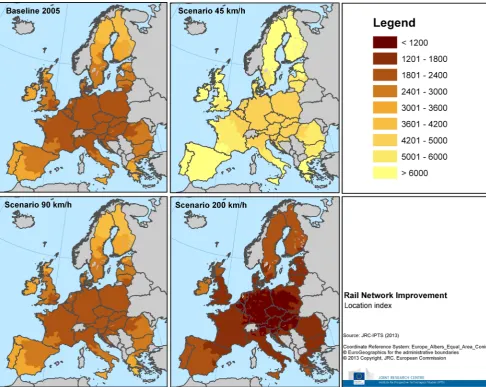
The location indexrepresents the average travel time be-tween each couple OD weighted on the mass, measured in this analysis by population of the destination regions:
Li¼ X
jti j*Wj
X
jWj
ð1Þ
where:
& Lirepresents the location index of origin i;
& tijrepresents the travel time between i and j;
& Wjrepresents the population of destination j (activities to
be reached at j).
Since no distance decay function (and so no discrimination between neighbor or far locations) is considered, the accessi-bility for each zone depends on the geographical position; remote locations present low accessibility values and even a good transport infrastructure endowment could be not enough to overcome the negative effects of a large geographical dis-tance to the main activity areas [11]. Figure 2 reports the location index for each NUT3 zone in Europe and for each simulated scenario showing clearly the above described core-periphery patterns; as expected the scenarios with maximum speed of 45 km/h or minimum speed of 200 km/h on the whole railway network present respectively the highest and lowest values of the location index.
The network efficiency indicatorBrepresents the distance between the real accessibility against the best accessibility that can be obtained if the zone is connected with all the other regions by the best possible infrastructure^ [22], in our case a network with speed on each link of at least 200 km/h.
It offers a measure in terms of the relative ease of access according to the network efficiency; the relative ease of access
is represented by the ratio of the travel time between 2 zones to the ideal travel time between the same zones assuming the best possible infrastructure, i.e. for us scenario 200 km/h):
Ni¼ X
j ti j t −i j
*Wj X
jWj
ð2Þ
where:
& Nirepresents the network efficiency indicator of origin i;
& tijrepresents the travel time between i and j;
& tijrepresents the travel time between i and j assuming the
best possible infrastructure (i.e. for us scenario 200 km/h);
& Wjrepresents the population of destination j.
This indicator provides an idea on how efficient are the connections from a given zone, regardless of its geographic location: it could occur that a region which is peripheral
according to the location index is highly accessible in terms of network efficiency [11]. The following figure shows the values of this indicator for each zone and each scenario; of course the scenario with speed of at least 200 km/h on the whole network represents the best possible (ideal) setting (A=1 for each region) (Fig.3).
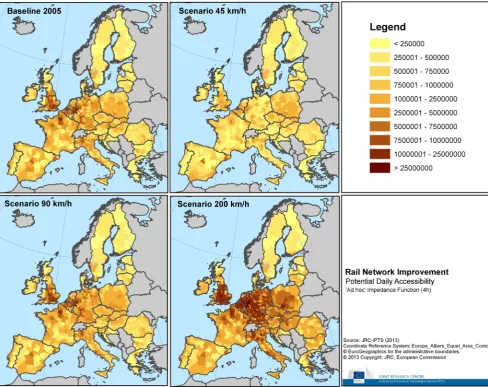
Finally regardingthe potential and the daily accessibility, it is possible to express them as a construct of two functions: the activities function (representing the activities or opportu-nities to be reached) and the impedance function (representing the effort, time, distance or cost needed to reach them):
Aim¼ X
jWj*F ci j ð3Þ
where:
& Aimrepresents the accessibility of origin i by mode m (i.e.
rail in our analysis);
& Wjrepresents the population of destination j (activities to
be reached at j).
& F(cij)represents the impedance function depending on the
generalized cost to reach destination j from origin i;
In practice (3) calculates the total of activities reach-able in j weighted by the ease of getting from i to j. As described by the impedance function, the interaction be-tween locations declines with the increasing disutility (distance, time, and/or costs) between them. In general, the perception and valuation of the distance between an origin and a destination differ according to transport modes, purpose of trips, characteristics of the household and of the destination [3]; in the present paper we fo-c u s e d o n r a i l m o d e a n d o n t h e p o p u l a t i o n o f destination.
Several forms of distance decay function have been already used and described in past accessibility studies; this analysis considers two different shapes depending on travel time (Fig.4):
& a negative exponential function to represent thepotential accessibility:
F ti j ¼e−βt; ð4Þ
Fig. 3 Efficiency Network Index for each NUTS3 zone and for each scenario
as proposed also in [18] in our analysisBthe parameterβ has been set to 0.005. That means that assuming a travel time between two regions of 0 min (which does not occur in reality), the population of the destination region would be included with its full value in the potential accessibility of the origin region, while for a travel time of little more than 2 h the weight is 0.5, and for a travel time of little more than 5 h the weight goes down to 0.2 only^ (see Fig.4).
& an‘ad hoc’impedance function dropping linearly from 1 to zero with travel times between 1 and 4 h (see Fig.4) to represent thedaily accessibility; this indicator calculates the amount of population or economic activities that can be reached from each zone within a limited period of trav-el time (in our analysis 4 h), so that it is possible to go and return within the same day and carry out some activities at the destination. The proposed decay function assigns weight 1 to destinations with travel time less than or equal to 1 h and linearly decreasing weights to farther locations with travel time within 4 h. Since the calculations of ac-cessibility have been implemented in Matlab with a post-processing application, it has not been difficult to repro-duce the proposed shape.
Of course different shapes of the impedance function could represent diverse aspects (and could provide different indica-tions) of accessibility; the described exponential decay func-tion (potential accessibility) allows to consider the populafunc-tion (activities) of all the reachable zones even if with a diverse weight depending on travel time, while the proposed‘ad hoc’ decay function associates the accessibility measures only to short trips with travel time within 4 h (allowing‘daily’ com-muting) giving a different and more specific indication. The following figures report the potential and daily accessibility values for each NUT3 zone and each considered scenario.
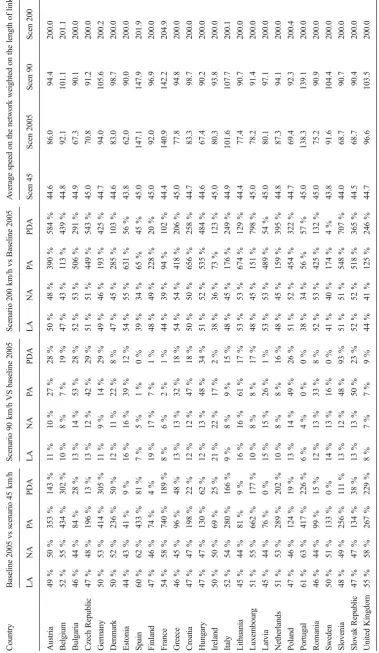
To allow a first analysis of the results, Table1reports the percentage of variation (at country level) of all the considered accessibility indicators comparing each alternative scenario and the baseline 2005 (do-nothing configuration); it presents also the average speed on the network (for each country) weighted on the length of the links.
As evident, all the proposed scenarios show a positive im-pact on the‘partial’accessibility measures for each country but the differences among of the indicators vary according to the specific area; also the baseline scenario (2005) presents a positive variation in accessibility compared to the hypothetic degraded configuration (maximum speed of 45 km/h on the whole network).
Analyzing the results of the previous table and the Figs.2,
3,5and6it is not difficult to recognize the different approach of each indicator, such as for example the core-periphery and border patterns of the location index and of the potential accessibility.
As pointed out in [24], in fact,Bthe interpretation of the partial accessibility indicators is clear and useful for policy-makers, but it does not provide a synthetic and global measure that allows planners to compare or fully rank the level of accessibility for different regions or cities within Europe. Be-sides this, it is necessary to control for some contradictory results that may confuse planners who only use a partial approach.^
Table2reports the Pearson and the Spearman correlation coefficients among of the considered accessibility indexes and for each scenario to assess how well their relationship can be described using respectively a linear or a monotonic function; results seem to justify the assumption that the different
‘partial’indicators can be considered complementary more than substitutive. As expected the potential and the daily ac-cessibility indexes present the strongest correlation; we have retained both the indicators in our successive analyses since, how already noticed, they allow us to measure accessibility from different perspectives (overall or‘within-4-h/daily’ ac-tivities reachable from each zone).
To better analyze the accessibility impacts of the simulated operational enhancements and trying to summarize the com-plementary information provided by the four described indi-cators, the authors have attempted to explore the construction of a composite indicator (CI) by means of two different approaches:
& Data Envelopment Analysis (DEA) [22–25];
& Benefit of Doubts (BOD) [26–36].
The first methodology is based mainly on the estimation of a DEA-accessibility index as already proposed by Martin, Gutiérrez, Roman and also Reggiani [22–25] while the second method recalls the wide scientific literature for creating com-posite indicators in analysis at large scale [26–36].
A frequent issue concerning the development of a global index is related to the weights to assign to the partial indica-tors; in this context, the main appeal of DEA-based composite indicators (CIs) is that they Blook for endogenous weights, which maximize the overall score for each decision-making unit given a set of other observations^[31].
Indeed the Data Envelopment Analysis is a non-parametric methodology for evaluating the relative effi-ciency of Decision Making Units; practically the proposed DEA approach suggests solving the following multiple ob-jective problem of accessibility for both the scenarios with and without interventions:
minjðLocationAccessibilityIndexÞ ¼minj Lj
minjðEfficiencyNetworkIndexÞ ¼minj Nj
maxjðPotentialAccessibilityIndexÞ ¼maxj PAj
maxjðPotentialDailyAccessibilityIndexÞ ¼maxj PDAj
where j represents the generic European NUT3 zone and L, N, PA and PDA represent respectively the location index, the network efficiency indicator, the potential and the daily accessibility.
In other words thisBsynthetic DEA-based indicator is cal-culated as the inverse of the maximum proportional accessi-bility outputs that can be obtained for the indicated accessibil-ity inputs^[10].
The model determines for each scenario the most efficient zones (from an accessibility perspective) to individuate the frontier of the envelopment surface; the regions not lying on the frontier are inefficient and the measurement of the grade of inefficiency is represented by their distance from this‘ best-practice’frontier.
When the data cannot be easily interpreted as inputs or outputs, a general rule suggests to consider the variables for which lower levels are better as inputs (in our case Location index and Network efficiency), and to treat as outputs those variables for which higher amounts are better (potential and daily accessibility in our analysis) [10].
We have assumed variable returns to scale (VRS) because of the great heterogeneity among of the various EU regions and an output orientation.
The Benefit of Doubts approach, instead, is rooted in the copious literature concerning CIs. Consideringmsub-indexes andnregions the idea is to merge the sub-indicators’values per region into a single number, e.g. their weighted average. In absence of reliable information about the weights, the proposed approach endogenously determines the weights maximizing the CI value for each region. In practice it comes to solving the following linear programming problem for each zone j:
CIj¼ X
iyi j*wi j
X
iyi j*wi j≤1ðbounding constraintÞ wi j≥ 0ðnon−negativity constraintÞ
ð6Þ
where:
& CIj represents the value of the composite indicator for
region j;
& yijrepresents the original value of sub-indicator i for
re-gion j;
& wijrepresents the weight of sub-indicator i for region j;
The benefit-of-the-doubt interpretation of the method-ology resides in the fact that the method chooses those weights maximizing the resulting indicator: the highest relative weights are accorded to those sub-indicators for which the zone j achieves the best performance (in rel-ative terms) when compared to the other regions in the sample.
This model is equivalent to the original input oriented, constant-returns-to-scale DEA model presented by Charnes et al. [33] (for more details see [29]), with the sub-indicators representing the different outputs and a single‘dummy input’ with value unity to each country.
Although, as pointed out in [30], a BOD-based indicator meets the property of units invariance, which makes the nor-malization stage redundant, the selected four sub-indicators have not the same direction, meaning that for some of them
(location index and network efficiency) higher values repre-sent worse performances. To overcome this issue theB min-max^normalization method has been applied to the results of thepartialindexes according to the original direction of the variables:
Ii j¼
yi j−minjð Þyi
maxj yi j −minjð Þyi
ð7Þ
Ii j¼
maxjð Þyi −yi j
maxj yi j −minjð Þyi
ð8Þ
where:
& i and jrepresent respectively the sub- indicator and the region
& Iij represents the normalized value of sub-indicator i in
region j;
& yijrepresents the original value of sub-indicator i in region j;
To better compare and also to test the two proposed ap-proaches, sensitivity and robustness analyses are performed on both the aggregate indicators for the baseline 2005 (do-nothing scenario). We have carried out the Data Envelopment Analysis several times eliminating the sub-indicators one by one, to evaluate the weight, the importance associated to each dimension in both the procedures and also to estimate the changes in scores.
Tables3,4,5and6report the Spearman correlation coef-ficients across the sub-indicators (eliminating one of them per time) and across the scenarios respectively applying the DEA or the BOD approach. In particular:
& Scenario 45(or45),Baseline 2005(or2005),Scenario 90
(or90) andScenario 200(or200) indicate the simulated scenarios;
& -LA indicates the DEA or BOD approach carried out neglecting the location index;
& -NA indicates the DEA or BOD approach carried out neglecting the network efficiency;
& -PA indicates the DEA or BOD approach carried out neglecting the potential accessibility;
& -PDA indicates the DEA or BOD approach carried out neglecting the potential daily accessibility;
& Allindicates the DEA or BOD approach carried out con-sidering all the sub-indicators
The tables point out the different set ofBendogenous^ weights (and the consequent relevance) associated to the sub-indicators applying the two methods and also how they vary across the scenarios; while for the DEA the most relevant indicator comes to be the potential acces-sibility, for the BOD procedure the major changes in results are obtained eliminating the location index. This is due to the different approach of the methods; as no-ticed by Martin and Reggiani [24], the DEA results Bcan be interpreted as the distance that separates every region from the most accessible location that can be found tak-ing into account all the observations^. In other words this Bindicator measures how accessible a region is with respect to all the other regions included in the sample^. The BOD approach, instead, maximizes the CI value (see formula (6)) for each region and so it takes in account also the heterogeneity of the sub-indicators among of the regions: the highest relative weights are accorded to those dimensions for which the region j achieves the best performance (in relative terms) when compared to the other regions in the sample; in other words Beach region has its own weights which are optimal and guarantee the best possible position for the associated region among all other regions in the sample. With any other weighting scheme, the relative position of that region would be worse.^[35].
The main disadvantage of this last method is that without additional setting constraints countries performing very well only in one indicator can be considered successful. This is why the scientific literature has focused on different ways to take in account experts’(subjective) opinions or to set addi-tional relative weight constrictions (e.g. pie share constraints). Anyway we have explored the original BOD approach and so no additional constraints are added except those already
described in (6). The described effect is quite evident in Tables 5 and 6 where the Scenario 200 is less relevant than the others since the network efficiency index pre-sents unity value for each region (reference B best-possible^ infrastructure).
Finally a robustness analysis has been performed on both the synthetic indicators adding a uniform casual noise to the nor-malized value of each sub-indicator, according to the formula:
Table 3 Spearman rank correlation across indicators applying the DEA approach
Scenario 45 45 - LA - NA - PA - PDA
- LA 0.977
-- NA 0.993 0.974
-- PA 0.826 0.808 0.805
-- PDA 0.996 0.972 0.994 0.802
-Baseline 2005 2005 - LA - NA - PA - PDA
- LA 1.000
-- NA 1.000 1.000
-- PA 0.847 0.847 0.847
-- PDA 0.999 0.999 0.999 0.840
-Scenario 90 2005 - LA - NA - PA - PDA
- LA 1.000
-- NA 0.973 0.973
-- PA 0.856 0.856 0.819
-- PDA 0.999 0.998 0.974 0.849
-Scenario 200 200 - LA - NA - PA - PDA
- LA 0.998
-- NA 1.000 0.998
-- PA 0.998 0.996 0.998
-- PDA 0.925 0.922 0.925 0.918
-Table 4 Spearman rank correlation across scenarios applying the DEA approach
ALL 2005 45 90 200
45 0.872
-90 0.971 0.872
-200 0.909 0.860 0.893
--LA 2005 45 90 200
45 0.881
-90 0.971 0.882
-200 0.916 0.832 0.900
--NA 2005 45 90 200
45 0.890
-90 0.992 0.900
-200 0.909 0.878 0.942
--PA 2005 45 90 200
45 0.828
-90 0.969 0.808
-200 0.742 0.576 0.728
--PDA 2005 45 90 200
45 0.882
-90 0.970 0.876
-Ii jk ¼Ii jþUnifð−α;αÞ*Ii ð9Þ
where
& Iijkrepresents the normalized value of sub-indicator i in
region j and for the casual extraction k;
& Iij represents the normalized value of sub-indicator i in
region j;
& Unif(−α,α)represents a uniform casual distribution with values between−αandα. The value ofαhas been set to 0.05 (5 %) in our analysis.
& Iirepresents the average of the normalized values of
sub-indicator i across the regions;
Table 5 Spearman rank correlation across indicators applying the BoD approach
Scenario 45 45 - LA - NA - PA - PDA
- LA 0.481
-- NA 0.956 0.379
-- PA 0.994 0.444 0.951
-- PDA 0.993 0.463 0.957 0.989
-Baseline 2005 2005 - LA - NA - PA - PDA
- LA 0.558
-- NA 0.766 0.101
-- PA 1.000 0.558 0.766
-- PDA 0.997 0.546 0.769 0.997
-Scenario 90 2005 - LA - NA - PA - PDA
- LA 0.474
-- NA 0.906 0.224
-- PA 1.000 0.474 0.907
-- PDA 0.998 0.466 0.907 0.998
-Scenario 200 200 - LA - NA - PA - PDA
- LA n/a
- NA n/a n/a
- PA n/a n/a n/a
- PDA n/a n/a n/a n/a
-Table 6 Spearman rank correlation across scenarios applying the BoD approach
ALL 2005 45 90 200
45 0.570
-90 0.848 0.845
-200 n/a n/a n/a
--LA 2005 45 90 200
45 0.322
-90 0.935 0.520
-200 n/a n/a n/a
--NA 2005 45 90 200
45 0.934
-90 0.988 0.964
-200 0.937 0.972 0.970
--PA 2005 45 90 200
45 0.553
-90 0.848 0.832
-200 n/a n/a n/a
--PDA 2005 45 90 200
45 0.569
-90 0.852 0.835
-In practice we have performed a Monte Carlo simulation by extracting 100 random values (within the range defined) of noise for each sub-indicator and assessing the related variation in outcomes. To evaluate the dispersion of the results, for each region we have calculated the variation coefficient, defined as the ratio of the standard deviation to the mean:
CV j¼
σj
μj
ð10Þ
where
& μiis the mean of the 100 simulated scores (in terms of
ranking) of the composite indicator for the region j;
& σjrepresents the standard deviation of the 100 simulated
scores (in terms of ranking) of the composite indicator for the region j;
Table7reports the mean and the standard deviation across all regions of the variation coefficient CVj. Both the
ap-proaches seem to be robust against the assumed uniform ca-sual noise: by hypothesizing a value ofα equal to 5 % the results show a variation coefficient of less than 2 % in both the cases.
3 Results
As reported below the outcomes of this study show how the current scenario already benefits many regions but improve-ments in speed could still increase significantly rail accessibil-ity across Europe. For example the above reported Table 1
indicates that the current infrastructure endowment (baseline
Table 7 Mean and standard deviation of the variation coefficient
Variation coefficient DEA approach BOD approach
Mean 0.015 0.017
Standard deviation 0.046 0.070
2005 versus scenario 45) benefits in terms of accessibility mainly the countries in the European core (such as Austria, Germany, Belgium, Luxembourg, Netherlands, Italy, United Kingdom) and even the Iberian Peninsula and France.
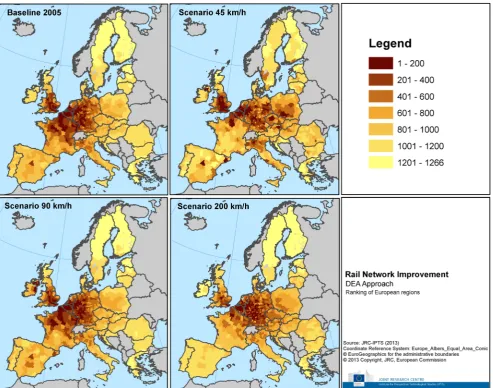
The same outcomes are also evident in Figs.7,8,9and10, reporting the rankings of accessibility (and the variation in it) across Europe and for all the scenarios. At this stage is worthy to notice that, as highlighted in the scientific literature, both the proposed composite indicators do not provide scores, but ranks; in other words, either DEA or BOD provides values but they are directly incomparable, and this explains why the re-sults are reported in relative rankings. In particular Figs.9and
10show the variation in ranking of accessibility for each sce-nario versus the baseline 2005; a negative value means that a region is better ranked when moving from the baseline to-wards the assumed scenario.
Table1and the next figures show also how slight improve-ments in speed (at least 90 km/h for all the links) could benefit mainly peripheral and border regions (in Bulgaria, Romania,
Poland, Greece, Hungary, Slovakia, etc.) and how eastern re-gions would gain accessibility advantages by ideally improv-ing the speed on the current railway network at least at 200 km/h; obviously, although technically not feasible (or hardly achievable), this hypothesis tries only to represent an extreme‘optimum’situation, an upper limit for the rail net-work (as well as the scenario 45 km/h represents a lower bound) with which comparing more plausible and less ambi-tious interventions.
Moreover, analyzing the DEA and BOD maps reported below, it seems quite reasonable that they embrace all the different information provided by the‘partial’ accessibility measures, even if with a different set of endogenous weights, as already noticed in the previous paragraph.
Looking for example at the maps for the baseline (2005) in Figs. 7 and 8, it is not difficult to recognize the outcomes already observed in Tables3,4,5and6: while the DEA index is mainly influenced by the potential accessibility, the BOD ranking takes more in account the location index and the
network efficiency. This difference affects also Figs.9and10: the BOD-based variation in ranking between the baseline and the degraded scenario 45 for the Iberian Peninsula, for exam-ple, is bigger than the corresponding variation applying the DEA approach.
Anyway in the authors’point of view both the methods are worthy and as already mentioned above they only present a different endogenous weighting scheme: while in the DEA approach the regions with highest values are considered the most efficient ones in terms of accessibility since they present the shortest distances from the
Bbest-practice^ frontier, the BOD attempts to be sensible to
national policy priorities, meaning that the set of optimal weights for each region guarantees its best position against all other zones in the sample, however the index is calculated so that regions with specializations in a par-ticular component are not penalized for this.
4 Conclusions
As already highlighted above, this article has tried to explore the impacts of improvements of the European railway infra-structures in order to evaluate how these could potentially
increase accessibility for passengers across European regions; it summarizes the results of the model simulations carried out with a combination of the TRANSTOOLS rail network and its assignment module (Traffic Analyst).
Beyond the baseline (year 2005), three different scenar-ios have been tested: two scenarscenar-ios simulating increases of speed at least up to 90 and 200 km/h on the whole rail network and the last one assuming a decrease down to 45 km/h.
Furthermore the study has considered four accessibility indicators providing different and complementary informa-tion: location index, relative efficiency of the network,
potential and daily accessibility. Since the results suggest that the location of each zone (core-periphery patterns) could in-fluence the measures of the various accessibility indicators, the article has also evaluated two different approaches (DEA and BOD) to create a composite accessibility index embracing all the complementary information delivered by the other four
‘partial’accessibility measures. In fact, as already pointed out among others by Martin and Reggiani [24], despite the clear and useful results provided by the sub-indicators, a composite measure could allow policy makers to control for eventual confusing and/or incomplete scenarios which may appear when using only a partial approach. Sensitivity and robustness
analyses have been carried out to test the proposed methodol-ogies and to better analyze the results.
The outcomes provide insight into where major benefits in terms of accessibility can be expected; this information, in turn, could also be useful for the prioritization of investment needs. In particular the results of the study show how the current European railway infrastructure already benefits many regions (mainly in Italy, Spain, Germany, Netherlands, UK, Austria, France, Belgium, etc.) but improvements in speed could still increase the accessibility of various areas (mainly outside the core) of Europe (as in Poland, Bulgaria, Romania, Slovakia, etc.).
Moreover the proposed composite indicators appear wor-thy and robust against casual noise. Their biggest advantage is represented by their different weighting schemes: the weights of the partial indicators do not need to be fixed‘a priori’but they are endogenously derived by the methodology.
Disclaimer The views expressed are purely those of the authors and may not in any circumstances be regarded as stating an official position of the European Commission.
Open AccessThis article is distributed under the terms of the Creative C o m m o n s A t t r i b u t i o n 4 . 0 I n t e r n a t i o n a l L i c e n s e ( h t t p : / / creativecommons.org/licenses/by/4.0/), which permits unrestricted use, dis-tribution, and reproduction in any medium, provided you give appropriate credit to the original author(s) and the source, provide a link to the Creative Commons license, and indicate if changes were made.
References
1. EUROPEAN COMMISSION (2011) WHITE PAPER. Roadmap
to a single European transport area–towards a competitive and
resource efficient transport system
2. Schürmann C, Spiekermann K, Wegener M (1997) Accessibility
indicators. Berichte aus dem Institut für Raumplanung 39. Dortmund: IRPUD
3. Geurs KT, Ritsema van Eck JR (2001) Accessibility measures:
review and applications. RIVM report 408505 006. National Institute of Public Health and the Environment, Bilthoven
4. Geurs KTV, Wee B (2004) Accessibility evaluation of land-use and
transport strategies: review and research directions. J Transp Geogr
12:127–140
5. Gutiérrez J, Monzón A, Piñero JM (1998) Accessibility, network
efficiency, and transport infrastructure planning. Environ Plan A
30:1337–1350
6. Morris JM, Dumble PL, Wigan MR (1978) Accessibility indicators
for transport planning. Transp Res 13A:91–109
7. Van Wee B, Geurs K (2011) Discussing equity and social exclusion
in accessibility evaluations. Eur J Transp Infrastruct Res 11(4):350–
367
8. Gutiérrez J (2001) Location, economic potential and daily
accessi-bility: an analysis of the accessibility impact of the high-speed line
Madrid-Barcelona-French border. J Transp Geogr 9:229–242
9. Martin JC, Gutiérrez J, Roman C (2006) Evaluating accessibility
gains produced by new high-speed train services. In: Jourquin B, Rietveld P, Westin K (ed) Towards better performing transport
networks, part III. Routledge Studies in Business Organizations and Networks
10. Salze P, Banos A, Oppert J-M, Charreire H, Casey R, Simon C,
Chaix B, Badariotti D, Weber C (2011) Estimating spatial accessi-bility to facilities on the regional scale: an extended commuting-based interaction potential model. Int J Health Geogr
11. López E, Gutiérrez J, Gómez G (2008) Measuring regional
cohe-sion effects of large-scale transport infrastructure investments: an
accessibility approach. Eur Plan Stud 16(2):277–301
12. Spiekermann K, Neubauer J (2002) European accessibility and
peripherality: concepts, models and indicators. Nordregio working paper. Nordregio, Stockholm, p 9
13. Wegener M, Eskelinnen H, Fürst F, Schürmann C, Spiekermann K
(2002) Criteria for the Spatial Differentiation of the EU Territory: Geographical Position. Forschungen 102.2, Bonn: Bundesamt für Bauwesen und Raumordnung.
14. Linneker B (1997) Transport infrastructure and regional economic
development in Europe: a review of theoretical and methodological approaches, TRP 133. Department of Town and Regional Planning, Sheffield
15. Vickerman RW (1995) The regional impacts of Trans-European
networks. Ann Reg Sci 29
16. Martin JC, Gutiérrez J, Roman C (2007) Accessibility impacts of
the Trans-European railway network. In: Van Geenhuizen M, Reggiani A, Rietveld P (ed) Policy analysis of transport networks. Part II. Ashgate Publishing Company
17. Rotoli F, Christidis P, Vannacci L, Lopez-Ruiz HG, Navajas CE,
Ibáñez RN (2014) Potential impacts on accessibility and consumer surplus of improvements of the European railway system. Transp
Res Procedia 3:319–328
18. ESPON (2007) Update of selected potential accessibility indicators.
Final Report. Spiekermann & Wegener Urban and Regional Research (S&W), RRG Spatial Planning and Geoinformation
19. EUROPEAN COMMISSION (2013) TIPTAP ESPON project:
ter-ritorial impact package for transport and agricultural policies.http://
www.espon.eu/main/Menu_Projects/Menu_AppliedResearch/ tiptap.html
20. NECTAR-Network on European Communications and Transport
Activity Research.http://www.nectar-eu.org/Clusters/Cluster6/
Cluster6.htm
21. EUROPEAN COMMISSION (2010) DG regional policy, fifth
re-port on economic, social and territorial cohesion.http://ec.europa.
eu/regional_policy/information/reports/index_en.cfm
22. Martin JC, Gutiérrez J, Roman C (2003) An accessibility DEA
index to measure the impact of new infrastructure investment. The case of the HST corridor Madrid-Barcelona-French Border. ALdE (Asociación Libre de Economia), VI Encuentro de Economia Applicada,, Granada, 6 Junio 2003
23. Martin JC, Gutiérrez J, Roman C (2004) Data Envelopment
Analysis (DEA) index to measure the accessibility impacts of new infrastructure investments: the case of the high- speed train
corridor Madrid-Barcelona-French border. Reg Stud 38(6):697–
712
24. Martín JC, Reggiani A (2007) Recent methodological
develop-ments to measure spatial interaction: synthetic accessibility indices
applied to high‐speed train investments. Transp Rev 27(5):551–571
25. Hesse C, Evangelinos C, Bohne S (2013) Accessibility measures
and flight schedules: an application to the European air transport, European Transport, Issue 55, Paper n° 6
26. OECD-JRC (2008) Handbook on constructing composite
indica-tors: methodology and user guide. Organisation for Economic Co-operation and Development, Paris
27. Nardo M, Saisana M, Saltelli A, Tarantola S (2005) Tools for
com-posite indicators building. Joint Research Centre, Ispra,EUR
28. Cherchye L, Moesen W, Rogge N, Van Puyenbroeck T (2008) Benefit of the doubt composite indicators. Workpackage 5. Deliverable 5.3. KEI-project supported by European Commission by funding from the Sixth Framework Programme for Research
29. Cherchye L, Moesen W, Rogge N, Van Puyenbroeck T, Saisana M,
Saltelli A, Liska R, Tarantola S (2006) Creating composite indica-tors with DEA and robustness analysis: the case of the technology achievement index. KEI-project supported by European Commission by funding from the Sixth Framework Programme for Research
30. Cherchye L, Moesen W, Rogge N, Van Puyenbroeck T, Saisana M,
Saltelli A, Liska R, Tarantola S (2008) Creating composite indica-tors with DEA and robustness analysis: the case of the technology achievement index. J Oper Res Soc 59(2)
31. Cooper WW, Seiford LM, Zhu J (2011) Handbook on data
envel-opment analysis (2nd edition). International Series in Operations Research & Management Science 164
32. Cherchye L, Kuosmanen T (2002) Benchmarking sustainable
de-velopment: a synthetic meta-index approach. Working paper
33. Charnes A, Cooper W, Rhodes E (1978) Measuring the efficiency
of decision-making units. Eur J Oper Res 2:429–444
34. Despotis DK (2005) A reassessment of the human development
index via data envelopment analysis. J Oper Res Soc 56:969–980
35. Hudrliková L (2013) Composite indicators as a useful tool for
in-ternational comparison: the Europe 2020 example. Prague Econ
Pap 2013(4):459–473
36. Vidoli F, Mazziotta C (2013) Robust weighted composite indicator
by means of frontier methods with an application to European in-frastructure endowment. Stat Appl Ital J Appl Stat 23(2)
37. Saisana M, Saltelli A, Tarantola S (2005) Uncertainty and
sensitiv-ity analysis techniques as tools for qualsensitiv-ity assessment of composite
indicators. J R Stat Soc 168(Part 2):307–323
38. Lozano S, Gutiérrez E, Salmerón JL (2009). Network DEA models
in transportation. Application to airports. German Aviation
Research Society Seminar on Airport Benchmarking, Berlin, 20–
21 November 2009
39. Schaar D (2010) A method for stakeholder-based comparative
benchmarking of airports. Dissertation submitted in partial fulfil-ment of the requirefulfil-ments for the degree of Doctor of Philosophy at George Mason University
40. Wang TF, Song DW, Cullinane K (2002) The applicability of data
envelopment analysis to efficiency measurement of container ports. IAME Panama 2002 Conference Proceedings
41. Lin LC, Tseng LA (2005) Application of DEA and SFA on the
measurement of operating efficiencies for 27 international container
ports. Proceed East Asia Soc Transp Stud 5:592–607
42. Yu MM, Lin ETJ (2008) Efficiency and effectiveness in railway
performance using a multi-activity network DEA model. OMEGA
Int J Manag Sci 36:1005–1017
43. Barnum DT, McNeil S, Hart J (2007) Comparing the efficiency of
public transportation subunits using data envelopment analysis. J Public Transp 10(2)
44. Oum TH, Waters WG, Yu C (1999) A survey of productivity and
efficiency measurement in rail transport. J Transp Econ Policy
33(Part 1):9–42
45. Coelli TJ, Rao DSP, O’Donnell CJ, Battese GE (2005) An
intro-duction to efficiency and productivity analysis, 2nd edn. Springer, New York
46. Coelli TJ (1996) A guide to DEAP version 2.1: a data envelopment
analysis (computer) program. Centre for Efficiency and Productivity Analysis (CEPA). Working Paper N. 8/96
47. Erkoce TE (2012) Estimation methodology of economic efficiency:
stochastic frontier analysis vs data envelopment analysis. Int J Acad Res Econ Manag Sci 1(1)
48. Botasso A, Conti M (2011) Quantitative techinques for
regu-latory benchmarking. Cerre (Centre on regulation in Europe) study
49. EUROPEAN COMMISSION, JRC, IPTS: Trans-tools model.
http://energy.jrc.ec.europa.eu/transtools/
50. RAPIDIS, Traffic analyst.
http://www.rapidis.com/products/traffic-analyst/
51. EUROPEAN COMMISSION, ETIS plus Project.http://www.