RESEARCH ARTICLE
Quality visual landmark selection based
on distinctiveness and repeatability
Masamichi Shimoda and Kimotoshi Yamazaki
*Abstract
In this study, a method for landmark selection from image streams captured by a camera mounted on a mobile robot is described. To select stable visual landmarks for mobile robots, two measures regarding landmark “visibility” are con-sidered: distinctiveness and repeatability. In the proposed method, several neighboring feature points form a visual landmark and their distinctiveness is evaluated in each image. Then, under the assumption that a robot can actively seek a feasible landmark, the repeatability of the landmark is evaluated. Weighting techniques using feature-position relations are proposed, and landmark selection criteria using a variation coefficient are employed. These allow us to select high-visibility landmarks. Experimental results obtained using a real mobile robot demonstrate the effective-ness of the proposed method.
Keywords: Landmark selection, Mobile robot, Visibility
© 2015 Shimoda and Yamazaki. This article is distributed under the terms of the Creative Commons Attribution 4.0 International License (http://creativecommons.org/licenses/by/4.0/), which permits unrestricted use, distribution, and reproduction in any medium, provided you give appropriate credit to the original author(s) and the source, provide a link to the Creative Commons license, and indicate if changes were made.
Background
Mobile robots can have an extensive workspace in both indoor and outdoor environments. Thus, a reliable method for self-localization is very important. Several studies have examined the use of cameras and laser range finders to achieve environmental recognition and locali-zation [1, 2].
The purpose of this study is to establish a framework for collecting visual landmarks from image streams. The image streams are assumed to be captured by a camera mounted on a mobile robot, and visual landmarks with high visibility are automatically extracted from the image streams. To understand “visibility” in the context of this study, we focus on distinctiveness and repeatability. Dis-tinctiveness is represented by the uniqueness of a local image region in a robot’s workspace, and repeatability is represented by the robustness of local image regions against possible viewpoint changes and occlusion. Both distinctiveness and repeatability are important for mobile robots because landmark detection might fail under vari-ous uncertain situations, e.g., accumulative positioning error and the kidnapping problem.
One conventional method to avoid such situations is the use of an image sequence [3, 4], which allows the determination of the current position with fast and light processing. However, it has a weakness: large occlusions or scene changing might cause a failure. Image features have also been used for reliable local information. For mobile robot navigation, hundreds of features detected from a single image have been used as landmarks [5–8]. Ogawa et al. [9] proposed a landmark selection method for robot navigation with a single camera. They extracted image features from each image and directly used them to describe a scene. Some studies employed an impor-tant theme relevant to feature point selection. Thomp-son et al. [10] proposed the use of landmarks selected automatically from panoramic images. “Turn Back and Look” behavior was used to evaluate potential land-marks. Normalized correlation enhanced a landmark’s robustness against dramatic illumination change. Knopp et al. [11] proposed a method to suppress confusing fea-tures for increasing the success rate of localization. Hafez et al. [12] targeted a crowded urban environment and proposed a method to learn useful features through mul-tiple experiences.
Some other studies have used local image regions as landmarks [13, 14]. Each image region includes some distinctive visual information, e.g., dozens of feature
Open Access
*Correspondence: [email protected]
points. In contrast to the straightforward use of feature points, this setting allows easy viewpoint selection with a limited viewing field. In addition, if we annotate each landmark, they can be used for more semantic purposes. Both are suitable for autonomous mobile robots. In this study, we define a visual landmark using a local image region comprising dozens of neighboring image features. It is assumed that the robot travels multiple times on predefined courses, and useful landmarks are gradually selected during navigation.
We propose a method to select image regions with high distinctiveness and repeatability. Visual landmarks selected via the proposed method enable mobile robots to identify location using densely packed knowledge. However, well-designed evaluation criteria are required to select a quality landmark. One contribution of this study is to provide easily available criteria. Through experiments, we found that weighting each feature point in a local image region is important to describe a landmark with high distinctiveness and repeatability. The weight value is defined by the number of detec-tions among input images. A high weight value is given to the feature point that is found in all images of a com-mon scene from different observation points.
The remainder of this paper is organized as follows. "Visual landmarks" explains our representation of a visual landmark. "Landmark candidates collection" introduces landmark candidate selection, and "Landmark selection criteria" proposes landmark selection criteria. " Experi-ments" presents experimental results, and "Conclusion" concludes the paper.
Visual landmarks Landmark availability
The quality of landmarks should be considered when extracting visual landmarks from image streams. In this study, we focus on the following four characteristics:
1. The landmark should be easy to distinguish from other parts of the scenes.
2. The landmark should be robust against occlusion. 3. There should be no significant difference of
appear-ance even if the viewpoint changes.
4. The landmark should belong to a motionless object.
The above are based on conventional ideas for robust navigation. Item (1) conveys that distinguishable local image regions are easy to find from various viewpoints and capturing conditions. In addition, it suggests a way to eliminate confusing and redundant landmarks found in a scene. Item (2) is essentially achieved by using local image regions; however, it would be desirable to preemp-tively evaluate the possibility of occlusion. Item (3) is
mostly applicable to mobile robots because a moving trajectory will not necessarily be the same for different navigations. Item (4) causes landmark deprivation, which negatively affects the reliability of self-localization.
Here, item (1) is associated with “distinctiveness,” and items (2) to (4) are related to “repeatability.” Landmarks that satisfy distinctiveness and repeatability are con-sidered to have high “visibility.” The proposed method selects quality visual landmarks in a step-by-step manner.
Distinctive feature region extraction based on feature point grouping
Image feature descriptions have been actively stud-ied; therefore, we are now able to use high performance descriptors [15–17]. Since a tiny image region is required for many descriptors, using a group of image features affords good object detection performance that is robust against occlusion [18].
In this study, to generate a stable visual landmark, a rec-tangular region with dense image features is defined. The procedure to obtain a visual landmark is as follows. SIFT features are extracted from an input image. The detec-tion criteria are the same as those described in [15]. Next, one feature is selected, and its neighboring features are searched. If the Euclidean distance between the selected feature and a neighboring feature in image coordinates is less than the predefined threshold D, they belong to the same group. Using the same procedure, another feature whose distance from the neighboring feature is less than the threshold is added to the group. This procedure ena-bles the search for a cluster of image features. Finally, a circumscribed rectangular box that includes the cluster is generated as a local feature region of focus.
A local feature region is not necessarily required to have extremely dense feature points. If a landmark com-prises highly distinctive features, it might have high vis-ibility even if there are a less number of high-visvis-ibility features. However, a certain level of density is required; thus, parameter D is defined.
The abovementioned procedure might produce an uninformative image region comprising low distinctive features. Moreover, image regions without repeatability might be selected. To create a quality visual landmark, the feature region selection process is performed accord-ing to the procedure explained in "Landmark candidates collection" and "Landmark selection criteria".
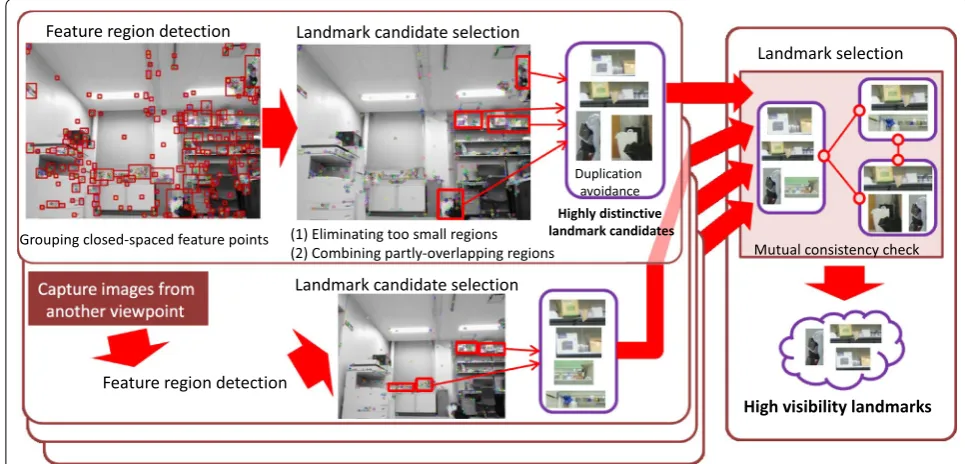
Landmark candidates collection
Landmark selection procedure
Feature region detection: SIFT features are extracted from an image, and rectangular regions that contain a feature cluster are selected ("Distinctive feature region extraction based on feature point grouping").
Landmark candidate selection: Landmark candidate selection comprises two processes: small region elim-ination (explained below) and duplication avoidance (explained in "SIFT feature matching").
Landmark selection: Note that only one image is considered in the above two phases. As we must select landmarks with high repeatability, robustness against viewpoint changes should be considered. Thus, the “Matching” process explained in "SIFT fea-ture matching" is performed. Landmark repeatability is guaranteed by using dozens of images that capture the same scene from various viewpoints.
Here, we describe the small region elimination process. After the detection of local feature regions, the area size
S of each region is calculated by image coordinates. Then, regions with S less than the predefined threshold Ss are
eliminated. However, if a smaller region partly overlaps another larger region, the smaller region is considered over the larger region. The landmarks are also eliminated when the resulting region sizes are greater than the pre-defined threshold Si.
SIFT feature matching
The visual landmark used in this study comprises doz-ens of SIFT features. A SIFT feature is described by a
128-dimensional vector, and the representation is invari-ant to scale, translation, and rotation. In addition, its robustness against illumination is useful for robots in outdoor environments. Note that feature-to-feature matching is performed for both landmark detection and selection.
We apply two types of matching calculation. One is performed between two local feature regions cut from one input image to remove duplicate textures in the same scene. The other is applied for searching a local feature region from an input image to find one registered feature region from a present scene. We refer to the former match-ing as “Duplication Check” and the latter as “Matching.”
In Duplication Check, SIFT features are extracted from an image, and then, the local feature regions are generated. Let I be an image captured in a robot’s workspace. Let FA= {f(A)
1 ,f
(A)
2 ,. . .,f
(A)
N } be one local
feature region extracted from I, where f is a feature
vec-tor that corresponds to a feature point. Similarly, let FB= {f(B)
1 ,f
(B)
2 ,. . .,f
(B)
M } be another local feature region, where N <M. To calculate the similarity between FA and FB, a feature vector fn(A) is specified from FA and the Euclidean distances with all of feature vectors in FB are calculated. A feature vector fm(B) with the minimum
dis-tance from fn(A) is specified. If the distance is less than a
pre-defined threshold, fn(A) is considered to have
corre-spondence. For all feature vectors in FA, if the number of correspondences is greater than the pre-defined threshold, the two feature regions are eliminated because they are too similar to represent an independent region.
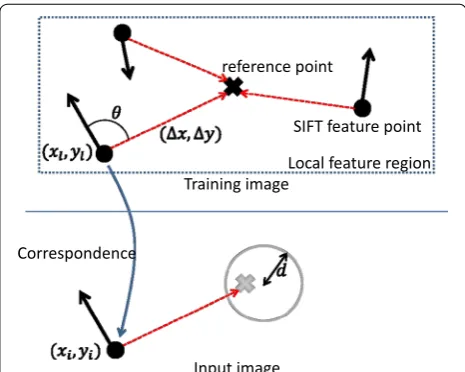
In Matching, the distance calculation is the same as that in Duplication Check. However, another distance threshold b2, which is looser than b1, is used. Then, a con-sistency check is performed against the resulting corre-spondences. First, the center of gravity of a local feature region is set as a reference point. As shown in the upper part of Fig. 2, a positional vector from each feature point to the reference point is calculated. The vector is trans-ferred into a corresponding feature point extracted from an input image. Thus, the position of a reference point can be estimated in the input image. A SIFT feature con-tains information about intensity, direction, and scale; therefore, position (X, Y) is calculated using the following equations:
where σl and θl are the scale and angle of a feature point,
respectively. In addition, σi and θi are the same
vari-ables for a feature point in the input image; xi and yi are
coordinates of the point in the image; and (�x,�y) is a
positional vector. If the number of estimated reference points, which are concentrated in a circle of radius d, is greater than the pre-defined threshold m2, the local
fea-ture region is considered to have correspondence. (1) X=xi−
σi
σl ×
�x2 +�y2
×cos(θ+θl−θi),
Y =yi−
σi σl ×
�x2 +�y2
×sin(θ+θl−θi),
θ =tan−1�y
�x,
The above idea is inspired by the implicit shape model [19], which is used for generic object recognition. Such positional relations are useful for eliminating mismatch-ing when the similarity value becomes high with feature-to-feature correspondence [20].
Landmark selection criteria
Several local feature regions are selected through the procedure described in "SIFT feature matching", which considers distinctiveness. In other words, these feature regions satisfy item (1) ("Landmark availability"). Next, these regions are screened relative to repeatability based on items (2) to (4).
In this study, we have attempted to develop a visual function for an autonomous mobile robot. One assump-tion is that we can deploy an autonomous robot that moves in a workspace. Scene observation at various viewpoints enhances the quality of knowledge used for visual navigation. Based on the above discussion, land-mark selection with multiple observations is performed. In other words, a camera is mounted on a robot, and n
number of images are captured for one target scene while the robot moves.
Using these images, we employ the following four land-mark selection methods.
(a) Pairwise comparison of local feature regions [13]. (b) Repeatability of local feature regions in input images. (c) Counting individual local feature correspondences
in input images.
(d) Using weight coefficient.
The details of these methods are described in the fol-lowing order.
(a) Pairwise comparison of local feature regions
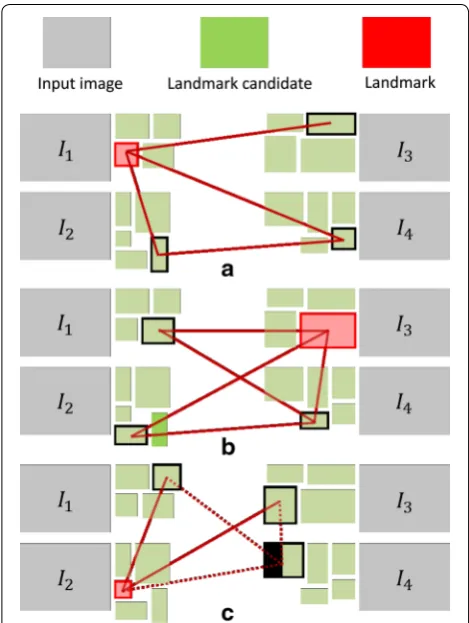
Here, “Duplication Check” techniques described in "SIFT feature matching" are used. First, one local feature region is selected and its similarity with another local feature region in another image is calculated. If the simi-larity value (i.e., the number of matched feature points) of the most similar region is greater than a predefined threshold, the two regions are associated (dark red line in Fig. 3). By applying this process to all local feature regions, a non-directed graph is obtained. Next, a set of local feature regions associated with each other is sought. The region with the greatest number of arcs lc is selected as a visual landmark. Here, lc is a criterion used to iden-tify the visibility of a landmark.
Figure 3 shows three examples of landmark selection. Four sets of local feature regions are extracted from four different images. In the case of (A), the red-painted land-mark candidate is selected by counting the number of arcs. When several landmark candidates have the same Fig. 2 Positional relationship between feature point and reference
number of arcs, as shown in (B), a region with denser feature points is selected. Item (C) shows another case. When one region has the greatest number of arcs but large occlusion reduces the number of observable feature points, it is not selected as a landmark.
(b) Repeatability of local feature regions in input images Here, “Matching” described in "SIFT feature match-ing" is used wherein a local feature region is selected in order and sought from each image. By applying the seek-ing process toward n images, the number of detections li is counted, where i indicates a serial number of a local
feature region. If li is greater than a predefined
thresh-old, then the ith local feature region is registered as a landmark.
In the processing explained in item (a), local feature region detection may fail when some feature points can-not be extracted from an input image. This means that
the local feature regions extracted at different viewpoints might lose the correct correspondence. Meanwhile, the abovementioned process makes it possible to restore the situation.
(c) Counting individual local feature correspondences in input images
The abovementioned process considers landmark qual-ity using the local feature region. However, better performance might be obtained if the number of cor-respondences between two image feature points is also considered. For example, if a feature point is extracted at the local region that captures two distant objects, its appearance is largely influenced by viewpoint changes. The local feature region having such a feature point should be assigned low reliability. Thus, we propose the following measure.
As with item (b), a local feature region is sought from images. In each of feature region seeking process, the number of feature correspondences is registered. This describes the frequency of finding respective feature points from several input images; thus, weight coefficient
gj is defined by the number of feature correspondences,
where j denote the serial number of feature point. If gj is
greater than a pre-defined threshold, a parameter fg is
incremented. A landmark with large fg has the potential
to be a high repeatability landmark.
(d) Using weight coefficient
Using weight coefficient gj described above, another
weight coefficient G is calculated as follows:
When occlusion or appearance change occur by changes in viewpoint, G becomes small. In other words, large
G are one criterion for selecting high repeatability landmarks.
fg and G are similar criteria, where fg, which indicates
the number of detection for each feature point, is bina-rized and G is a variable that directly considers the num-ber of detections. The latter allows us to know the quality of a landmark in more detail. In addition, it allows us to represent additional information, e.g., the density of good features.
Experiments Settings
A mobile robot with a single mounted camera was used for our experiments. The mobile platform was “i-Cart mini” produced by the T-frog project [21], and the cam-era was a BSW32KM (Buffalo Americas Inc.). A laptop computer was mounted on the platform. It was used to (2) G= gj
k Fig. 3 Mutual consistency check. Several local feature regions are
extracted from four different images. a The red-painted landmark
can-didate is selected based on the number of arcs. b A landmark with
dense feature points is selected if several landmark candidates have
the same number of arcs. c When one region has the largest number
capture VGA (640×480 pixels) images and control the platform. Image datasets were collected for both indoor (our experimental laboratory) and outdoor (ten different scenes on our university campus) environments.
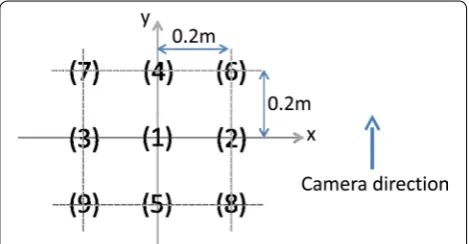
Quality landmark selection
Nine shooting locations were set in each of the target scenes, as shown in Fig. 4. The distance between neigh-boring locations was 0.2 m.
Landmark selection was performed by the four meth-ods described in "Landmark selection criteria". The parameters used to select the local feature region were experimentally defined as follows:
– Euclidean distance D to group two feature points ("
Dis-tinctive feature region extraction based on feature point grouping") was set to √10.
– Radius for investigating feature concentration ("SIFT
feature matching") was set to d≤√10
– b1≤150 and b2≤250 ("SIFT feature matching"), – Thresholds for the area of feature region Ss and Sl
("Landmark selection procedure") were set to 2500 and 40,000, respectively.
The parameters used to select a visual landmark deter-mined by brute force. The results were as follows:
(a) Number of high similarity regions: lc≥3.
(b) Number of corresponding regions: li≥9.
(c) Number of detections of features: gj≥9
These were the conditions used to select visual land-marks with respect to the criteria introduced in " Land-mark selection criteria". Only the landmark candidates that satisfied each condition were selected as visual land-marks. These values were based on the assumption that nine images were used. If more images are to be used, these values should be increased linearly.
The abovementioned parameters were experimentally defined; therefore, one concern was their sensitivity. In
our experience, it was not significantly high as long as we examined the proposed method using images cap-tured in indoor and outdoor environments. When we slightly changed the parameters, the quality of the land-marks degraded in some scenes even though the changes improved the quality of landmarks in other scenes. The parameters given in this study might be rough estimates; however, they provided acceptable results.
Criterion for quality evaluation
In this study, it was assumed that a robot travels on a pre-defined course many times. While the robot moves along the course, the number of detections for each landmark was counted. The result was then used to evaluate the repeatability of the landmark.
A variation coefficient was used for this purpose. This calculation was performed by dividing the standard devi-ation (Std.) by the average (Ave.) with respect to the num-ber of detections for each landmark. If the value is small, we consider the landmark to have high repeatability.
Landmark examples
First, we present a landmark selection example from indoor environments. The visibility of these landmarks was confirmed through eleven automatic navigations. In each navigation, one hundred images were captured at 3 [fps]. Landmarks were then detected using these images.
The rightmost images in Fig. 5 are visual landmarks selected from the scene. The left columns in the table show the name of the landmark, and the top row shows the number of experiments. A to D show landmarks whose number of arcs was greater than 9 (li≥9). They
were stably detected in the complete images with a small variation coefficient. On the other hand, E and F show li=7 and li =8, respectively. These were also relatively
stable landmarks; however, the values of the variation coefficient were greater than those of the abovemen-tioned case. These results indicate that li can be used to
determine the landmark quality.
Visibility evaluation
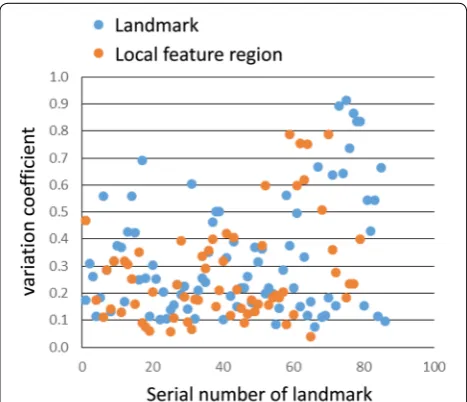
The same procedure described in the previous subsec-tion was performed using images obtained in ten out-door locations. Methods (a)–(d) ("Landmark selection criteria") were used to determine whether they are suit-able for selecting a quality landmark. Figure 6 shows a list of variation coefficients for all local feature regions. The blue and red points indicate landmarks and other local feature regions, respectively. It is not always true that landmarks with lc greater than 3 have a smaller variation coefficient than the other local feature regions. The same holds true for Fig. 7, which shows the results for method Fig. 4 Image capturing positions. Nine positions divided in a reticular
(b). In addition, it is not always true that landmarks with li greater than 9 have a small variation coefficient.
The SIFT features included in the landmarks were examined to clarify the reason behind these observa-tions. In some cases, the features were extracted from a spatial region where a large perspective change occurred. These features are not robust against viewpoint changes; thus, it is expected that they would not be included in the landmark. Another problem unique to method (a) is that a local feature region can differ according to the layout of the feature points. Figure 8 shows an example. One large region was extracted at one viewpoint; however, it was divided into two regions in another viewpoint. This caused a misdetection of the landmark.
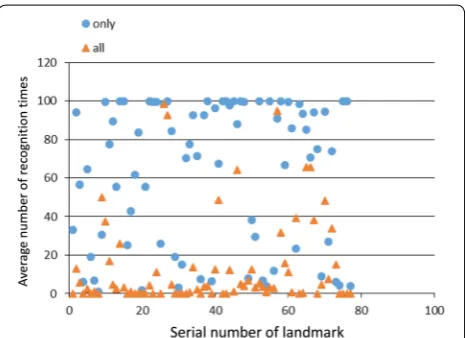
Method (c) considers the adequacy of SIFT features. Figure 9 shows the relation between the serial number of the landmark and the variation coefficient. Here, “all” means that all features were used for landmark detection and “only” means that only features with weight coef-ficient fg were used for the detection. Obviously, using
features with the weight coefficient resulted in small vari-ation coefficients. This means that the criteria for defin-ing the weight coefficient are useful for selectdefin-ing high visibility landmarks.
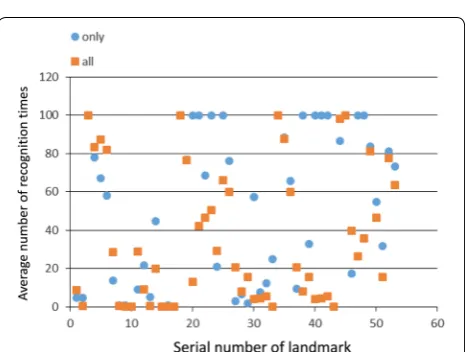
Figure 10 shows the relation between the serial number of a landmark and the average number of correct corre-spondences. Using features with a weighted coefficient provided stable landmark detection. This means that the weighted features allow us to find correspondences with high repeatability because they were easy to find from a set of images captured at different viewpoints. In addition, the processing time to find landmarks with a weighted coefficient was 23.89 s for 100 frames. On the other hand, the same process using all feature points required 26.06 s, which is a reduction of 8.33 %.
As can be seen in Fig. 11, the average number of cor-respondences tended to be large when the feature points had large weight coefficient G. This graph shows that the proposed approach allows us to find quality landmarks using the weight coefficient, e.g., G greater than 5.0
a
b c
d e f
Fig. 5 Landmark selection results. Numbers in columns 2 to 12 show the number of times of correct correspondence. (Ave. and Std. are calculated for each landmark)
Fig. 6 Serial number of landmark/local feature region vs. variation coefficient by method (a). There are nearly no quality difference between the selected landmarks and the local feature region
Fig. 7 Serial number of landmark/local feature region vs. variation
coefficient by method (b). Compared with Fig. 6, there is no
statistically guarantees quality landmarks. This value can be predefined; thus, quality landmark selection can be automatically achieved. The same trend can be observed from the relation between the weight coefficient and the variation coefficient (Fig. 12). A greater weight coefficient results in a landmark with a lower variation coefficient.
Other feature descriptors
A SIFT descriptor is robust against changes in scale, rota-tion, translarota-tion, and illumination because these char-acteristics are suitable for mobile robots. In addition, we can find other excellent descriptors with equivalent characteristics. A feature descriptor that provides scale and direction information is applicable to the proposed method; therefore, we attempted to replace SIFT with another feature descriptor.
Here, there are two primary steps to extract an image feature point: feature point detection and feature descrip-tion. Speeded-Up Robust Features (SURF) [22] are well-known approximations of SIFT features. To detect SURF keypoints, a box filter was applied to calculate the scale-space extremum. Note that the density of the extremum Fig. 8 Landmark detection differences. One large region was
extracted; however, it was divided into two regions in another view-point. This caused misdetection of the landmark
Fig. 9 Serial number of landmark vs. variation coefficient. Features with the weight coefficient show small variation coefficient. This means that the criterion for defining the weight coefficient is useful for selecting a high visibility landmark
Fig. 10 Serial number of landmark vs. average number of cor-respondence. Features with a weighted coefficient yield stable landmark detection
Fig. 11 Weight coefficient vs. average number of correspondence. For example, landmarks with G greater than 5.0 statistically guaran-tees its quality
tends to become sparse; thus, it may show poorer perfor-mance than SIFT because the proposed method requires densely extracted keypoints. This assumption was experi-mentally confirmed using the abovementioned images. We set a smaller lc, and this blurred the line between a landmark and other feature regions.
As another proof, feature description using FREAK [17] was also examined. Here, to generate a local feature region, the parameters were the same as those described in "Quality landmark selection". The FREAK descriptor was applied to each feature point extracted by the SIFT method. Figures 13 and 14 show the results obtained by method (c). The significance of the landmark quality was lesser than that of SIFT. Although the basic tendency was the same, i.e., a small coefficient variance was found by
using feature regions with weight coefficient gj, the SIFT
feature showed better performance compared with the proposed method.
Conclusion
In this study, we have proposed a method for visual land-mark selection from image streams captured by a cam-era mounted on a mobile robot. Using a visual landmark consisting of dozens of neighboring feature points, two evaluation criteria were considered: distinctiveness and repeatability. To evaluate visibility, distinctiveness was evaluated for each image. Then, under the assumption that robots can seek a feasible landmark actively, the repeatability of the landmark was evaluated. Experiments using real images demonstrated that weighting each fea-ture point included in a local feafea-ture region is important to describe a landmark with high distinctiveness and repeatability.
In the future, we will examine automatic threshold determination. The existing method required a manu-ally defined threshold; therefore, this burden should be reduced. Application to mobile robot is also important orientation.
Authors’ contributions
KY proposed the visual landmark method. MS improved the method, and car-ried out experiments. Both authors read and approved the final manuscript.
Acknowledgements
This work was partly funded by ImPACT Program of the Council for Science, Technology and Innovation (Cabinet Office, Government of Japan).
Competing interests
The authors declare that they have no competing interests.
Received: 8 April 2015 Accepted: 25 September 2015
References
1. Betke M, Gurvis L (1997) Mobile robot localization using landmarks. IEEE Trans Robot Autom 13(2):251–263
2. Thrun S, Fox D, Burgard W, Dellaert F (2000) Robust Monte Carlo localiza-tion for mobile robots. J Artif Intell 128(1–2):99–141
3. Matsumoto Y, Inaba M, Inoue H (1996) Visual navigation using view-sequenced route representation. In: Proceedings of International Confer-ence on Robotics and Automation, pp 83–88
4. Kaneko Y, Miura J (2011) View Sequence Generation for View-Based Outdoor Navigation. In: Proceedings of 1st Asian Conference on Pattern Recognition, pp 139–144
5. Celaya E, Albarral J, Jimenez P, Torras C (2007) Natural landmark detection for visually-guided robot navigation. Artif Intell Hum Oriented Comput 4733–2007:555–566
6. Cummins M, Newman P (2008) FAB-MAP: Probabilistic localization and mapping in the space of appearance. Int J Robot Res 27(6):647–665 7. Sato T, Nishiumi Y, Susuki M, Nakagawa T, Yokoya N (2008) Camera
posi-tion and posture estimaposi-tion from a still image using feature landmark database. In: Proceedings of International Conference on Instrumenta-tion, Control and Information Technology, pp 1514–1519
Fig. 13 Serial number of landmark vs. variation coefficient. Landmark distinctiveness is less than that of SIFT. However, the basic tendency was the same
8. Se S, Lowe D, Little J (2001) Local and Global Localization for Mobile Robots using Visual Landmarks. In: Proceedings of International Confer-ence on Intelligent Robots and Systems, pp 414–420
9. Ogawa Y, Shirai Y, Shimada N (2007) Environmental map-ping for mobile robot by tracking SIFT feature Points using trinocular vision. In: SICE, Annual Conference. IEEE, Takamatsu, pp 1996–2001
10. Thompson S, Matsui T, Zelinsky A (2000) Localisation using Automatically Selected Landmarks from Panoramic Images. In: Proceedings of Austral-ian Conference on Robotics and Automation, pp 167–172
11. Knopp J, Sivic J, Pajadla T (2010) Avoiding confusing features in place recognition. In: Proceedings of 11th European Conference on Computer Vision, pp 671–748
12. Hafez A, Singh M, Krishna K, Jawahar C (2013) Visual Localization in Highly Crowded Urban Environments. In: Proceedings of IEEE/RSJ Conference on Intelligent Robots and Systems, pp 2778–2783
13. Hayet JB, Lerasle F, Devy M (2007) A visual landmark framework for mobile robot navigation. J Image Vis Comput 25(8):1341–1351 14. Mata M, Armingol JM, de la Escalera A, Salichs MA (2002) Learning visual
landmarks for mobile robot navigation. In: 15th Triennial World Congress 15. Lowe D (2004) Distinctive image features from scale-invariant keypoints.
Int J Comput Vis 60(2):91–110
16. Tuytelaars T, Gool LV (2004) Matching widely separated views based on affine invariant regions. Int J Comput Vis 50(1):61–85
17. Alahi RO, Vandergheynst P (2012) FREAK: Fast Retina Keypoint. In: IEEE Conference on Computer Vision and Pattern Recognition
18. Piccinini P, Prati A, Cucchiara R (2012) Real-time object detection and localization with SIFT-based clustering. J Image Vis Comput 30:573–587 19. Leibe B, Leonardis A, Schiele B (2006) An Implicit Shape Model for Com-bined Object Categorization and Segmentation. Toward Category-Level Object Recognition, Lecture Notes in Computer Science, vol 4170, pp 508–524
20. Ihara A, Fujiyoshi H, Takagi M, Kumon H, Tamatsu Y (2009) Improved Matching Accuracy in Traffic Sign Recognition by Using Different Feature Subspaces. In: Proceedings of International Conference on Machine Vision Applications, pp 130–133
21. http://t-frog.com/en/. (19/12/2014)