R E S E A R C H
Open Access
Integrating beneficiaries into assessment of
ecosystem services from managed forests
at the Hubbard Brook Experimental Forest,
USA
Jesse Caputo
1*, Colin M. Beier
1, Valerie A. Luzadis
1and Peter M. Groffman
2Abstract
Background:Forests contribute to human wellbeing through the provision of important ecosystem services. Methods:In this study, we investigated how the perceived importance of ecosystem services may impact the overall benefit provided by managed watersheds at the Hubbard Brook Experimental Forest over a 45-year period, using standardized measures of service capacity weighted by service importance weights derived from a survey of beneficiaries. Results:The capacity of watersheds to regulate water flow and quality was high in all watersheds throughout the study period, whereas cultural services such as scenic beauty declined after harvest. Impacts on greenhouse gas regulation depended on the efficiency with which harvested biomass was used. Surveys revealed that stakeholders placed high value on all ecosystem services, with regulating and cultural services seen as more important than provisioning services. When service metrics were weighted by survey responses and aggregated into a single measure, total service provision followed the same overall trend as greenhouse gas regulation. Where biomass use was less efficient in terms of greenhouse gas emissions, harvesting resulted in an overall“ecosystem service debt”; where use was more efficient, this “ecosystem service debt”was reduced. Beneficiaries’educational backgrounds significantly affected overall assessment of service provision. Beneficiaries with college or university degrees incurred smaller“ecosystem service debts”and were less negatively affected by harvesting overall.
Conclusions:This study highlights the importance of including empirical measures of beneficiary preference when attempting to quantify overall provision of ecosystem services to human beneficiaries over time.
Keywords:Ecosystem services, Forests, Long-term ecological research, Hubbard Brook Experimental Forest, Regulating services
Background
Ecosystem services, broadly defined as the“benefits people re-ceive from nature”(Millenium Ecosystem Assessment 2005), have become the focus of an increasing number of studies ex-ploring the relationship between human society and complex social-ecological systems (Braat 2012; Molnar and Kubis-zewski 2012). Although it is only one of the many rich and il-luminating“ways of knowing”that the ecological sciences can bring to bear on this topic (Norgaard 2010), the ecosystem
services paradigm provides an intuitive and straightforward lens through which to investigate the role of ecosystems in improving and maintaining human welfare. As conceptual-ized in the Millenium Ecosystem Assessment (2005), ecosys-tem services consist of a wide variety of services that provide people with material goods (provisioning services), regu-late aspects of the human environment (regulating ser-vices) or connect people with their environment and their community (cultural services). Supporting services indir-ectly benefit people by underpinning these other services.
Using an economic metaphor, the extent to which so-ciety benefits from an ecosystem is driven jointly by the ecosystem’s capacity to “supply” services and the use of * Correspondence:[email protected]
1SUNY College of Environmental Science and Forestry, Department of Forest
and Natural Resources Management, Syracuse, NY 13210, USA Full list of author information is available at the end of the article
or “demand” for those services by beneficiaries (López-Hoffman et al. 2014; Beier et al. 2015). The capacity of an ecosystem is the extent to which that system is cap-able of sustaining the processes that underlie potential services, regardless of how much or how little of those services are currently used by beneficiaries. These pro-cesses become services when and only when they begin to contribute (directly or indirectly) to human well-being (Bagstad et al. 2014), in other words, when they are“used”by beneficiaries. Without knowing the relative importance of those services to beneficiaries, however, we can have only very limited understanding of the cumulative impact of those services on well-being, or of tradeoffs or synergies among services in terms of total utility.
Among several methods available for understanding the relative importance of services to beneficiaries, mon-etary valuation is the most established (TEEB 2010). Valuation reduces the value of services to units of currency, which by definition serve as measures of the relative partial utility of each those services to con-sumers. There are a number of problems associated with monetary valuation, however, particularly for ecosystem services for which there are no functioning markets. Al-though several methods exist to attach monetary value to non-market benefits, these are all estimates poten-tially subject to significant error (see Farber et al. 2002).
Furthermore, several authors have examined how monetary valuation has the potential to obscure the eco-logical processes and intermediate services (supporting and regulating) that ultimately make final ecosystem services possible (Norgaard 2010; Peterson et al. 2010; García-Llorente et al. 2011).
Non-monetary alternatives for ecosystem service valu-ation are also available (Farber et al. 2002). Surveys, in-terviews, and workshops have been used to help understand how beneficiaries perceive ecosystem vices as well as the value that people place on those ser-vices (García-Llorente et al. 2011; Asah et al. 2012; Martín-López et al. 2012; Vihervaara et al. 2012; Gould et al. 2014; Kaye-Zwiebel and King 2014; Muhamad et al. 2014). Additional research has shown that demo-graphics (e.g. Kari and Korhonen-Kurki 2013), social and political influence (e.g. García-Nieto et al. 2015), and economic position (e.g. Díaz et al. 2011) all help to de-termine the value that individual beneficiaries attach to particular ecosystem services.
Ecosystems provide multiple ecosystem services to people. Consequently, there are tradeoffs inherent in an ecosystem’s biophysical capacity to supply those services simultaneously (Bennett et al. 2009; Reed et al. 2013; Renard et al. 2015; Caputo et al. 2016), and, whenever those services are valued differently by different seg-ments of the population, it becomes impossible to
maximize the welfare of all beneficiaries at once and therefore difficult to make management decisions that are equitable. Quantified measures of relative service im-portance have the potential to greatly improve efforts to prioritize or select among different management deci-sions with differing ecosystem service outcomes. For ex-ample, Schwenk et al. (2012) demonstrated the use of importance weighting within a multi-criteria analysis (MCA) framework to assess the performance of several forest harvest systems in terms of three different ecosys-tem services: timber production, greenhouse gas mitiga-tion, and biodiversity. A range of importance values was adopted for each service, and selection of these values largely dictated which of the forest harvest systems best optimized the overall utility function. Although the im-portance values themselves were hypothetical, Schwenk et al.’s (2012) methods could easily be adapted to incorp-orate empirically-derived measures of service import-ance into efforts to compare possible future outcomes in terms of multiple services and multiple beneficiary groups. Schwenk et al.’s (2012) study–like most imple-mentations of MCA (e.g. Buchholz et al. 2009) – are aimed at making an optimal decision at a single point in time. The relationships among individual ecosystem ser-vices, however, as well as the capacity of ecosystems’to provide multiple services, change over time (Renard et al. 2015). The use of empirical measures of ecosystem service value to parameterize an MCA over multiple years– the focus of the current investigation–is a sig-nificant step forward in understanding how management decisions influence tradeoffs among ecosystem service benefits to different social groups over ecologically-relevant time periods.
MCA aimed at understanding which forest management and wood utilization practices have the potential to optimize service provision to different segments of the beneficiary population. Our objectives in this study were to 1) demonstrate how beneficiary surveys may be used to es-timate non-monetary service values suitable for use in MCA, and 2) illustrate how ecosystem capacity to produce services may change over time in response to management, climate, and other forcing factors, and how that change will determine which management practices (including wood utilization practices) optimize potential benefit flows.
Methods
Site
The Hubbard Brook Experimental Forest, located in Grafton County, New Hampshire, USA is the home of the Hubbard Brook Ecosystem Study, which was initi-ated in 1955 in order to study the impacts of forest man-agement on hydrology in the northern forest and is a metric of the U.S. National Science Foundation funded Long Term Ecological Research (LTER) network. The site covers 3,160 ha and includes nine gauged first-order catchments that range from 22 to 1,015 m above sea level. Soils are predominantly sandy loams derived from glacial basal till (Typic Haplorthods). Mean precipitation is 1,400 mm. Mean temperature ranges from −9 °C in January to 18 ° C in July. Vegetation is typical of the northern hardwoods forest type, with deciduous hard-woods such as sugar maple (Acer saccharum Marshall), yellow birch (Betula alleghaniensis Britton), and white ash (Fraxinus americana L.) being most common (Campbell et al. 2007).
Of the nine gauged watersheds studied at Hubbard Brook, three watersheds were included in this study. Watershed 4 (WS 4) was harvested using a strip clearcut system; except for streamside buffers, the entire catch-ment was harvested in sequential 25-m strips in 1970, 1972, and 1974. Watershed 5 (WS 5) was subject to a whole-tree harvest in late 1983. Watershed 6 (WS 6) was left as an untreated reference (Bailey et al. 2003). All watersheds are situated within the larger Pemigewassett River Watershed. Data span from 1963 to 2007.
Quantification of ecosystem services
We selected three regulating services (water flow regula-tion, water quality regularegula-tion, and greenhouse gas regu-lation) and one cultural service (aesthetics) to quantify at Hubbard Brook based on data availability as well as importance to local beneficiaries. We also quantified the provisioning services associated with the harvest of wood fiber as a source of building material and energy feedstocks. Among these broad service categories, we quantified nine different service metrics.
Water flow regulation (WFR) consists of two metrics, flood prevention and drought mitigation. Flood preven-tion is defined as the proporpreven-tion of measurement days in which daily streamflow remains below a high flow threshold. We calculated this threshold by taking the maximum daily capacity of the flood control structure (m2° day−1) at the outlet of the Pemigewassett River Watershed and divided it by the watershed area. The quotient of these two values represents the maximum average drainage per unit area achievable before dam capacity is exceeded. The second metric, drought mitiga-tion, is similarly defined as the proportion of days in which daily streamflow falls below a low flow threshold. The low flow threshold was calculated by taking histor-ical demand for surface water in Grafton County (as re-corded by the U.S. Geological Survey) and dividing by the total area of the county.
Water quality regulation (WQR) consists of four met-rics, regulation of nitrate, chloride, sulfate, and pH. Each of these metrics is defined as the proportion of measure-ments in which the pollutant concentration remains within legal drinking water standards. Thresholds for ni-trate and chloride were taken from New Hampshire drinking water standards. Thresholds for sulfate and pH were taken from U.S. federal secondary standards.
Aesthetics (SCB) is a cultural service that has been identified as being of primary importance in the region (e.g. Butler 2008). We quantified a single metric for this service, scenic beauty, choosing to use standing woody biomass as a proxy for this metric. Although a more in-clusive metric for this service might include landscape structures, non-woody vegetation, measures of structural diversity, etc., we were limited in our data. Our choice to use stand biomass as a proxy for scenic beauty is based on earlier research showing a relationship between aes-thetic preferences and related measures: basal area, tree density, and tree size (Hoffman and Palmer 1996; Ribe 2009). Standing biomass was calculated directly from forest inventory data.
harvested biomass was utilized and 30 % was left as log-ging residue (Lippke et al. 2011b). Because beneficiaries might value the provision of biomass differently based on the perceived utility of the end use of that biomass, we assessed three different scenarios based on the rela-tive proportion of biomass going to long-lived wood products (LLWP) vs energy production (specifically cellulosic ethanol): 100 % LLWP, 50 % LLWP + 50 % ethanol, & 100 % ethanol.
Lastly, we assessed aboveground carbon mitigation as a metric of greenhouse gas regulation (GHGR). Above-ground carbon mitigation was defined as the sum of car-bon storage in aboveground tree biomass as well as a carbon-use benefit associated with the harvest and use of renewable wood products. Carbon storage in tree bio-mass was calculated by multiplying standing biobio-mass by the carbon ratio 0.498:1 (Birdsey 1992). The carbon use benefit was estimated using the methodology described by Lippke et al. (2011b) as a sum of three terms: product storage, product substitution, and carbon emissions as-sociated with harvesting. Product storage refers to car-bon stored in LLWP when wood is harvested and used for building materials, furniture, etc. This carbon is released back to the atmosphere slowly as LLWP are re-tired and eventually decompose. When harvested bio-mass is used as an energy feedstock, on the other hand, carbon stored in the biomass is released into the atmos-phere almost immediately. Product substitution is the benefit resulting from the use of relatively low-carbon renewable products (e.g. wood) in place of carbon inten-sive products (e.g. steel) and fossil fuels. Lippke et al. (2011a, 2012) found the substitution value to be signifi-cantly greater when biomass is used for LLWP as compared to energy feedstocks. It is important to ac-knowledge that the adoption of a product substitution term in this framework assumes that products do in fact substitute for other, more carbon-intensive products. In actuality, however, they might simply be additional to the economy (e.g. if increased availability of bioenergy products reduce overall energy prices, and therefore in-crease total energy demand) or might simply substitute for other products of similar carbon intensity (e.g. LLWP substituting for other LLWP). Finally, carbon emissions associated with harvesting are subtracted from the stor-age and substitution pools in order to come up with the final value of the carbon use benefit. In the current ana-lysis, we calculated the value of the aboveground carbon mitigation metric (aboveground carbon storage + use benefit) for biomass used to produce LLWP as well as cellulosic ethanol (Lippke et al. 2012). In total, six sce-narios were explored, based on the three FP scesce-narios and a binary variable indicating whether or not har-vested biomass was assumed to substitute for fossil in-tensive products. In order to estimate product storage,
we assumed that carbon in biomass harvested and uti-lized for LLWP formed a carbon pool with an 80-year half-life (Perez-Garcia et al. 2005). Because carbon in biofuels is stored for a negligible amount of time, we did not include a product storage term for biomass used to produce ethanol. Substitution benefits were calculated using carbon displacement ratios–or the estimated car-bon savings for every unit of carcar-bon in biomass utilized in place of carbon- intensive alternatives. We selected average carbon displacement ratios of 2.1:1 for LLWP and 0.38:1 for cellulosic ethanol (produced via gasifica-tion) from Lippke et al. (2012). These values were calcu-lated using life-cycle assessment (LCA) modeling of conventional practices. Carbon emissions from logging operations were assumed to be equivalent to 6 % of the carbon contained in the pre-harvest stand at a site (Lippke et al. 2011b). The final value of the aboveground carbon mitigation metric at a given point in time was calculated by taking the sum of the aboveground biomass and LLWP carbon pools at that point in time, adding total cumulative avoided emissions (i.e. product substitution benefits), and then subtracting total cumula-tive emissions from management and logging.
All service metrics were assessed on a [0, 1] scale. WFR and WQR metrics were originally calculated on this scale. The values for standing biomass (scenic beauty) and aboveground carbon mitigation were rescaled by dividing by the maximum values for these metrics as calculated for all three watersheds in all six scenarios. The value for the biomass harvest metric was also rescaled by dividing by the maximum value of standing biomass, as this value rep-resents the maximum quantity of fiber that could have been harvested and utilized.
regarding either the total capacity of the system to pro-vide services or the actual benefit flows to beneficiaries (Beier et al. 2015).
The service metrics adopted here have been estab-lished as part of the Forest Ecosystem Services Toolkit (FEST); more information on methods, metrics, and datasets can be found on the FEST website at www.for-estecoservices.net and in Beier et al. (2015) and Caputo et al. (2016).
Survey of beneficiaries
In order to determine the relative importance attached to ecosystem services by beneficiaries in the vicinity of Hubbard Brook, we distributed an internet questionnaire to a random selection of residents in Grafton County using a mixed-mode implementation design (Babbie 1990; Dillman 2000). The intended sample population was the general adult population (>18 years old) of the county. In order to represent this population, we ob-tained the names and addresses of 1,000 randomly se-lected adult residents of the county from a commercial vendor. Invitation letters were mailed to each of these potential participants in July 2013. The letter explained the study, provided the recipient with a unique identifi-cation number, and invited them to take part in an inter-net survey. Over the subsequent two months, two additional follow-up letters were sent to those who did not respond to the initial letter.
The invitation letter provided two means of accessing the survey, either by entering the web address printed in the letter into an internet browser or by scanning a QR code printed in the letter with a cellular phone or web-equipped mobile device. Either would redirect the participant to an online questionnaire hosted through SurveyMonkey – a commercial platform for internet surveys (SurveyMonkey 2014). The use of a mixed-mode format in which mailed invitation letters were used in order to direct respondents to an internet survey was intended as a means of addressing the problems associ-ated with the use of email as a means of making initial contact with a representative sample of the general population (Dillman 2000; Sexton et al. 2011).
The survey instrument consisted of a consent form and a questionnaire containing 17 single and multi-part questions, intended to elicit the respondents’perceptions regarding the importance of a number of ecosystem ser-vices and service metrics. Several demographic questions were included and respondents could make additional open-form comments on any aspect of the survey. Three multi-part questions provided the primary data used in the current study (see Additional file 1). One question asked respondents to rate the importance of a general-ized list of ecosystem services to his/her household on a scale from 1 (“NOT IMPORTANT AT ALL”) to 6
(“EXTREMELY IMPORTANT”). Six of these were ana-lyzed in this study; water flow regulation, water quality regulation, greenhouse gas regulation, scenic beauty, provision of timber products, and provision of firewood and other energy feedstocks. Two additional questions asked respondents to rate the importance of several met-rics of water flow regulation (flood prevention and drought prevention) and water quality regulation (water that is safe to drink; and water that smells and tastes good) to their families on the same [1,6] scale.
We used linear mixed effects modeling to determine the relationship between the demographic variables and perceived importance attached by respondents to ser-vices and service metrics. Linear mixed effects modeling is appropriate where independent variables contain both fixed and random variables (Schabenberger and Pierce 2002). We treated the individual respondent as a ran-dom variable and service metric and demographic fac-tors as fixed variables. Perceived importance values were used as the dependant variables. All data analysis for this and subsequent sections was done using R (R Core Team 2013), using core functions as well as the libraries “lmerTest” (Kuznetsova et al. 2014) and “multcomp” (Hothorn et al. 2008).
The choice to use the county boundaries to define beneficiaries reflects a compromise decision based on methodological convenience. In truth, the scale at which ecosystems confer benefits depends on characteristics of the ecosystem, the social system with which it is associ-ated, and the nature of the benefits themselves. For ex-ample, the service of greenhouse gas mitigation arguably provides benefits at a global scale, whereas watershed benefits may only be relevant to those beneficiaries liv-ing within the portion of the county that intersects the Pemigewassett River Watershed. Moreover, services such as fiber provision and scenic beauty may confer benefits on a local to regional scale. Without extensive economic and sociological research into each of these services in-dividually, it is not possible to accurately identify the correct beneficiary sphere.
Thus, we opted to use the county boundary as a con-venient compromise between local and regional scales.
Composite service index
the potential aggregate provision of all services, where a value of 0 means that the ecosystem has no capacity to provide valued services and a value of 9 means that the system has sufficient capacity to meet demand for all services and that all services are perceived by beneficiar-ies as being‘Extremely Important’.
IN¼ðHWHWFÞ þðLWLWFÞ þ NWSWQ
þ CWAWQ
þ SWAWQ
þ PWAWQ
þðBWSCÞ
þððCBWGÞ þðCLWGÞÞ
þððRBWRBÞ þðRLWRLÞÞ ð1Þ
where:
IN = composite service index H= flood prevention
WH= weight, flood prevention
WF= weight, flow regulation
L= drought mitigation
WL= weight, drought mitigation
N= nitrate regulation
WS= weight, safety of drinking water
WQ= weight, water quality regulation
C= chloride regulation
WA= weight, taste and smell of drinking water
S= sulfate regulation P= pH regulation B= standing biomass
WSC= weight, scenic and aesthetic benefits
CB = carbon benefits of using biomass for energy production
CL = carbon benefits of using long-lived wood products WG= weight, greenhouse gas regulation
RB = cumulative removals of biomass for energy production
WRB= weight, bioenergy production
RL = cumulative removals of biomass for long-lived wood products
WRL= weight, long-lived wood products
Results and discussion
Quantification of ecosystem services
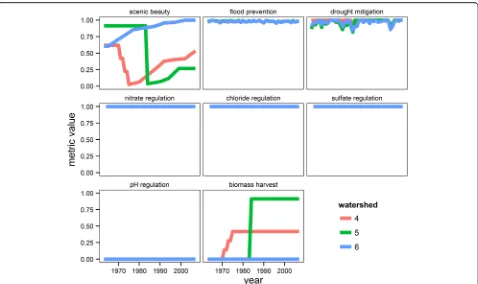
Like Renard et al. (2015), we found that the biophysical capacity of the system to provide ecosystem services – and the tradeoffs among those services – changed over time. Flow regulation and water quality regulation ser-vices remained stable throughout the study period (Fig. 1), and did not vary meaningfully between the har-vested watersheds (WS 4 and 5) and the reference water-shed (WS 6). Although there were detectable effects of harvesting on stream discharge and water chemistry,
these changes rarely, if ever, exceeded the thresholds used to define service provision. The scaled value of flood regulation remains above 0.95, for example (i.e., less than 4 % of streamflow measurements exceeded the high flow threshold). The drought mitigation metric scored lower but never dropped below 0.81. WQR met-rics were less variable (Fig. 1) over the same period. Thresholds for nitrate, sulfate, and chloride were never exceeded (resulting in service metric values = 1.0), while standards for pH were never achieved (values always equal 0) in any of the watersheds. Earlier research also found no tradeoffs between WQR metrics and other ser-vices (Beier et al. 2015; Caputo et al. 2016).
In contrast to the water regulation services, fiber provision (biomass removals) and scenic beauty changed notably over time. In WS 6, the estimated value of scenic beauty increased from 0.84 to 1.0 as standing biomass continued to aggrade over time. In WS 4 and WS 5, there was a clear–and unsurprising–tradeoff between biomass removals and scenic beauty. In both watersheds, scenic beauty dropped to nearly zero after harvest and then began to increase once again as forest vegetation recovered. The value of the biomass removal metric was nearly twice as high in WS 5 after harvest as compared to WS 4, both because WS 5 started with a higher level of standing biomass and because all harvested trees were removed and utilized as end products.
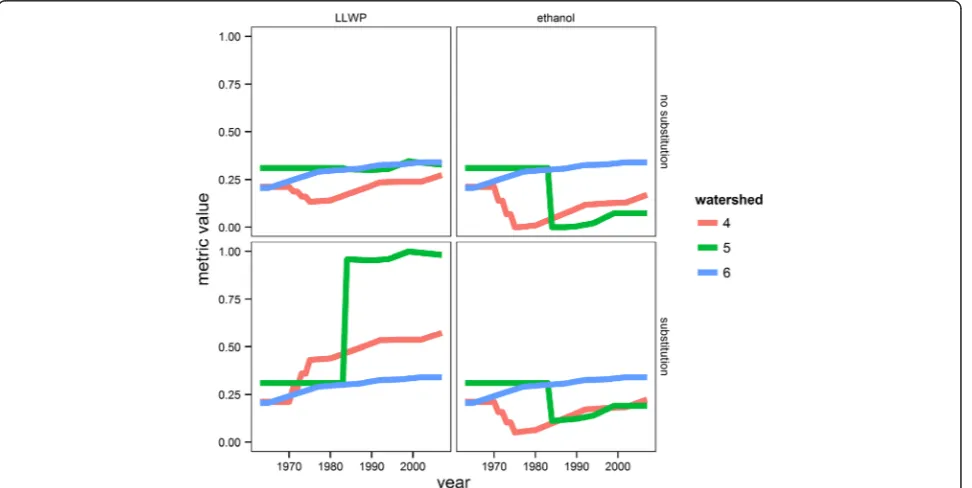
Aboveground carbon mitigation (Fig. 2) increased gradually over time in WS 6. Since WS 6 was never harvested, this was solely a result of increased carbon storage in the aggrading stand. In WS 4 and WS 5, which had been harvested, the trend in this metric was determined largely by the end use of the har-vested biomass (LLWD or ethanol) and whether or not it was used as a substitute for more carbon inten-sive products.
When biomass was used to produce ethanol (assuming no substitution), a clear tradeoff between biomass harvest and short-term greenhouse gas mitigation emerged. This is due to the fact that ethanol is stored for only a negli-gible amount of time before it is consumed and the car-bon it contains is returned to the atmosphere. Several studies have highlighted the emergence of such a“carbon debt” after harvesting forests for the production of bioenergy (Fargione et al. 2008; Mika and Keeton 2013). It is important to consider, however, that as for-est vegetation recovers after harvfor-est, stand carbon is expected to eventually return to pre-harvest levels and stand-level carbon neutrality will be attained (Lippke et al. 2011a; Walker et al. 2013).
When harvested biomass was used to produce LLWP instead of ethanol (still assuming no substitution), the tradeoff between biomass harvest and carbon mitigation lessened or disappeared. In WS 4, where 30 % of felled
biomass was left as residue to decompose, there was a small drop in the overall aboveground carbon mitigation metric. Within 20 years, however, regrowth of the stand returned this metric to pre-harvest levels. In WS 5, where harvested materials were 100 % utilized, all carbon harvested was immediately transferred to the long-term product storage pool and no “carbon debt” was incurred.
Assuming that harvested biomass would substitute for fossil-intensive products increased the value of the car-bon mitigation metric in stands WS 4 and WS 5. This increase was small in the case of ethanol: only 0.38 units of fossil carbon are avoided for every 1 unit of carbon in ethanol substituting for petroleum fuels (Lippke et al. 2012). In this case, the carbon benefits of product substi-tution were insufficient to compensate for the loss of carbon during harvest and WS 4 and WS 5 still incurred a “carbon debt”. The magnitude of this debt was less than in the case where no substitution was assumed, however. Comparatively, the use of LLWP in place of fossil-intensive substitutes (steel, concrete, etc.) results in much larger quantities of avoided carbon: 2.1 units for every 1 unit in the biomass itself (Lippke et al. 2012). Because the carbon displacement ratio in this case is greater than 1:1 (i.e. the loss of carbon due to harvesting biomass is less than the benefits gained by producing and using LLWP), the carbon mitigation metric actually increased after harvest. In WS 5, the scaled value for this metric increased from 0.31 to 0.96 in the harvest year. In WS 4, where less than half as much biomass was re-moved, the value increased from 0.21 in the year before harvest to 0.43 after the third harvest was completed. In both stands, aboveground carbon continued to increase after harvest as biomass regenerated and stand carbon recovered.
Survey of beneficiaries
Of the 1,000 invitations distributed to Grafton County residents, 51 unique complete or partial surveys were submitted and 131 invitations could not be delivered, for an adjusted response rate of 5.9 %. This response rate is low compared with reported average response rates for internet surveys; however, decreased response rates for internet surveys have been found when mail is used as the solicitation medium as well as when surveys are di-rected at the general population (Manfreda et al. 2008).
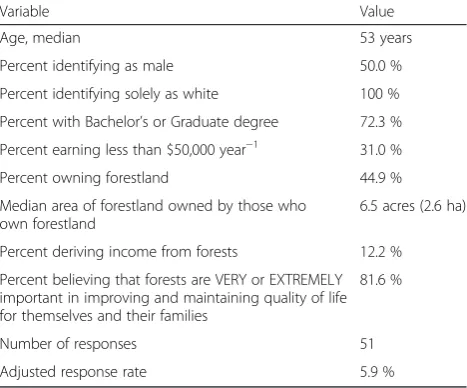
The median respondent was 53 years old, likely to have a bachelor’s or graduate degree (72.3 %), and likely to be earning more than $50,000 a year (69.0 %) – the approximate median U.S. income (Table 1). The num-bers of female and male respondents were equal. All re-spondents identified themselves as exclusively white in racial makeup. Values for gender and race (% white) were within 10 % of the reported census values for these
counties. However, survey respondents reported being older, wealthier, and with more formal education than the county as a whole (U.S. Census Bureau 2000; 2010; 2014). Given the low response rate and indicators of likely non-response bias, our results should not be inter-preted as a characterization of the full population of the surveyed county (responses represent < 0.01 % of county residents). However, the results remain useful in that they demonstrate a methodology for deriving measures of ecosystem service importance directly from a benefi-ciary population.
Nearly half of survey respondents (44.9 %) own forest land, and the median size of these parcels was 6.5 acres (2.6 ha). The relatively small size of individual holdings support what is known about forest holdings in this re-gion: the median size of individual parcels is less than 10 acres (4.0 ha) in New Hampshire (Butler 2008). Only a small number of respondents reported deriving income from forests (12.2 %), although 81.6 % of respondents declared a belief that forests are either very or extremely important in “improving and maintaining quality of life” for themselves and for their immediate families. The perception that forests provide important services that improve quality of life without providing any income may partially explain the findings of Butler and Leather-berry (2004), which indicated that most forest land-owners in this region have primarily non-market objectives for their land. 21 of the 51 respondents live within the Pemigewassett River Watershed, and we found no significant difference (at the α= 0.10 signifi-cance level) between those respondents and respondents living outside the watershed in terms of the importance they attached to individual ecosystem services (p= 0.35). Table 1Summary of demographic and response data from a survey pertaining to perceived importance of forest ecosystem services in Grafton County, NH, USA
Variable Value
Age, median 53 years
Percent identifying as male 50.0 %
Percent identifying solely as white 100 %
Percent with Bachelor’s or Graduate degree 72.3 %
Percent earning less than $50,000 year−1 31.0 %
Percent owning forestland 44.9 %
Median area of forestland owned by those who own forestland
6.5 acres (2.6 ha)
Percent deriving income from forests 12.2 %
Percent believing that forests are VERY or EXTREMELY important in improving and maintaining quality of life for themselves and their families
81.6 %
Number of responses 51
Overall, respondents attached relatively high importance to all services. The median importance value among indi-vidual ecosystem services was a 5 (“VERY IMPORT-ANT”). Linear mixed effects modeling results indicated that significant variation in importance value (at the α= 0.10 significance level) was explained by the type of service (p< 0.0001) and the respondent’s educational background (p= 0.0701). Among services, the regulating and cultural services were perceived as being of greater importance than provisioning services; provision of timber and energy feedstocks were each seen as being significantly less im-portant than each of the other services (with the exception of flood regulation). This may be due to the fact that re-spondents were relatively wealthy by national and global standards and, although many owned forest land, few derived any income from that land. A number of studies have suggested that poor and/or rural individuals dependent on natural resources as a source of income are more likely to perceive and value provisioning services (Kari and Korhonen-Kurki 2013; Muhamad et al. 2014) whereas wealthier, urbanized individuals are more likely to perceive and value regulating and supporting services (Martín-López et al. 2012). Among services in these cat-egories, respondents in our study attached significantly less importance to flood prevention than all others. This may be because flood prevention is less visible and intuitive than more tangible benefits such as clean water, wood, or scenic beauty. Alternatively, it may be because a large proportion of respondents be-lieve that they live outside of a flood zone and there-fore that this benefit is irrelevant to them.
The educational background factor included three levels referencing a respondent’s highest level of higher education–no college or university degree, a bachelor’s
or associate’s degree, or a graduate degree. Respondents with a greater level of education generally attached greater importance to ecosystem services compared to those with less education. However, this difference was only significant at the α= 0.10 significance level be-tween graduate degree- holders and those without a degree (p= 0.0637). Education may increase benefi-ciaries’ perception and valuation of ecosystem benefits either because that premise is imparted directly as part of curricula, or because formal education improves the ab-stract thinking skills necessary for perceiving the roles of many invisible, intangible supporting and regulating ser-vices in improving human welfare (García-Llorente et al. 2011). Unfortunately, the exact nature of the relationship between education and perception of ecosystem services is not well studied, and other studies have found unclear and inconsistent relationships (e.g. Muhamad et al. 2014).
Since educational background had a statistically signifi-cant effect on respondents’perception of the importance of ecosystem services, we decided to calculate separate sets of preference weights for each of the three levels of this factor. We did this by taking the mean of the relevant survey items (1–7 Likert scale) for all respondents within each group and rescaling them on a [0, 1] scale.
Composite service index
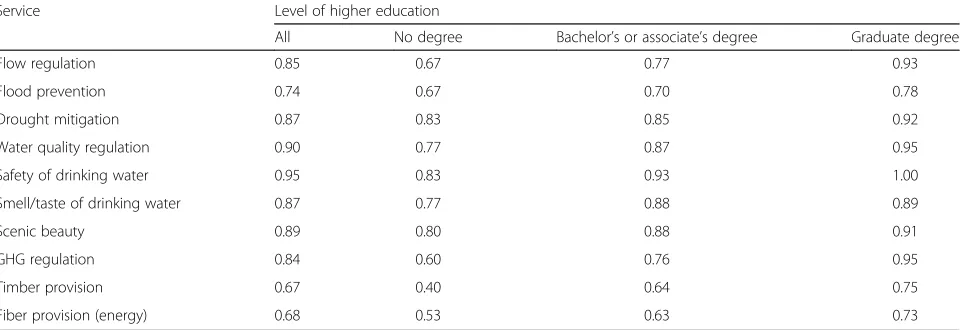
The overall preference weights ranged from 0.67 (energy/ timber) to 0.95 (safety of drinking water). Within the three educational groups, weights ranged from 0.50 (timber, no degree) to 1.0 (safety of drinking water, graduate degree). In all cases, the importance weights were larger for those with a higher level of education (Table 2).
Using the overall preference weights, the values of the composite service index never fell below 4.09 across all
Table 2Forest ecosystem service preference weights (i.e. importance values), derived from a survey of residents in Grafton County, NH, USA
Service Level of higher education
All No degree Bachelor’s or associate’s degree Graduate degree
Flow regulation 0.85 0.67 0.77 0.93
Flood prevention 0.74 0.67 0.70 0.78
Drought mitigation 0.87 0.83 0.85 0.92
Water quality regulation 0.90 0.77 0.87 0.95
Safety of drinking water 0.95 0.83 0.93 1.00
Smell/taste of drinking water 0.87 0.77 0.88 0.89
Scenic beauty 0.89 0.80 0.88 0.91
GHG regulation 0.84 0.60 0.76 0.95
Timber provision 0.67 0.40 0.64 0.75
Fiber provision (energy) 0.68 0.53 0.63 0.73
Importance values are calculated for the entire pool of respondents, as well as disaggregated by beneficiaries’level of higher education. A value of 0 corresponds
to a service or metric being perceived by beneficiaries as‘NOT IMPORTANT AT ALL’; a value of 1 corresponds to the service being perceived as being
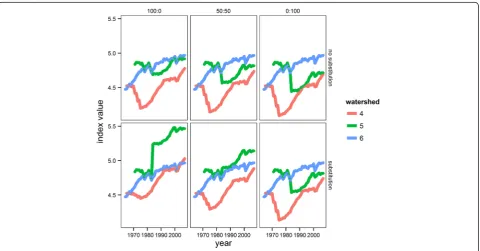
watersheds and scenarios (Fig. 3). In the lowest-scoring scenario (100 % ethanol, no substitution), the value of the index in the reference watershed (WS 6) increased slowly from 4.47 to 4.97 over the 45-year period. In WS 4 and WS 5, index scores declined abruptly after harvest and gradually recovered to approach pre-harvest condi-tions. These temporal changes were driven by changes in scenic beauty, greenhouse gas regulation, and fiber provision, as water flow regulation and water quality ser-vices remained relatively consistent between watersheds and did not respond strongly to harvest (Fig. 1).
As expected, harvesting led to immediate declines in scenic beauty and aboveground carbon mitigation in the 100 % ethanol scenario. The value of the composite index, however, recovered more rapidly than standing biomass. These dynamics emerge because the benefits associated with harvesting biomass for conversion to ethanol–and to a lesser extent the partial carbon bene-fit of using that ethanol in place of fossil fuels–serve to partially mitigate the net loss in service provision associ-ated with harvesting. This reduces the necessary recov-ery time of the composite service index.
Over several harvest rotations, we hypothesize that, al-though values for scenic beauty (standing biomass) and carbon storage in standing trees would oscillate over
time as vegetation grows and is cut, the cumulative posi-tive impact of the fiber harvest and carbon substitution benefits would result in higher overall service provision in harvested watersheds versus the unharvested refer-ence. If true, the temporal pattern associated with this “ecosystem service debt” would be very similar to the patterns associated with“carbon debt”: an initial decline following by a permanent (and increasing) benefit asso-ciated with use of biomass products (e.g. Lippke et al. 2011b; Walker et al. 2013).
The results of the other five scenarios demonstrate that the end use of harvested biomass is instrumental in deter-mining the magnitude of the change after harvest, and the length of the recovery period. In the reference watershed (WS 6), no products were harvested and the composite index was therefore unaffected by the LLWP: ethanol ratio or the substitutability of end products. By definition, the composite index in this watershed remained the same under all six scenarios.
In the harvested WS 4 and WS 5, allocating a larger proportion of biomass to LLWP as well as assuming product substitution both increased the value of the index, similar to the pattern seen for the aboveground carbon mitigation metric alone (Fig. 2). In WS 5, where biomass utilization was highest, only the 100 % ethanol
scenarios resulted in an initial“ecosystem services debt”. If at least 50 % of biomass went into LLWP the whole-tree harvest treatment resulted in an immediate increase in the composite score. In the best-performing scenario (100 % LLWP, substitution), the composite score in WS 5 increased in the year after harvest from 4.73 to 5.23. In all scenarios, WS 4 – where utilization of harvested biomass was less efficient – experienced an “ecosystem services debt” after harvest, with recovery periods ran-ging from a few years (100 % LLWP, substitution) to ap-proximately 20 years (100 % ethanol, no substitution).
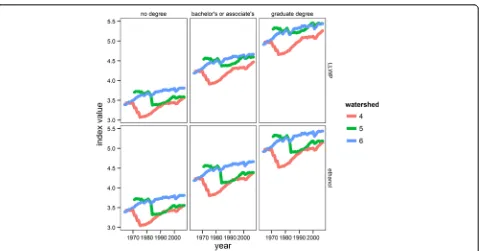
When the composite service index was calculated using a separate set of importance weights for each of the three groupings of the education factor, we see similar patterns; where harvested biomass is utilized for the production of ethanol (and product substitution is not assumed), the index initially declines after harvest and increases as har-vested stands recover biomass and carbon (Fig. 4). At all points in time, however, the index is somewhat higher for those with degrees as degree-holders value ecosystem service metrics more highly overall than those without de-grees (Table 2). Regardless of education however, harvest-ing in WS 4 and WS 5 results in a decline in the value of the index (an “ecosystem service” debt) when harvested
biomass is used for production of ethanol and no substitu-tion is assumed. The value of the index recovers in ~20 years in WS 4, but does not seem to fully recover in WS 5. Instead, the value of the index stabilizes at a lower value than before the harvest.
Where harvested biomass is used for LLWP instead of biofuels, the overall value of the index is higher across all watersheds for all education groups. Whereas those without degrees incur a loss in total ecosystem services after harvest regardless of the end use of the biomass, those with degrees do not always perceive this “ ecosys-tem service debt”. For example, the value of the compos-ite index for those with graduate degrees did not change after the whole-tree harvest in WS 5, where the biomass was utilized for LLWP. Those with bachelors’ degrees, on the other hand, perceived an ecosystem services debt that recovered within a few years; those without degrees did not perceive recovery of the index by the end of study period. When harvested materials are used for LLWP, differences in index values between education groups were larger than when biomass went to ethanol production (Fig. 4). This is true largely because harvest-ing for LLWP provides large GHGR benefits in addition to the value of the wood products themselves (Fig. 2)
and the GHGR service is significantly more highly val-ued among respondents than provision of wood prod-ucts (Table 2). Additionally, the difference in value weights between those with the least education and those with the most education is greater for LLWP as compared to energy productions (a mean difference of 0.35 vs. 0.20). In WS 4, where utilization of biomass for LLWP was less efficient and product removals were un-able to fully compensate for the loss of standing bio-mass, all respondents perceived an ecosystem services debt (and subsequent recovery) during the study period. Regardless of whether harvested biomass went to etha-nol or LLWP, assuming product substitution increased the value of the harvested stands relative to when prod-uct substitution was not assumed.
The calculation of the composite service index can be interpreted as the core step in the MCA process: the high-est value at a given point in time indicates which practices (both silviculture and wood use) provide maximum utility to beneficiaries. At Hubbard Brook, however, the “ opti-mal” practices depend on who the beneficiaries are and whenthe index is calculated (i.e. the point in time being considered). Our results highlight the importance of including both empirical measures of service value and temporal dynamics in efforts to better understand how managed ecosystems benefit people.
It is important to recognize that the composite index we estimated is not complete or exhaustive–it is a spe-cific product of the nine particular service metrics that we were able to quantify. There are many other ecosys-tem services being provided by the forests of New Hampshire and including additional metrics would likely change both the absolute value of the index as well as the ranking among stands and management practices. For example, the greater amount of biomass harvested in WS 5 (and the greater GHGR benefits when that bio-mass was used for LLWP) resulted in this stand often re-ceiving a greater value of the composite service index relative to WS 4. Whole-tree harvesting, however, is known to lead to significant damage to soil and water resources (Lattimore et al. 2013). The buffer strips and residues left in WS 4 resulted in less biomass being re-moved from the stand (which in turn lead to lower pro-visioning and GHGR benefits), but they may also have led to increased provision of other regulating and sup-porting services which were not quantified and therefore not included in the composite index. Inclusion of these benefits would likely have compensated to some extent for the greater provisioning/GHGR services provided by WS 5. This example illustrates the poten-tial sensitivity of MCA (and all benefit aggregation schemes) to exactly which metrics are included in the analysis – particularly when those metrics are highly valued by beneficiaries or are likely to result in
significant tradeoffs with those metrics that have already been included.
One additional caveat regarding the composite index: a primary weakness of this initial study is the temporal scale mismatch between our ecosystem service metrics and the beneficiary values derived from the survey. The service metrics were calculated on an annual basis, from 1963 to 2007, whereas the beneficiary values were calcu-lated from a single survey conducted in 2013. Because we applied these values to each time step in the data series, we made the implicit assumption that beneficiary preferences were static throughout the 45-year period – an assumption that is unlikely to be true. Consequently, the changes we found in the composite service index for a given watershed over time exclusively reflect changes in that watershed’s capacity to provide those services. In reality, changes in potential or actual service flows re-flect the dynamic nature of service demand as well as variability in supply. Going forward, implementation of a longitudinal survey design would add greatly to the value of this type of analysis, allowing researchers to simultan-eously track changes in supply and demand and making possible a richer and more meaningful interpretation of aggregate indices.
Conclusions
At the Hubbard Brook Experimental Forest, water flow regulation and water quality regulation services were pro-vided at relatively high levels and were largely unaffected by harvest throughout the entirety of the study period. In contrast, scenic beauty value was negatively impacted by harvesting, as was aboveground carbon mitigation where harvested biomass was used for the production of ethanol or where products were assumed to be additional (i.e. not substitutable) within the existing material economy. When biomass was fully allocated to LLWP replacing carbon-intensive products, however, the value of the carbon miti-gation service increased after harvest.
According to the results of our survey, local service beneficiaries perceived the ecosystem services provided by forests and woodlands are being relatively important to their families.
In most cases, beneficiaries experienced a net loss of ecosystem services after forest harvest. Where biomass was used to produce LLWP in place of more carbon-intensive products, however, carbon-intensive harvesting resulted in an immediate increase in the value of the composite service index. This suggests that, where beneficiaries place high value on GHG regulation, constraining harvested biomass to those uses with the highest life-cycle carbon benefits has the potential to shift the trajectory of the ag-gregate value of the entire ecosystem services portfolio– not just the value of the GHG regulation service itself. Beneficiaries with greater levels of university or college education perceived a greater overall level of ecosystem service provision.
Although in most cases both groups perceived a loss of overall services after harvesting, that loss was less and quicker to recover for beneficiaries with degrees. In fact, degree-holders did not incur an“ecosystem service debt” at all when biomass from WS 5 was used to produce LLWP – instead, they saw an immediate increase in overall service provision.
This study should be seen as an early effort to assess the effects of demographics on the perceived importance of forest ecosystem services in the northeastern U.S.A., as well as a demonstration of the value of using empir-ical measures of perceived importance to weight mea-sures of ecosystem service provision. This constitutes a valuable contribution to efforts to quantify ecosystem services and provides a plausible methodological alterna-tive to economic valuation for aggregating multiple ser-vices. An interactive visualization of the composite index at Hubbard Brook can be found at www.forestecoservi-ces.net/hbcomp.php. Users can manipulate importance weights, allocate the ratio of LLWD:ethanol, and decide whether products do or do not substitute for steel, fossil fuels, and or other carbon-intensive products. By doing so, a wider range of scenarios than those illustrated in Figs. 3 and 4 be can explored and visualized.
Finally, it is appropriate here to reemphasize the limi-tations of this particular study. The low response rate (5.9 %) coupled with likely non-response bias suggests that it would be inappropriate to generalize these find-ings to the resident population of Grafton County, NH. In particular, census data suggest that residents of this county are younger, less wealthy, and have less formal education than those who responded to the question-naire. Future efforts should focus on implementation methods that increase response rate, include efforts to measure and quantify non-response bias, and possibly incorporate the use of weighting methods to bring re-sults into closer correspondence with the demographics of the target population. In addition, adoption of a longi-tudinal survey methodology would provide multiple point-in-time measures that would make it possible to
identify changes in aggregate service provision resulting from changes in beneficiaries’perceptions - i.e. demand as opposed to supply. Another possible limitation of this study is the fact that the majority of respondents rated the importance of all ecosystem services quite highly. This could be a result of a genuine perception that most services are very important (especially if the low re-sponse rate reflects a rere-sponse bias towards those who place greater value on ecosystem services), but it could also result from a failure to frame questions in an ad-equate context. Future efforts may include refinements in wording, the inclusion of traditional goods and ser-vices alongside ecosystem serser-vices, and different types of questions (e.g. discrete choice experiments) to elicit a more nuanced and accurate assessment of the import-ance of benefits from ecosystem services.
Additional file
Additional file 1:Survey instrument used to elicit the perceived value of ecosystem services by residents of Grafton County, NH, USA. (PDF 367 kb)
Acknowledgements
This project was undertaken with support from the USDA Forest Service’s Northeastern States Research Cooperative (NSRC) and in collaboration with the Hubbard Brook Research Foundation and the Cary Institute of Ecosystem Studies.
Authors’contributions
JC and CMB conducted all analyses, interpreted results and wrote and revised the text. VAL and PMG made substantial contributions to the conception and design of the study. PMG was involved in the acquisition and curation of ecological data; JC collected all social data. All authors read and approved the final manuscript.
Authors’information
JC and CMB are multi-disciplinary scholars with expertise in social-ecological systems and ecosystem services. VAL serves as the provost of her institution, with career expertise in social science, social-ecological systems, and multi-disciplinary scholarship. PMG is an ecosystems ecologist and one of the principal investigators of the Hubbard Brook Ecosystem Study.
Competing interests
The authors declare that they have no competing interests.
Author details
1SUNY College of Environmental Science and Forestry, Department of Forest
and Natural Resources Management, Syracuse, NY 13210, USA.2Cary Institute
of Ecosystem Studies, Millbrook 12545, NY, USA.
Received: 12 January 2016 Accepted: 17 May 2016
References
Asah ST, Blahna DJ, Ryan CM (2012) Involving forest communities in identifying and constructing ecosystem services: Millennium assessment and place specificity. J Forest 110(3):149–156
Babbie E (1990) Survey Research Methods, 2nd edn. Wadsworth Publishing Company, Belmont, CA, 395 p
Bagstad KJ, Villa F, Batker D, Harrison-Cox J, Voigt B, Johnson GW (2014). From theoretical to actual ecosystem services: Mapping beneficiaries and spatial flows in ecosystem service assessments. Ecol Soc 19(2)
Beier CM, Caputo J, Groffman P (2015) Measuring ecosystem capacity to provide regulating services: forest removal and recovery at Hubbard Brook (USA). Ecol Appl 25(7):2011–2021
Bennett EM, Peterson GD, Gordon LJ (2009) Understanding relationships among multiple ecosystem services. Ecological Letters 12(12):1394–1404 Birdsey RA (1992) Carbon storage and accumulation in United States forest
ecosystems. General Technical Report WO-59. U.S. For. Serv. Northeastern Exp. Stn., Radnor, PA. 51 p.
Braat LC (2012) Ecosystem services-science, policy and practice: Introduction to the journal and the inaugural issue. Ecosystem Services 1(1):1–3
Buchholz T, Rametsteiner E, Volk TA, Luzadis VA (2009) Multi Criteria Analysis for bioenergy systems assessments. Energy Policy 37(2):484–495
Butler BJ (2008) Family forest owners of the United States, 2006. Gen. Tech. Rep. NRS-27. U.S. Department of Agriculture, Forest Service, Northern Research Station, Newtown Square, PA
Butler BJ, Leatherberry EC (2004) America's family forest owners. J For 102(7):4–14 Campbell JL, Driscoll CT, Eagar C, Likens GE, Siccama TG, Johnson CE, Fahey TJ,
Hamburg SP, Holmes RT, Bailey AS, Buso DC (2007) Long-term trends from ecosystem research at the Hubbard Brook Experimental Forest. Gen. Tech. Rep. NRS-17. U.S. Department of Agriculture, Forest Service, Northern Research Station, Newtown Square, PA, p 41
Caputo J, Beier CM, Groffman PM, Burns DA, Beall FD, Hazlett PW, Yorks TE (2016) Effects of harvesting forest biomass on water and climate regulation services: a synthesis of long-term ecosystem experiments in eastern North America. Ecosystems 19(2):271–283
Díaz S, Quétier F, Cáceres DM, Trainor SF, Pérez-Harguindeguy N, Bret-Harte MS, Finegan B, Peña-Claros M, Poorter L (2011) Linking functional diversity and social actor strategies in a framework for interdisciplinary analysis of nature’s benefits to society. Proc Natl Acad Sci 108(3):895–902
Dillman DA (2000) Mail and Internet Surveys: The Tailored Design Method, 2nd edn. Wiley, New York, 464 p
Farber SC, Costanza R, Wilson MA (2002) Economic and ecological concepts for valuing ecosystem services. Ecol Econ 41(3):375–392
Fargione J, Hill J, Tilman D, Polasky S, Hawthorne P (2008) Land Clearing and the Biofuel Carbon Debt. Science 319(5867):1235–1238
García-Llorente M, Martín-Lopéz B, Díaz S, Montes C (2011) Can ecosystem properties be fully translated into service values? An economic valuation of aquatic plant services. Ecol Appl 21(8):3083–3103
García-Nieto AP, Quintas-Soriano C, García-Llorente M, Palomo I, Montes C, Martín-Lopéz B (2015) Collaborative mapping of ecosystem services: The role of stakeholders profiles. Ecosystem Services 13:141–152
Gould RK, Ardoin NM, Woodside U, Satterfield T, Hannahs N, Daily GC (2014) The forest has a story: cultural ecosystem services in Kona, Hawai‘i. Ecol Soc 19(3):55 Hoffman RE, Palmer JF (1996) Silviculture and forest aesthetics within stands. Publ.
No. 2. SUNY College of Environmental Science and Forestry, Syracuse, NY. 31 p. Hothorn T, Bretz F, Westfall P (2008) Simultaneous inference in general
parametric models. Biom J 50(3):346–363
Kari S, Korhonen-Kurki K (2013) Framing local outcomes of biodiversity conservation through ecosystem services: A case study from Ranomafana, Madagascar. Ecosyst Serv 3:e32–e39
Kaye-Zwiebel E, King E (2014) Kenyan pastoralist societies in transition: varying perceptions of the value of ecosystemservices. Ecol Soc 19(3):17
Kuznetsova A, Brockhoff PB, Christensen RHB (2014) lmerTest: Tests for random and fixed effects for linear mixed effect models (lmer objects of lme4 package). R package version2.0-6. http://CRAN.R-project.org/package=lmerTest Lattimore B, Smith CT, Titus B, Stupak I, Egnell G (2013) Woodfuel Harvesting: A
Review of Environmental Risks, Criteria and Indicators, and Certification Standards for Environmental Sustainability. J Sustain For 32(1–2):58–88 Lippke B, Gustafson R, Venditti R, Volk T, Oneil E, Johnson L, Puettmann M, Steele
P (2011a) Sustainable biofuel contributions to carbon mitigation and energy independence. Forests 2:861–874
Lippke B, Oneil E, Harrison R, Skog K, Gustavsson L, Sathre R (2011b) Life cycle impacts of forest management and wood utilization on carbon mitigation: Knowns and unknowns. Carbon Manag 2(3):303–333
Lippke B, Puettmann ME, Johnson L, Gustafson R, Venditti R, Steele P, Katers JF, Taylor A, Volk TA, Oneil E, Skog K, Budsberg E, Daystar J, Caputo J (2012) Carbon emission reduction impacts from alternative biofuels. Forest Product J 62(4):296–304
López-Hoffman L, Wiederholt R, Sansone C, Bagstad KJ, Cryan P, Diffendorfer JE, Goldstein J, LaSharr K, Loomis J, McCracken G, Medellín RA, Russell A, Semmens D (2014) Market forces and technological substitutes cause fluctuations in the value of bat pest- control services for cotton. PLoS ONE 9(2)
Manfreda KL, Bosnjak M, Berzelak J, Haas I, Vehovar V (2008) Web surveys versus other survey modes: A meta-analysis comparing response rates. Intl J Market Res 50(1):79–104
Martín-López B, Iniesta-Arandia I, García-Llorente M, Palomo I, Casado-Arzuaga I, Del Amo DG, Gómez-Baggethun E, Oteros-Rozas E, Palacios-Agundez I, Willaarts B, González JA, Santos-Martín F, Onaindia M, López-Santiago C, Montes C (2012) Uncovering ecosystem service bundles through social preferences. PLoS ONE 7(6)
Millenium Ecosystem Assessment (2005) Ecosystems and human well-being: synthesis. Island Press, Washington, D.C
Mika AM, Keeton WS (2013) Factors contributing to carbon fluxes from bioenergy harvests in the U.S. Northeast: An analysis using field data. GCB Bioenergy 5(3):290–305
Molnar JL, Kubiszewski I (2012) Managing natural wealth: research and implementation of ecosystem services in the United States and Canada. Ecosyst Serv 2:45–55
Muhamad D, Okubo S, Harashina K, Parikesit GB, Takeuchi K (2014) Living close to forests enhances people's perception of ecosystem services in a forest-agricultural landscape of West Java, Indonesia. Ecosyst Serv 8:197–206 Norgaard RB (2010) Ecosystem services: From eye-opening metaphor to
complexity blinder. Ecol Econ 69(6):1219–1227
Perez-Garcia J, Lippke B, Briggs D, Wilson J, Bowyer J, Meil J (2005) The environmental performance of renewable building materials in the context of residential construction. Wood Fiber Sci 37(special issue: December 2005):3–17 Peterson MJ, Hall DM, Feldpausch-Parker AM, Peterson TR (2010) Obscuring
ecosystem function with application of the ecosystem services concept. Conserv Biol 24(1):113–119
R Core Team (2013) R: A language and environment for statistical computing, version 3.0.2–‘Frisbee Sailing’. R Foundation for Statistical Computing, Vienna, Austria. ISBN 3-900051-07-0, http://www.R-project.org/. Reed MS, Hubacek K, Bonn A, Burt TP, Holden J, Stringer LC, Beharry-Borg N,
Buckmaster S, Chapman D, Chapman PJ, Clay GD, Cornell SJ, Dougill AJ, Evely AC, Fraser EDG, Jin N, Irvine BJ, Kirkby MJ, Kunin WE, Prell C, Quinn CH, Slee B, Stagl S, Termansen M, Thorp S, Worrall F (2013) Anticipating and managing future trade-offs and complementarities between ecosystem services. Ecol Soc 18(1):5
Renard D, Rhemtulla JM, Bennett EM (2015) Historical dynamics in ecosystem service bundles. Proc Natl Acad Sci 112(43):13411–13416
Ribe RG (2009) In-stand scenic beauty of variable retention harvests and mature forests in the U.S. Pacific Northwest: the effects of basal area, retention pattern, and down wood. J Environ Manag 91(1):245–260
Schabenberger O, Pierce FJ (2002) Contemporary Statistical Models for the Plant and Soil Sciences. CRC Press, Boca Raton, FL, p 738
Schwenk WS, Donovan TM, Keeton WS, Nunery JS (2012) Carbon storage, timber production, and biodiversity: Comparing ecosystem services with multi-criteria decision analysis. Ecol Appl 22(5):1612–1627
Sexton NR, Miller HM, Dietsch AM (2011) Appropriate uses and considerations for online surveying in human dimensions research. Hum Dimens Wildl 16(3): 154–163
Smail RA, Lewis DJ (2009) Forest-land conversion, ecosystem services, and economic issues for policy: a review. Gen. Tech. Rep. PNW-GTR-797. USDA Forest Service, Pacific Northwest Research Station. p 40
SurveyMonke (2014) http://www.surveymonkey.com. Accessed 13 Jan 2014 TEEB (2010) The economics of ecosystems and biodiversity: ecological and
economic foundations. Earthscan, London, p 410
U.S. Census Bureau. 2010 Census. http://factfinder2.census.gov/faces/nav/jsf/ pages/index.xhtml. Accessed 17 Mar 2014
U.S. Census Bureau. Census 2000 Summary File 3, Matrices P30, P32, P33, P43, P46, P49, P50, P51, P52, P53, P58, P62, P63, P64, P65, P67, P71, P72, P73, P74, P76, P77, P82, P87, P90, PCT47, PCT52, and PCT53 http://factfinder2.census. gov/faces/nav/jsf/pages/index.xhtml. Accessed 17 Mar 2014
Vihervaara P, Marjokorpi A, Kumpula T, Walls M, Kamppinen M (2012) Ecosystem services of fast-growing tree plantations: a case study on integrating social valuations with land-use changes in Uruguay. Forest Policy Econ 14(1):58–68 Villamagna AM, Angermeier PL, Bennett EM (2013) Capacity, pressure, demand,
and flow: A conceptual framework for analyzing ecosystem service provision and delivery. Ecol Compl 15:114–121
Walker T, Cardellichio P, Gunn JS, Saah DS, Hagan JM (2013) Carbon accounting for woody biomass from Massachusetts (USA) managed forests: a framework for determining the temporal impacts of wood biomass energy on atmospheric greenhouse gas levels. J Sustain Forest 32(1–2):130–158
Submit your manuscript to a
journal and benefi t from:
7Convenient online submission 7Rigorous peer review
7Immediate publication on acceptance 7Open access: articles freely available online 7High visibility within the fi eld
7Retaining the copyright to your article