Open Access
Mapping and characterization of quantitative
trait loci for mesocotyl elongation in rice
(
Oryza sativa
L.)
Hyun-Sook Lee
1,2*, Kazuhiro Sasaki
1,3, Atsushi Higashitani
1, Sang-Nag Ahn
2and Tadashi Sato
1*Abstract
Mesocotyl elongation is an important trait for seedling emergence in direct-seeding cultivation in rice. In this study, a backcross inbred line (BIL) population from a cross between Kasalath and Nipponbare was employed to map quantitative trait loci (QTLs) for mesocotyl elongation. A total of 5 QTLs for mesocotyl length were identified on chromosomes 1, 3, 7, 9, and 12 in 2 independent experiments. At all QTL, the Kasalath alleles contributed to an increase in mesocotyl length. Two QTLs (qMel-1andqMel-3) on chromosomes 1 and 3 were consistently detected in both experiments. To fine map the QTLs, a cross was made between 2 chromosome segment substitution lines (CSSL-6 and CSSL-15), each harboring the Kasalath allele across theqMel-1andqMel-3regions, and an F2:3
population was developed. A two-way ANOVA indicated that no epistatic interaction was detected between the 2 QTLs in the F2population (P= 0.31). Moreover, analysis of two F3near-isogenic lines (NILs) derived from the same
cross, indicated that the 2 QTLs act additively in distinct or complementary pathways in controlling mesocotyl elongation. Substitution mapping indicated that theqMel-1QTL was located between the 2 SSR markers RM5448 and RM5310, which are 3,799-kb apart, and that theqMel-3QTL was located between the 2 SSR markers RM3513 and RM1238, which are 6,964-kb apart. To our knowledge, this is the first report to fine-map QTLs for mesocotyl elongation and to analyze their interaction.
Keywords:Rice (Oryza sativaL.), Chromosome segment substitution line (CSSL), Direct-seeding, Mesocotyl elongation, Quantitative trait locus (QTL)
Background
In rice, direct-seeding cultivation is becoming popular in Korea and Japan, because it requires less labor relative to transplanting one. The mesocotyl is an embryonic struc-ture between the scutellar node and coleoptilar node and is directly related to rice seedling emergence, since it elon-gates during germination to push the shoot tip above the soil surface. However, poor emergence and inadequate stand establishment of seedlings caused by short mesoco-tyls can lead to yield loss in direct seeding cultivation.
Mesocotyl elongation displays a large variation among rice germplasm. The mesocotyl of indica cultivars is longer than that of japonica cultivars (Takahashi 1978),
and the variation in mesocotyl length inindica cultivars is larger than that of japonica cultivars (Hamada 1937; Takahashi 1978). Upland rice cultivars display a longer mesocotyl and a higher proportion of elongated mesoco-tyls compared to the lowland cultivars (Chang and Ver-gara 1975; Wu et al. 2005). Moreover, mesocotyl elongation in south and southwest Asian accessions dis-plays a larger variation than that of east Asian ones (Takahashi et al. 1995). However, this variation has not been elucidated fully with reference to the genetic backgrounds.
Mesocotyl elongation in rice is controlled by several genetic factors and is also affected by environmental fac-tors. Dilday et al. (1990) found that mesocotyl elongation could be inherited stably from generation to generation in semi-dwarf rice cultivars. Furthermore, Mgonja et al. (1994) reported the partial dominance and preponder-ance of additive gene effects for mesocotyl elongation * Correspondence:[email protected];[email protected]
1
Graduate School of Life Sciences, Tohoku University, 2-1-1 Katahira, Aoba-ku, Sendai 980-8577, Japan
2College of Agriculture and Life Sciences, Chungnam National University,
Daejeon 305-764, South Korea
Full list of author information is available at the end of the article
using diallel crosses among 6 rice cultivars. Lin et al. (2006) showed that mesocotyl elongation in rice was mainly controlled by 2 recessive genes.
The advancement of molecular marker technology has led to the development of genetic maps that make it pos-sible to identify and locate genes or quantitative trait loci (QTLs) controlling quantitative characters. Several studies were conducted to map QTLs for mesocotyl elongation by using various segregating populations from interspecific or intrasubspecific crosses (Cai and Morishima 2002; Cao et al. 2002; Katsuta-Seki et al. 1996; Redoña and Mackill 1996; Huang et al. 2010). Five QTLs for mesocotyl length were identified by the slant-board test using an F2
popula-tion derived from a cross between a low-vigor japonica cultivar and a high-vigor indica cultivar (Redoña and Mackill 1996). Eleven QTLs were detected using a recom-binant inbred line (RIL) population from an interspecific cross betweenO. sativa and O. rufipogon (Cai and Mor-ishima 2002). Three QTLs controlling mesocotyl length were identified by the glass tube test using an F2:3
popula-tion of the cross between Assam cultivar“Surjamkhi”and a Chinese indica cultivar “Dao Ren Qiao” (Katsuta-Seki et al. 1996). Cao et al. (2002) detected 8 QTLs using
a doubled haploid population from indica-japonica
cultivar cross. Finally, Huang et al. (2010) detected 5 QTLs for mesocotyl length using a RIL population from
the cross between 2 japonica cultivars under water and plant hormone gibberellins (GA) germination condition. However, the QTLs detected in these studies were not confirmed in a near-isogenic background using chromo-some segment substitution lines (CSSLs), and the inter-action among the QTLs has not been elucidated.
The aims of this study were 1) to identify QTLs con-trolling mesocotyl elongation using backcross inbred lines (BILs) derived from a cross between Nipponbare and Kasalath, 2) to confirm and fine-map the QTLs detected in the BILs by using CSSLs and their progeny, and 3) to analyze the interaction of QTLs in controlling mesocotyl elongation.
Results
Variation of mesocotyl elongation in back-cross inbred lines (BILs) developed from Kasalath and Nipponbare
Fifty-seven rice accessions from the Rice Diversity Re-search Set (RDRS) were evaluated for mesocotyl elong-ation (Additional file 1: Table S1). Among these accessions, WRC29 (Kalo Dhan) showed the greatest mesocotyl elongation, followed by WRC02 (Kasalath). WRC01 (Nipponbare) was among the accessions showing the shortest mesocotyl length. The mesocotyls of WRC07 (Davao1), WRC20 (Tadukan), and WRC24 (Pinulupot1) did not elongate. Based on the data, the BILs from a cross
between Kasalath and Nipponbare were considered suit-able for a QTL analysis of mesocotyl elongation.
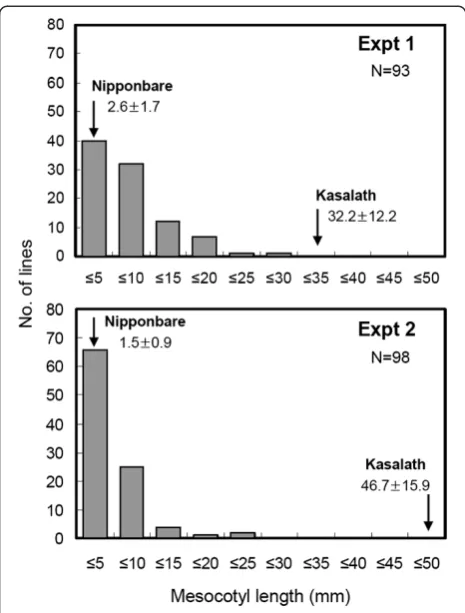
Two independent measurements of the mesocotyl length of 98 BILs derived from these accessions were carried out under the agar conditions. A significant dif-ference was found in the mesocotyl length between the 2 parents, Nipponbare and Kasalath (Figures 1 and 2). The mesocotyl of Kasalath elongated over 32.2 mm,
whereas that of Nipponbare was less than 2.6 mm. The average mesocotyl length was 7.4 mm and 4.6 mm in the BILs in 2 experiments, while the mesocotyl length of the BILs ranged from 0 to 30 mm. Remarkably, no transgres-sive segregant with a longer mesocotyl than Kasalath was observed. The distribution of the mesocotyl length be-tween the 2 experiments was somewhat different,
al-though the correlation coefficient was significant
(r = 0.86,P<0.001). Kasalath showed more elongation in Expt. 2 (46.7 mm) than Expt. 1 (32.2 mm), and more lines showed reduced mesocotyl elongation in Expt. 2. These results indicate that mesocotyl elongation is influ-enced by environmental conditions.
QTLs for mesocotyl elongation
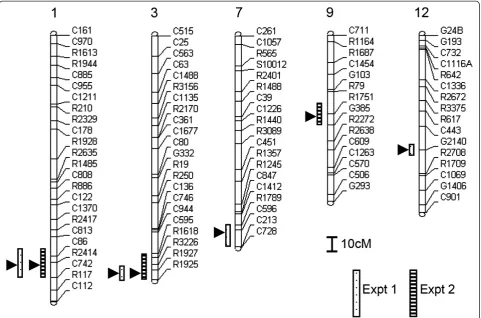
A total of 5 QTLs were detected on chromosomes 1, 3, 7, 9, and 12 in the 2 experiments with the BILs (Table 1, Figure 3). When the mean value of two experiments was used in QTL analysis, 4 QTLs were detected in the same locus on chromosomes 1, 3, 7 and 9 except for chromo-some 12 (data not shown). QTLs that mapped near the markers R2414 and R1927 on chromosomes 1 and 3, re-spectively, were detected in both experiments. The
qMel-1 QTL accounted for 15.9% (Expt. 1) and 22.6%
(Expt. 2) of the phenotypic variance, whereas qMel-3 explained 11.5% (Expt. 1) and 20.8% of the variance (Expt. 2). Three additional QTLs, qMel-7, qMel-9, and qMel-12, were each identified in only 1 experiment and accounted for 15.9%, 12.6%, and 9.9% of the phenotypic variance. Kasalath alleles at all QTL loci contributed to an increase in mesocotyl length. The Kasalath alleles at
qMel-1 and qMel-3 increased the mesocotyl length by
4.4–5.0 mm. BecauseqMel-1 and qMel-3 were detected in both experiments, they were chosen as the targets for fine mapping.
For confirming these 2 QTLs, CSSL-6 and CSSL-15,
carrying the QTLs qMel-1 and qMel-3, respectively,
were crossed to develop an F2 population. A total of 95 Figure 2Frequency distribution of the mesocotyl length of BILs
in the two experiments.Arrow indicates mean with SD for Nipponbare and Kasalath (Expt. 1: n = 30; Expt. 2: n = 36).
Table 1 Characteristics of QTLs for mesocotyl length in the backcross inbred lines (BILs) in two experiments
Locusa Chr. Marker intervalb Experiment LOD scorec R2(%)d Additive effecte
qMel-1 1 C86/R2414/C742 Expt 1 5.4 15.9 5.0
C86/R2414/C742 Expt 2 8.3 22.6 4.6
qMel-3 3 R3226/R1927/R1925 Expt 1 4.2 11.5 4.4
C595/R1927/R1925 Expt 2 7.5 20.8 4.5
qMel-7 7 R1789/C596/C213 Expt 1 6.0 15.9 4.8
qMel-9 9 R79/R1751/G385 Expt 2 5.1 12.6 3.6
qMel-12 12 C443/G2140/R2708 Expt 1 3.2 9.9 4.6
a
QTLs were designated as“qMel-chromosome number” b
The nearest RFLP marker to the QTL is underlined c
Putative QTLs with significant LOD score tested atP<0.05 d
Proportion of the phenotypic variance explained by the nearest marker of QTL e
F2 plants were measured for mesocotyl length, and then
qMel-1 and qMel-3 were mapped with 10 SSR markers.
Figure 4 shows the distribution of mesocotyl length based on the genotype of the nearest SSR markers,
RM3602 at theqMel-1region and RM8277 at the
qMel-3region, in the F2 population. RM3602 linked toqMel-1
explained 15.7% of the phenotypic variance, whereas RM8277 on chromosome 3 accounted for 20.6% of the variance in the 95 F2 population. The mesocotyls of
CSSL-6 and CSSL-15 were 1.6 and 5.7 mm, respectively, and those of the F2population ranged from 0 to 30 mm.
Transgressive segregants exceeding the parental values were also observed. The distribution showed continuous but not a normal distribution. Therefore, clearly classify-ing the F2 plants into subgroups according to mesocotyl
length by the genotype data was impractical.
Interaction betweenqMel-1andqMel-3
To test the interaction between the 2 QTLs, we mea-sured the mesocotyl length of 4 lines, NIL-1, CSSL-6, CSSL-15, and NIL-2 (Figure 5). Mesocotyl of the CSSL-6 was significantly longer than that of NIL-1 (P<0.001). The mesocotyls of CSSL-15 plants were significantly
increased in length relative to those from CSSL-6 (P <0.001) and NIL-1 plants (P<0.0001). In addition, the mesocotyls of NIL-2 plants were significantly longer than those of CSSL-15 plants (P<0.00001). In the F2
popula-tion, two-way ANOVA revealed a non-significant digenic interaction between two markers, RM3602 and RM8277 linked toqMel-1andqMel-3, respectively (P= 0.31) (data not shown). These results indicate that the 2 QTLs act additively in distinct or complementary pathways in con-trolling mesocotyl elongation.
Substitution mapping
Based on the finding that the 2 QTLs behave in a com-plementary manner, 4 and 3 F2 plants with informative
recombination breakpoints within theqMel-1and qMel-3regions of the introgressed Kasalath segments, respect-ively, were identified and selfed to produce F3 lines for
substitution mapping (Figure 6). Four lines (lines 11, 16, 28, and 29) were homozygous for Kasalath across the
qMel-3 region defined by SSR markers RM8277 and
RM1221; 3 lines (lines 10, 26, and 19) were homozygous
at the qMel-1 region defined by SSR markers RM5448
and RM5310. The F3 lines were used to explore the
dominance relationship among alleles at the qMel-1and
qMel-3 QTLs. For this purpose, the phenotypic means
were compared among the 3 genotypes defined by the al-lele constitution at RM5448, RM3602 and RM5310 on chromosome 1 and RM3513, RM5475 and RM1238 on chromosome 3 (Figure 6). The mean mesocotyl length
of the Nipponbare homozygotes was not significantly different from that of the heterozygotes. However, the mean mesocotyl length of the Kasalath homozygotes at RM3602 and RM5475 was significantly higher than that of the Nipponbare homozygotes and heterozy-gotes. These results showed that the Nipponbare alleles at the qMel-1 and qMel-3 loci were dominant over the Kasalath alleles. The implication from this analysis was that the Nipponbare homozygotes and heterozygotes could be treated together in the phenotypic analysis for the fine mapping of the 2 QTL.
CSSL-6 and CSSL-15 served as respective positive con-trols for the region as a whole. The mesocotyl lengths of lines 11 and 29 were not significantly different than that of CSSL-15. In addition, the 3 genotypes of the two lines, 11 and 29, did not show significant differences, suggest-ing that the 2 lines did not contain a Kasalath allele affecting mesocotyl elongation in the introgressed seg-ments. A comparison of mesocotyl length among the F3
progeny showed significant differences among the 3 gen-otypes for the populations from lines 16 and 28. Based on the size of the chromosome 1 introgression in 16 and
28, it was concluded that qMel-1 was located in the
interval RM5448–RM5310, a region of approximately
3,799 kb (Figure 6) (http://www.gramene.org/marker/, Reference to Gramene Annotated Nipponbare Sequence 2009). RM5448 and RM5310 represented the outside borders of the introgression. Hence, we conclude that the qMel-1 locus has been localized to a region <3,799 kb in size.
For qMel-3, the mesocotyl lengths of lines 10 and 26 were significantly different than that of CSSL-6, and the 3 genotypic classes for lines 10 and 26 showed sig-nificant differences at RM5475 but not for line 26 at RM3513. These results suggested that the 2 lines did contain a Kasalath allele affecting mesocotyl elongation
Figure 4Frequency distribution of the mesocotyl length of 95 F2plants derived from a cross between CSSL6 and CSSL15. Arrows indicate mean values with standard deviations (n = 11) for CSSL6 and CSSL15. White, black and gray bars indicate homozygous for Nipponbare and Kasalath alleles and heterozygous for the marker RM3602 on chromosome 1 (a) and RM8277 on chromosome 3 (b), respectively. The LOD score (LOD), proportion of the phenotypic variance (R2) and the additive effect of the Kasalath allele (a) are indicated in each figure (P<0.05).
Figure 5Comparison of mesocotyl length in 2 NILs and 2 parental lines, CSSL-6 and CSSL-15 with different genotypes atqMel-1and
in the introgressed Kasalath segment. qMel-3 was con-sistently mapped nearest to marker R1927, with this marker explaining 11.5–20.8% of the phenotypic vari-ation of mesocotyl length in 98 BILs. Based on the size of the chromosome 3 introgression in lines 10, 26, and 19, qMel-3 was concluded to be located in the interval
RM3513–RM1238, a region of ~6,964-kb (Figure 6)
(http://www.gramene.org/marker/, Reference to Gra-mene Annotated Nipponbare Sequence 2009).
Discussion
This study was conducted to identify QTLs controlling mesocotyl elongation in rice. Mesocotyl length is a quan-titative trait and displays a substantial amount of vari-ation among genotypes, especially in indica cultivars (Takahashi et al. 1978; Takahashi et al. 1995; Wu et al. 2005). Phenotyping of 57 rice accessions provided
valuable information about the range and distribution of mesocotyl length in rice. The mean mesocotyl length in indica was nearly twice that of japonica, and indica accessions showed a larger variation thanjaponica acces-sions in mesocotyl length. The mesocotyl length of
indica accessions ranged from 0 mm to 46.0 mm,
whereas that of japonicacultivars ranged from 0 mm to 16.4 mm on agar medium (Additional file 1: Table S1).
This result suggests that indica germplasms contain
alleles that would be useful sources of genetic variation for enhancing mesocotyl elongation injaponica.
Mesocotyl elongation is sensitive to environmental fac-tors. Mesocotyl growth is affected by light (Takahashi 1984; Nick and Furuya 1993), moisture (Takahashi 1978), and temperature. It is noteworthy that no difference in
R2 values for qMel-1 and qMel-3 between the 2
map-ping populations was observed. R2 values for qMel-1
Figure 6Graphical genotypes of F3lines used in substitution mapping ofqMel-1andqMel-3. White portions of the graph indicate homozygous Nipponbare chromosome segments, black regions indicate homozygous Kasalath chromosomes, gray areas indicate heterozygous regions and slashed areas are regions where crossing-over occurred. The table to the right of the graphical genotypes indicates mean mesocotyl length for each of the three genotypes of F3lines and two CSSLs. One line was genotyped with two markers, RM5475 and RM3513. The broken
were 15.9% and 22.6% in the BILs and 15.7% in the F2
population (Table 1 and Figure 4). This result is not consistent with those of previous studies showing that the proportion of the phenotypic variance that could be explained by the markers was greatly enhanced in the NIL population compared with segregating popula-tions, such as BILs. This is mainly due to the fact that mesocotyl elongation is affected by environmental con-ditions and that a single plant was measured for
meso-cotyl elongation in the F2 population. Multiple
regression analysis in the BIL population also indicated that five QTL explained only 54.0% of the total pheno-typic variance. It is interesting that CSSL-6 showed contrasting results in mesocotyl length according to experiments. Mesocotyl of CSSL-6 was significantly longer than that of NIL-1 in the experiment to detect interaction between 2 QTLs (Figure 5). However, no difference in mesocotyl length between Nipponbare and CSSL-6 was not observed in the substitution map-ping experiment, although the mesocotyls of CSSL-6 plants were longer than those of Nipponbare (data not shown). These results are similar to the complementary effect of two genes, Rc and Rd in coloration in rice grains except that each of these two genes is inherited
monogenetically whereas qMel-1 and qMel-3 show
quantitative inheritance (Furukawa et al. 2006). In red coloration in rice grains, the Rc and Rd genes are
ne-cessary for the red pigmentation, Rc and rd are
involved in the brown pigmentation, and either rc and
rd or rc and Rd produce white grains. These results
might suggest that qMel-1 requires the complementary effects of other QTL in mesocotyl elongation or qMel-1 is more sensitive to environment conditions.
A number of studies reported various QTLs for mesoco-tyl elongation using interspecific and intersubspecific crosses (Cai and Morishima 2002; Cao et al. 2002; Katsuta-Seki et al. 1996; Redoña and Mackill 1996; Huang et al. 2010). Eleven QTLs for mesocotyl elongation were identi-fied on chromosomes 1, 3, 4, 5, 6, 9 and 11 using an RIL population derived from a cross between anindicacultivar and wild rice,O. rufipogon(Cai and Morishima 2002). Cao et al. (2002) detected eight QTLs on chromosomes 1, 3, 6, 7, 8, and 12 using a doubled haploid population from a cross between IR64 and Azucena. Five QTLs for mesocotyl elongation were mapped on chromosomes 1, 3, 5 and 7 using an F3population developed from a cross between
ja-ponica cultivar, Labelle and indica cultivar, Black Gora (Redoña and Mackill 1996). Of interest, QTLs for mesoco-tyl elongation were commonly mapped to chromosomes 1 and 3 in different mapping populations and experiment conditions. We also identified QTLs qMel-1 and qMel-3 on chromosomes 1 and 3, respectively, in both experi-ments in this study (Figure 6). These 2 QTLs detected in the present study are located in an interval similar to
ones reported by other previous studies.qMel-1was colo-calized with QTLs for mesocotyl elongation in previous reports (Cai and Morishima 2002; Cao et al. 2002; Katsuta-Seki et al. 1996; Redoña and Mackill 1996). qMel-3 was located in the RM3513-RM1238 interval on the long arm of chromosome 3, and this interval overlapped with regions of QTLs reported in previous studies (Cai and Morishima 2002; Cao et al. 2002; Katsuta-Seki et al. 1996; Redoña and Mackill 1996; Huang et al. 2010). These results clearly demonstrated the existence of QTLs controlling mesocotyl elongation on chromosomes 1 and 3. Previous studies identified a QTL for mesocotyl length in a puta-tively homeologous location on the long arm of maize cho-mosome 3 (Troyer 1997; Zhang et al. 2012). Troyer (1997) found three regions on chromosome 3, 6 and 9 related to mesocotyl elongation using translocation tester stocks. Three QTLs for mesocotyl length were commonly detected on chromosome 1, 3 and 10 under two different sowing depth conditions in maize (Zhang et al. 2012). While the resolution of the maize QTL was low, the pos-itional correspondence raises the possibility that this locus may be involved in controlling mesocotyl length in both rice and maize (Wei et al. 2007; Soderlund et al. 2011, www.symapdb.org).
The Kasalath alleles at qMel-1 and qMel-3 increased mesocotyl length in the isogenic Nipponbare back-ground. These results indicate that the 2 QTLs act
addi-tively in complementary pathways in controlling
mesocotyl elongation. To the best of our knowledge, this is the first study using CSSLs to reveal a complementary effect between QTLs for mesocotyl length.
Substitution mapping has been applied in diverse plant species to facilitate the fine mapping of QTLs (Wissuwa et al. 2002; Li et al. 2004). Based on substitution map-ping,qMel-1was mapped to a 3,799-kb interval between markers RM5448 and RM5310 on chromosome 1, while qMel-3was mapped to a 6,964-kb interval between mar-kers RM3513 and RM1238 on chromosome 3. Based on the annotated Nipponbare genome sequence, the 3,799-kb interval with the qMel-1 locus and 6,964-kb interval with theqMel-3 contain 490 and 700 putative genes, re-spectively (http://www.ncbi.nlm.nih.gov/projects/map-view/map_search.cgi?taxid=4530&query=).
Conclusions
Our analysis of the qMel-1 and qMel-3 locus led to
number of QTLs for mesocotyl elongation have been identified using a variety of cross combinations in rice (www.gramene.org). Overall, our analysis indicated that more comprehensive research on epistasis among QTLs is necessary to provide enough data to facilitate the accumulation of desirable QTLs in breeding lines and to better understand the genetic mechanism con-trolling mesocotyl elongation.
Methods
Plant materials
Fifty-seven rice accessions selected from the Rice Diversity Research Set (RDRS) of germplasm collection were used to detect variation in mesocotyl elongation in cultivated rice (Oryza sativaL.) (Kojima et al. 2005; Additional file 1: Table S1). The original seeds of the RDRS collection were provided by the Genebank of the National Institute of Agrobiological Sciences, Japan (www.gene.affrc.go.jp/ databases-core_collections_wr_en.php).
To identify QTLs for mesocotyl elongation, we used 98 BILs that had been developed from BC1F1 of the
Nip-ponbare/Kasalath//Nipponbare cross by the single-seed descent method (Lin et al. 1998).
For confirmation and fine mapping ofqMel-1and qMel-3, 2 CSSLs, CSSL-6 and CSSL-15 were selected from the CSSLs developed from a cross between Nipponbare and Kasalath at Rice Genome Resource Center (RGRC), Japan (http://www.rgrc.dna.affrc.go.jp/ineNKCSSL54.html).
CSSL-6 and CSSL-15, carrying the QTLs qMel-1 and
qMel-3, respectively, were crossed to develop an F2:3
popu-lation. CSSL-6 contained 2 Kasalath introgressions, a 34.7 cM-sized segment from the end of the long arm to restric-tion fragment length polymorphism (RFLP) marker C86 of chromosome 1 and a 6.3 cM segment flanked by RFLP markers, C39-R1440 on chromosome 7, in the Nipponbare background. The Kasalath segment on chromosome 1 of
CSSL-6 included qMel-1. In CSSL-15, a 61.3 cM-sized
Kasalath segment was introgressed near RFLP markers, R19-R1925 on the long arm of chromosome 3. The result-ing 3 F1plants were selfed to obtain F2plants. Ninety-five
F2 plants were generated and used to confirm the target
QTLs. Thirty-two F2 plants with recombination
break-points within the target QTL regions were selected and selfed to obtain F3seeds for substitution mapping.
Seeds of BILs and CSSLs, which were derived from a cross between Nipponbare and Kasalath were provided by RGRC, Japan (http://www.rgrc.dna.affrc.go.jp/stock. html). RDRS and BILs plants were grown in the experi-mental lowland field of the Graduate School of Life Sciences, Tohoku University at Kashimadai, Osaki, Miyagi Prefecture, Japan. After the mesocotyl lengths of the F2 and F3populations from a cross between CSSL-6
and CSSL-15 were measured, the individual plants were planted in the greenhouse. The panicles of these plants
were harvested at 40–50 days after heading and then dried in a well-ventilated room for 3 months. Seeds were removed from the dried panicles by hand, and then only seeds without any visible damage were selected for this study. The seeds were placed in paper envelopes and packed in plastic sealed bags with silica gel. The seeds were then stored in the 4°C refrigerator until the experiments.
Evaluation of mesocotyl elongation
To measure mesocotyl elongation, we used plastic jars for plant culture (70-mm diameter, 120-mm height; San-syo Ltd., Tokyo, Japan) containing 30 ml of 0.3% agar medium. Twelve good quality seeds from each RDRS ac-cession, 98 BILs, F2 and F3population were sown at a 1
cm depth in the agar medium of each jar in 2 replica-tions and immediately placed into a black box (60 cm × 44 cm, 29 cm height) ventilated by an air-pump (1 lit./ min) in a 30°C dark room. At 7 day after the start of in-cubation, the mesocotyl length of each seedling was mea-sured by a ruler as the distance from the basal part of the seminal root to the coleoptilar node. Seedlings that grew poorly were excluded from the measurements for mesocotyl length. The means in each temporal replica-tion (Expt. 1 and Expt. 2) were used for the QTL analysis.
QTL analysis in the BIL and F2populations
To map QTLs for mesocotyl elongation in the BILs, the genotype data generated using 245 RFLP markers (http://rgp.dna.affrc.go.jp/publicdata/genotypedataBILs/ genotypedata.html) were used. For detecting the precise location of the target QTL, a total of 95 F2 plants were
subjected to linkage analysis with 4 and 6 SSR markers on the target regions of chromosomes 1 and 3, respect-ively (McCouch et al. 2002).
Linkage analysis was performed using the Kosambi function of Mapmaker/EXP 3.0 software (Lander et al. 1987). QTL analysis was performed by composite inter-val mapping (CIM) using the QTL Cartographer version 2.5 software (Wang et al. 2007). CIM analysis was per-formed with a forward-backward stepwise regression-using model 6 with a 10 cM window size. The log-likelihood (LOD) threshold significance level (P<0.05) was determined by computing 1,000 permutations. The QTL positions were assigned to the point of the max-imum LOD score in the target regions. The percentage of the total phenotypic variance accounted for by each QTL was estimated on the basis of the R2value.
Substitution mapping ofqMel-1andqMel-3and interaction analysis
Seven F2 plants with different recombination
identified and selfed to develop F3 lines from 32 F2
plants. After the mesocotyl length of each F3 plant
from each line was measured, the seedlings were grown in a glass test tube for DNA extraction and genotyping with SSR markers for substitution mapping of the target QTL.
Two F2plants were identified with the following
geno-types: NIL-1 (Nipponbare homozygous at both QTL loci) and NIL-2 (Kasalath homozygous at both QTL loci). A single F2plant per each NIL group was selfed to produce
an F3 line, and these 2 F3 lines, in addition to CSSL-6
and CSSL-15, were evaluated for mesocotyl length to test the interaction between the 2 QTLs.
DNA marker analysis
DNA was extracted from BILs in bulk and from each of the F2and F3 plants derived from the CSSL-6 x CSSL-15
cross. A piece of leaf, 5 cm in length, was cut from the tip of each leaf blade, placed in a microtube containing extraction buffer [200 mM Tris-HCl (pH 8.0), 250 mM NaCl, 25 mM EDTA, 0.5% (w/v) sodium dodecyl sulfate], and homogenized with a pestle. DNA was precipitated with isopropanol and then resuspended in 50ul of TE buffer [10 mM Tris-HCl (pH 8.0), 1 mM EDTA]. PCR amplification fragments were separated using electro-phoresis on a 2.7% agarose gel.
Additional file
Additional file 1: Table S1Variation of the mesocotyl length for 57 rice accessions from RDRS collection.
Competing interests
The authors declare that they have no competing interests.
Acknowledgements
This work was supported by a Scientific Research grant for a foreign student (Hyun-Sook Lee) from the Ministry of Education, Culture and Science, Japan. The authors thank Dr. Atsushi Higashitani (Graduate School of Life Sciences, Tohoku University) for his valuable suggestions. We are grateful to Ms. Eiko Hanzawa, Ms. Yuri Kazama, and Ms. Chiharu Kisara (Graduate School of Life Sciences, Tohoku University) for their technical assistance. This work was supported in part by Grants-in-Aid from the Ministry of Agriculture, Forestry and Fisheries, Japan (Genomics for Agricultural Innovation, QTL-4009) and from the Next- Generation BioGreen 21 Program (No. PJ008136), Rural Development Administration, Republic of Korea.
Author details
1Graduate School of Life Sciences, Tohoku University, 2-1-1 Katahira, Aoba-ku,
Sendai 980-8577, Japan.2College of Agriculture and Life Sciences, Chungnam
National University, Daejeon 305-764, South Korea.3Plant Breeding, Genetics
and Biotechnology Division, International Rice Research Institute, DAPO, Box 7777, Metro Manila, Philippines.
Authors’contributions
HL conceived of the study and carried out molecular genetic analysis and statistical analysis, and wrote manuscript. KS helped to design research and performed statistical analysis. AH participated in the design of the study. SA participated in the study and advised to draft the manuscript. TS designed research and helped to draft the manuscript. All authors read and approved the final manuscript.
Received: 16 March 2012 Accepted: 26 June 2012 Published: 26 June 2012
References
Cai HW, Morishima H (2002) QTL clusters reflect character associations in wild and cultivated rice. Theor Appl Genet 104:1217–1228
Cao L, Zhu J, Yan Q, He L, Wei X, Cheng S (2002) Mapping QTLs with epistasis for mesocotyl length in a DH population from indica-japonica cross of rice (Oryza sativa). Chinese J Rice Sci 16:221–224 (in Chinese with English abstract)
Chang T, Vergara BS (1975) Varietal diversity and morpho-agronomic characteristics of upland rice.In“Major research in upland rice”. International rice research institute, Manila, Philippines, pp 72–90
Dilday RH, Mgonja MA, Amonsilpa SA, Collins FC, Wells BR (1990) Plant height vs. mesocotyl and coleoptile elongation in rice: Linkage or pleiotropism? Crop Sci 30:815–818
Furukawa T, Maekawa M, Oki T, Suda I, Lida S, Shimada H, Takamure I, Kadowaki K (2006) TheRcandRdgenes are involved in proanthocyanidin synthesis in rice pericarp. Plant J 49:91–102
Hamada H (1937) Physiologisch-systematische Untersuchungen über das Wachstum der Keimorgane vonOryza sativaL. Mem Coll Sci Kyoto Imp Univ Seres B 12:259–309
Huang C, Jiang S-K, Feng L-L, Xu Z-J, Chen W-F (2010) Analysis of QTLs for mesocotyl length in rice (Oryza sativaL.). Acta Agron Sin 36:1108–1113 Katsuta-Seki M, Ebana K, Okuno K (1996) QTL analysis for mesocotyl elongation in
rice. Rice Genet Newsl 13:126
Kojima Y, Ebana K, Fukuoka S, Nagamine T, Kawase M (2005) Development of an RFLP-based rice diversity research set of germplasm. Breeding Sci 55:431–440 Lander ES, Green P, Abrahamson J, Barlow A, Daly MJ, Lincoln SE, Newburg L
(1987) MAPMAKER: An interactive computer package for constructing primary genetic linkage maps of experimental and natural populations. Genomics 1:174–181
Li J, Thomson M, McCouch SR (2004) Fine mapping of a grain-weight quantitative trait locus in the pericentromeric region of rice chromosome 3. Genetics 168:2187–2195
Lin J-R, Zhang G-H, Wu M-G, Cao L-Y, Cheng S-H (2006) Genetic analysis of mesocotyl elongation in rice (Oryza sativaL. subsp.japonica). Acta Agron Sin 32:249–252 (in Chinese with English abstract)
Lin SY, Sasaki T, Yano M (1998) Mapping quantitative trait loci controlling seed dormancy and heading date in rice,Oryza sativaL., using backcross inbred lines. Theor Appl Genet 96:997–1003
McCouch SR, Teytelman L, Xu Y, Lobos KB, Clare K, Walton M, Fu B, Maghirang R, Li Z, Xing Y, Zhang Q, Kono I, Yano M, Fjellstrom R, Declerck G, Schneider D, Cartinhour S, Ware D, Stein L (2002) Development and mapping of 2240 new SSR markers for rice (Oryza sativaL.). DNA Res 9:199–207
Mgonja MA, Ladeinde TAO, Aken’Ova ME (1994) Genetic analysis of mesocotyl length and its relationship with other agronomic characters in rice (Oryza sativaL.). Euphytica 72:189–195
Nick P, Furuya M (1993) Phytochrome dependent decrease of gibberellin-sensitivity; a case study of cell extension growth in the mesocotyl ofjaponica
andindicatype rice cultivars. Plant Growth Regul 12:195–206
Redoña ED, Mackill DJ (1996) Mapping quantitative trait loci for seedling vigor in rice using RFLPs. Theor Appl Genet 92:395–402
Soderlund C, Bomhoff M, Nelson WM (2011) SyMAP v3.4: a turnkey synteny system with application to plant genomes. Nucleic Acids Res 39(10):e68 Takahashi N (1978) Adaptive importance of mesocotyl and coleoptile growth in
rice under different moisture regimes. Aust J Plant Physiol 5:511–517 Takahashi N (1984) Seed germination and seedling growth, Biology of rice. Japan
Science Society press Elsevier, pp 71–88
Takahashi K, Watanabe H, Hoshikawa K (1995) Varietal differences and geographical distributions in the growth of mesocotyl and internodes of rice (Oryza sativaL.) seedlings. Japan J Corp Sci 64:66–72, in Japanese with English abstract
Troyer AF (1997) The location of genes governing long first internode of corn. Genetics 145:1149–1154
Wang S, Basten CJ, Zeng ZB (2007) Windows QTL Cartographer 2.5. Department of Statistics. North Carolina State University, Raleigh, NC, http://statgen.ncsu. edu/qtlcart/WQTLCart.htm
Soderlund C, Wing RA (2007) Physical and genetic structure of the maize genome reflects its complex evolutionary history. PLOS Genet 3(7):1254–1263 Wissuwa M, Wegner J, Ae N, Yano M (2002) Substitution mapping ofPub1: a
major QLT increasing phosphorus uptake of rice from a phosphorus-deficient soil. Theor Appl Genet 105:890–897
Wu M, Zhang G, Lin J, Cheng S (2005) Screening for rice germplasms with specially-elongated mesocotyl. Rice Sci 12:226–228
Zhang H, Ma P, Zhao Z, Zhao G, Tian B, Wang J, Wang G (2012) Mapping QTL controlling maize deep-seeding tolerance-related traits and confirmation of a major QTL for mesocotyl length. Theor Appl Genet 124:223–232
doi:10.1186/1939-8433-5-13
Cite this article as:Leeet al.:Mapping and characterization of
quantitative trait loci for mesocotyl elongation in rice (Oryza sativaL.).
Rice20125:13.
Submit your manuscript to a
journal and benefi t from:
7Convenient online submission
7Rigorous peer review
7Immediate publication on acceptance
7Open access: articles freely available online 7High visibility within the fi eld
7Retaining the copyright to your article