RESEARCH
Patient–ventilator asynchrony
during conventional mechanical ventilation
in children
Guillaume Mortamet
1,2,3, Alexandrine Larouche
1,3, Laurence Ducharme‑Crevier
1,3, Olivier Fléchelles
4,
Gabrielle Constantin
1,3, Sandrine Essouri
3,5, Amélie‑Ann Pellerin‑Leblanc
6, Jennifer Beck
7,8,9,
Christer Sinderby
7,9,10, Philippe Jouvet
1,3and Guillaume Emeriaud
1,3*Abstract
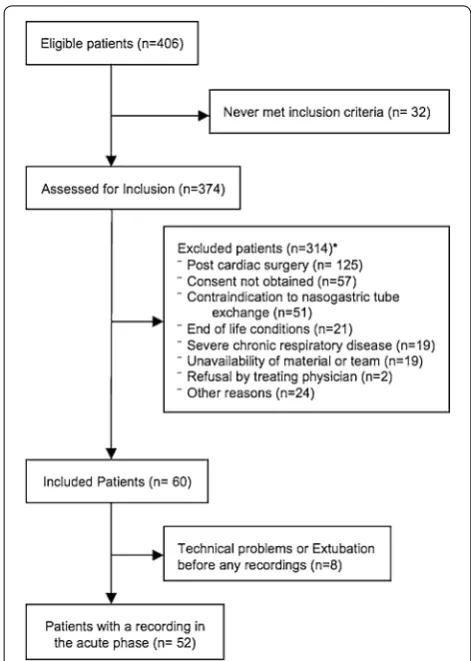
Background: We aimed (1) to describe the characteristics of patient–ventilator asynchrony in a population of criti‑ cally ill children, (2) to describe the risk factors associated with patient–ventilator asynchrony, and (3) to evaluate the association between patient–ventilator asynchrony and ventilator‑free days at day 28.
Methods: In this single‑center prospective study, consecutive children admitted to the PICU and mechanically venti‑ lated for at least 24 h were included. Patient–ventilator asynchrony was analyzed by comparing the ventilator pressure curve and the electrical activity of the diaphragm (Edi) signal with (1) a manual analysis and (2) using a standardized fully automated method.
Results: Fifty‑two patients (median age 6 months) were included in the analysis. Eighteen patients had a very low ventilatory drive (i.e., peak Edi < 2 µV on average), which prevented the calculation of patient–ventilator asynchrony. Children spent 27% (interquartile 22–39%) of the time in conflict with the ventilator. Cycling‑off errors and trigger delays contributed to most of this asynchronous time. The automatic algorithm provided a NeuroSync index of 45%, confirming the high prevalence of asynchrony. No association between the severity of asynchrony and ventilator‑free days at day 28 or any other clinical secondary outcomes was observed, but the proportion of children with good synchrony was very low.
Conclusion: Patient–ventilator interaction is poor in children supported by conventional ventilation, with a high frequency of depressed ventilatory drive and a large proportion of time spent in asynchrony. The clinical benefit of strategies to improve patient–ventilator interactions should be evaluated in pediatric critical care.
Keywords: Diaphragm function, Mechanical ventilation, Patient–ventilator asynchrony, Patient–ventilator interaction, Pediatric intensive care unit, Pediatrics
© The Author(s) 2017. This article is distributed under the terms of the Creative Commons Attribution 4.0 International License (http://creativecommons.org/licenses/by/4.0/), which permits unrestricted use, distribution, and reproduction in any medium, provided you give appropriate credit to the original author(s) and the source, provide a link to the Creative Commons license, and indicate if changes were made.
Background
Mechanical ventilation is commonly used in pediatric intensive care units (PICUs) [1]. Maintaining the patient’s own spontaneous breathing effort during ventilation is key. Assisted (or patient-triggered) ventilation may improve ventilation perfusion matching and forestall the
development of ventilator-induced diaphragmatic dys-function [2]. As the patient contributes in the ventilation, good interaction between the patient and the ventilator is essential.
Children have higher respiratory rates, smaller tidal volumes, and weaker inspiratory efforts when compared with adults, and patient–ventilator synchrony is diffi-cult to achieve in pediatric patients [3]. These can lead to a mismatch between the patient and the ventilator, defined as a patient–ventilator asynchrony (PVA). PVA
Open Access
*Correspondence: guillaume.emeriaud@umontreal.ca 1 Pediatric Intensive Care Unit, CHU Sainte‑Justine, 3175 Côte Sainte‑Catherine, Montreal, QC, Canada
includes the inspiratory and expiratory timing errors (delays between patient demand and ventilator response), efforts undetected by the ventilator, assist delivered in the absence of patient demand, and double triggering (two rapidly successive assists following a single effort).
In critically ill adults, asynchronies occur frequently and are associated with prolonged ventilator support, sleep disorders, poor lung aeration, longer stay in the intensive care unit and mortality [4–9]. Pediatric data in this field are lacking. PVA seems frequent in PICU [10– 13], but little is known about the risk factors of PVA and the association with patient outcome.
In the present study, we aimed to describe the charac-teristics of PVA in critically ill children, to identify risk factors associated with PVA, and to evaluate the associa-tion between PVA and patient outcome.
Methods
This prospective observational study was conducted in the PICU of CHU Sainte-Justine, a university-affiliated pediatric hospital, from August 2010 to October 2012. The study protocol was approved by the ethics commit-tee of CHU Sainte-Justine. Written informed consent was obtained from the parents or legal tutor.
Patients
Consecutive children aged between 7 days and 18 years admitted to the PICU and mechanically ventilated for at least 24 h were eligible. The screening was performed daily by a research assistant. Eligible patients reached inclusion criteria when the presence of spontaneous breathing was evidenced by clinical respiratory efforts or by a respiratory rate sustainably higher than the set ventilator rate. Patients were excluded if they had one of the following criteria: chronic respiratory insufficiency with prior ventilatory support longer than 1 month, tra-cheostomy, neuromuscular disease, contraindications to nasogastric tube exchange (i.e., local trauma, recent local surgery, or severe coagulation disorder), suspected bilat-eral diaphragm paralysis, immediate postcardiac surgery period, expected death in the next 24 h, or a limitation of life support treatment.
No modification of the ventilator settings was done for the study. The attending physicians set the ventila-tor mode and settings according to the local practices. Patients were ventilated with the Evita XL (Dräger, Lubeck, Germany) or the Servo-I ventilator (Maquet, Solna, Sweden). Sedation and analgesia were decided by the treating team and usually involved a combination of benzodiazepines and opioids. There was no local writ-ten protocol regarding the ventilator management or the sedation during the study. The ventilation support
was reassessed every 1 or 2 h by respiratory therapists according to local practice. At the time of the study, neu-rally adjusted ventilatory assist (NAVA) was not routinely used in clinical practice in our unit.
Protocol
PVA was recorded at two different times during the PICU stay. We obtained a first 30-min recording in acute phase, i.e., as soon as possible after inclusion in the study, and an esophageal catheter was installed to record the electrical activity of diaphragm (Edi). The second (pre-extubation) recording was performed during 15 min in the 4 h pre-ceding extubation, if the Edi catheter was still in place.
Data recording
PVA was analyzed by comparing the ventilator pressure curve and the Edi signal. Edi was recorded using a spe-cific nasogastric catheter (Edi catheter, Maquet, Solna, Sweden) connected to a dedicated Servo-I ventilator (Maquet, Solna, Sweden). This ventilator was used only to continuously process and record the Edi signal, the patient being ventilated with his own ventilator as before the study. The catheter was positioned according to the recommendations of the manufacturer as previously described [12, 14].
Demographic data and patient’s characteristics, includ-ing age, gender, weight, time of measurements, admission diagnostic and comorbidities, Pediatric Index of Mortal-ity (PIM) II and Pediatric Logistic Organ Dysfunction (PELOD) scores, were collected. The sedation score was calculated for the 4-h period preceding the first record-ing, as suggested by Randolph et al. [15], using a score for which one point was given for the amount of each drug that would be equivalent to 1 h of sedation in a nontol-erant subject. The Comfort B scale was used to deter-mine the level of comfort (comfort is better when score is lower).
Clinical outcomes
The primary outcome was the number of ventilator-free days at day 28 (since intubation). Patients who died were considered having zero ventilation-free day. The second-ary clinical outcomes were first extubation success (no need for invasive ventilation support within 48 h of extu-bation), duration of mechanical ventilation, and length of PICU stay.
PVA manual analysis
care. Timings of the beginning and the end of inspira-tion and expirainspira-tion phases on the Edi and the ventila-tory pressure signals were semiautomatically identified: Main timings were automatically identified, and a visual inspection was performed breath by breath, permitting to validate and/or adjust the timing cursors if necessary. All analyses were performed by two independent inves-tigators. By comparing the ventilator and Edi timings, PVA was identified, including wasted efforts (clear effort observed on Edi with no ventilator assist), auto-triggered breath (ventilator assist delivered in the absence of Edi increase), double triggering (two rapidly successive assists following a single effort), and inspiratory trigger and cycling-off errors. As the response of the ventilator for triggering or cycling off could be frequently either retarded or premature [12], we reported both types of asynchrony.
The main PVA variable of interest was the percent-age of time spent in asynchrony, calculated from the total duration spent in each type of PVA (wasted efforts, auto-triggering, double triggering, trigger and cycling off errors) divided by the duration of the recording. A pri-ori, we defined severe PVA when the percentage of time spent in asynchrony was superior to the 75th percentile of the entire cohort, i.e., the quarter of patients with the worst synchrony.
In order to facilitate the comparison with other stud-ies [18], we also calculated the asynchrony index (AI), defined as the number of asynchronous events (i.e., the sum of wasted efforts, ineffective triggering, double trig-gering, and cycles with important trigger and cycling-off errors) divided by the total respiratory rate (i.e., the sum of ventilator cycles and wasted efforts), and expressed as a percentage. Important trigger and cycling-off errors were considered when the error (i.e., premature or delayed response) exceeded 33% of inspiratory and expir-atory times, respectively. An AI > 10% was considered as a high incidence of asynchrony [5, 18].
PVA automatic analysis
Asynchrony was also analyzed using a standardized automated method over the same period, to prevent interobserver variability and to avoid observer sub-jectivity [19]. Inspiratory and expiratory timings were fully automatically detected on ventilator pressure and Edi signals based on predetermined thresholds (0.5 μV for Edi amplitude). Asynchrony was quantified using the NeuroSync index, a global index considering both inspiratory and cycling-off errors. A higher NeuroSync index reflects worse asynchrony, and synchrony can be considered as poor when NeuroSync index exceeds 20% [20, 21].
Sample size calculation
Based on studies conducted in adults, we expected a dif-ference in ventilator-free days of 6 days. With a group distribution of 3/1 and a type-1 error risk of 0.05, the inclusion of 56 patients was necessary to achieve a power of 80%. We planned to enroll a sample of 60 patients to take into account the attrition risk.
Statistical analysis
Data are expressed as median values (with interquartiles, IQR) for continuous variables, and number and/or fre-quency (%) for categorical data. Differences in categorical variables were tested using Chi-square or Fisher’s exact test. Differences in continuous variables were assessed by the nonparametric Mann–Whitney test, the paired t test, or the Wilcoxon test.
Patients with peak inspiratory Edi < 2 µV were a poste-riori excluded from PVA analysis (both manual and auto-mated) because the reality of the spontaneous activity in those patients appeared questionable, and the identifica-tion of PVA is complex. intraclass correlaidentifica-tion coefficient (ICC, two-way random model) was calculated to assess interobserver reproducibility for manual PVA analy-sis and to compare the results from the manual and the automatic methods. After confirmation of an excellent interobserver agreement (ICC > 0.75), the averages of the two observer’s results were calculated and used in further analysis.
The association of potential risk factors with severe PVA was studied by univariate logistic regression analy-sis. Noncollinear factors associated with a univariate association with p < 0.05 were included in a multivari-ate logistic regression. The relationship between PVA and clinical outcomes was described using univariate analysis.
All p values are two-tailed and considered significant if p < 0.05. Statistical analyses were performed using SPSS 24.0 (SPSS, Inc, Chicago, IL).
Results
Study population
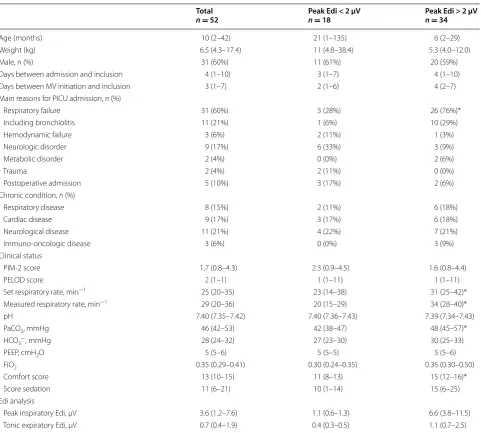
Eighteen patients had a very low ventilatory drive (peak Edi < 2 µV on average), which prevented the calculation of PVA. As detailed in Table 1, these patients tended to be older, were affected less frequently by a respiratory disease, and had a lower PaCO2 and a lower comfort score as compared to patients with higher drive.
Magnitude of PVA
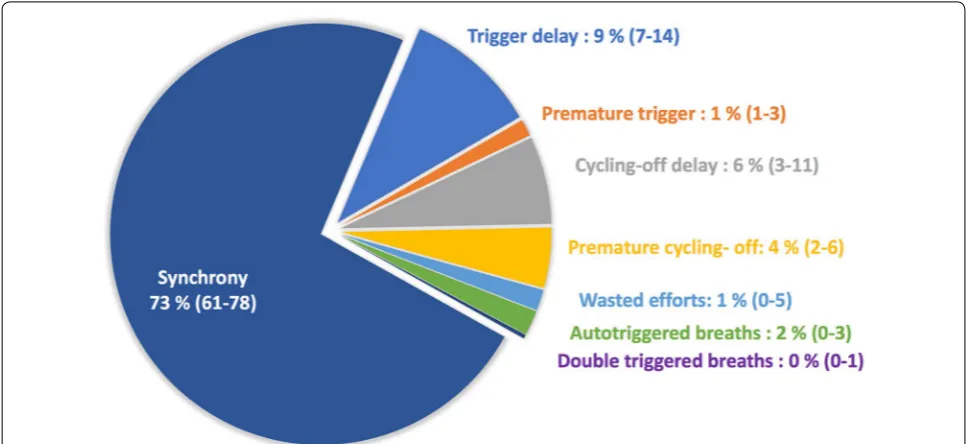
A total of 9806 breaths were analyzed with the manual method, with a median of 168 (IQR: 123–258) breaths analyzed per recording. The interrater agreement for PVA manual analysis was excellent, with ICC > 0.85 for all PVA parameters. The total proportion of time spent in PVA was 27% (IQR: 22–39) of the time. As illustrated in Fig. 2, cycling-off errors and trigger delays contributed to most of this asynchronous time 12% (IQR: 8–15) and 11% (IQR: 8–16), respectively. Auto-triggered cycles, wasted efforts, and double triggering were also highly prevalent, with two (IQR: 0–3), two (IQR: 1–10), and one (IQR: 0–5) events per minute, respectively.
The median AI was 25% (IQR: 18–35), and 33 (97%) patients had an AI greater than 10%.
Characteristics of patients with severe asynchrony
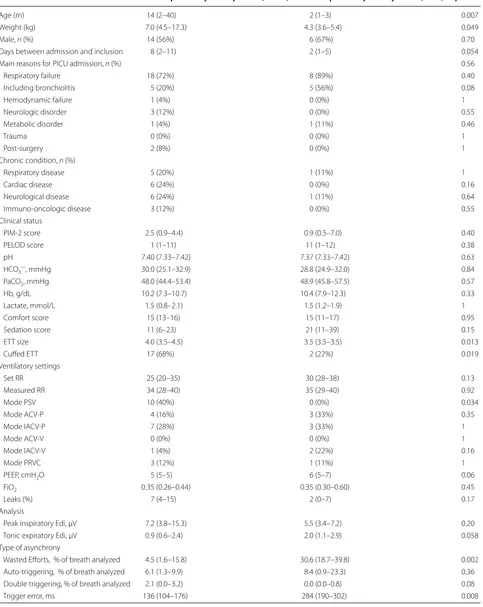
Nine patients were considered as severely asynchronous, with a proportion of time spent in asynchrony > 75th percentile, i.e., > 39% of time (Table 2). Patients with severe asynchrony were younger (p = 0.007), had more frequently a narrower and noncuffed ETT (p = 0.001 and p = 0.019, respectively), and were less frequently venti-lated in pressure-support ventilation (PSV, p = 0.034). All but one of these patients were admitted for a respira-tory failure as a first reason, and five of them had bron-chiolitis. In the multivariate logistic regression model in which age, presence of a cuffed ETT, and PSV mode were tested, none of these variables were independently asso-ciated with severe PVA (all p > 0.17).
The patients with severe asynchrony were enrolled earlier in the PICU course (2 days (1–5) vs 8 (2–11), p = 0.054), which must be considered while looking at the relationship between PVA and length of stay or venti-lation duration.
Evolution of PVA
As illustrated in Fig. 3, when comparing the recordings from acute phase and pre-extubation phase, the level of PVA tended to decrease over time (p = 0.01), and both period data were correlated (R2 = 0.41). Peak Edi increased between the two phases (p = 0.01).
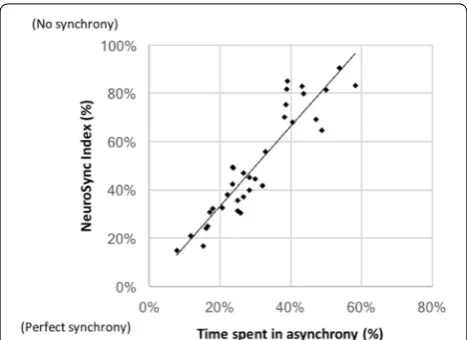
Automatic analysis of PVA
The automatic algorithm provided a NeuroSync index of 45% (32–70%), confirming the high prevalence of asynchrony. As shown in Fig. 4, a good correlation was observed between NeuroSync index and the percentage of time spent in asynchrony derived from the manual analysis, with an ICC of 0.88.
Outcome
We did not observe any association between the level of asynchrony and neither ventilator-free days at day 28, nor the secondary outcomes (Table 2). This holds true with the manual classification as severe PVA or not (Table 2), as well as with the automated NeuroSync index (correla-tion with ventila(correla-tion dura(correla-tion: R2 = 0.12; p = 0.58). None of the patient characteristics were associated with the duration of mechanical ventilation.
Discussion
The incidence of PVA is very high during pediatric con-ventional ventilation. As a whole, children spend about one-third of the time in conflict with their ventilator. We described an a priori defined group with severe PVA, but marked PVA was present even in the other children, and the proportion of children which could be considered as “well synchronized” is low. Besides, an unexpected form
of bad interaction was observed, with the high prevalence of low ventilatory drive.
The magnitude of PVA that we observed is in agree-ment with that previously described [10–12]. In a recent study conducted in a PICU, Blokpoel et al. [10] showed that PVA occurred in 33% of breaths. These authors iden-tified PVA using the analysis of ventilator waveforms, a method which has a low sensitivity [6]. We used the Edi signal which clearly facilitates the detection of PVA, in particular the calculation of timing errors for triggering or cycling off [3, 12, 13, 17, 22, 23]. We were therefore
able to show that most of the time spent in asynchrony results from delayed or premature reactions of the venti-lator. These timing errors are important, especially when the normal inspiratory time is frequently around 400 ms in this population. We hypothesize that this delay in ven-tilator response is the consequence of small tidal volumes and short inspiratory and expiratory times in children as compared to adults. Although considered as the clas-sical method [12, 17, 24], the breath-by-breath manual analysis of PVA could be criticized because of its depend-ency on an investigator, as well as being highly time Table 1 Characteristics of population (n = 52)
Data are expressed as median (interquartile range) or n (%)
Edi electrical activity of the diaphragm, MV mechanical ventilation, PICU pediatric intensive care unit, PEEP positive end-expiratory pressure *Significant difference between the two groups (p < 0.05)
Total
n= 52 Peak Edi < 2 µVn= 18 Peak Edi > 2 µVn= 34
Age (months) 10 (2–42) 21 (1–135) 6 (2–29)
Weight (kg) 6.5 (4.3–17.4) 11 (4.8–38.4) 5.3 (4.0–12.0)
Male, n (%) 31 (60%) 11 (61%) 20 (59%)
Days between admission and inclusion 4 (1–10) 3 (1–7) 4 (1–10)
Days between MV initiation and inclusion 3 (1–7) 2 (1–6) 4 (2–7)
Main reasons for PICU admission, n (%)
Respiratory failure 31 (60%) 5 (28%) 26 (76%)*
Including bronchiolitis 11 (21%) 1 (6%) 10 (29%)
Hemodynamic failure 3 (6%) 2 (11%) 1 (3%)
Neurologic disorder 9 (17%) 6 (33%) 3 (9%)
Metabolic disorder 2 (4%) 0 (0%) 2 (6%)
Trauma 2 (4%) 2 (11%) 0 (0%)
Postoperative admission 5 (10%) 3 (17%) 2 (6%)
Chronic condition, n (%)
Respiratory disease 8 (15%) 2 (11%) 6 (18%)
Cardiac disease 9 (17%) 3 (17%) 6 (18%)
Neurological disease 11 (21%) 4 (22%) 7 (21%)
Immuno‑oncologic disease 3 (6%) 0 (0%) 3 (9%)
Clinical status
PIM‑2 score 1.7 (0.8–4.3) 2.3 (0.9–4.5) 1.6 (0.8–4.4)
PELOD score 2 (1–1) 1 (1–11) 1 (1–11)
Set respiratory rate, min−1 25 (20–35) 23 (14–38) 31 (25–42)*
Measured respiratory rate, min−1 29 (20–36) 20 (15–29) 34 (28–40)*
pH 7.40 (7.35–7.42) 7.40 (7.36–7.43) 7.39 (7.34–7.43)
PaCO2, mmHg 46 (42–53) 42 (38–47) 48 (45–57)*
HCO3−, mmHg 28 (24–32) 27 (23–30) 30 (25–33)
PEEP, cmH2O 5 (5–6) 5 (5–5) 5 (5–6)
FiO2 0.35 (0.29–0.41) 0.30 (0.24–0.35) 0.35 (0.30–0.50)
Comfort score 13 (10–15) 11 (8–13) 15 (12–16)*
Score sedation 11 (6–21) 10 (1–14) 15 (6–25)
Edi analysis
Peak inspiratory Edi, µV 3.6 (1.2–7.6) 1.1 (0.6–1.3) 6.6 (3.8–11.5)
consuming. However, our findings were supported by the good agreement between the two independent investiga-tors, and by the concordance also observed between the automatically calculated NeuroSync index and the manu-ally calculated PVA.
To date, no definition of severe PVA in children had been standardized. Some authors use the spe-cific index described in adults by Thille et al. [5, 25] and others the percentage of asynchronous breaths [3, 10, 12]. In the present study, we primarily assessed the magnitude of PVA according to the time spent in asynchrony, because it illustrates well the burden of asynchrony while taking into account different types of patient–ventilator conflict [17]. As expressed using the AI, our results confirm the severity of PVA, a huge proportion of the patients having an AI > 10%. A recent meta-analysis reported that the mean reported AI varied from 13 to 37% in adults, and from 38 to 74% in children during conventional ventilation, while a significant decrease in AI was observed with NAVA [18]. Consistent with the other PVA indices, only two patients in our series had a NeuroSync index < 20%, which corresponds to an adequate synchrony [20, 21]. The nonsevere group can therefore not be assumed as “well synchronized.” In agreement with Blokpoel et al. [10], who observed that only 20% children had an acceptable level of PVA, our study highlights that PVA is a major problem in PICU and concerns more than three-quarters of the children, as opposed to one-quarter of adult patients.
Younger age, smaller tracheal tubes, and absence of a cuff on the tracheal tube were associated with severe PVA, and PSV mode was more frequent in patients with less severe PVA. The smaller size and the absence of cuff may suggest that increased leaks could have played a role, as suggested by Blokpoel et al. [10]. The magnitude of the leaks was not different between the two groups, but the precision of this measure is not perfect [26]. None of the patients ventilated in PSV was classified as severe PVA. We may hypothesize that the patients ventilated in PSV have a stronger ventilatory drive, leading to a bet-ter detection of the breathing efforts by the ventilator [5]. However, a confounding factor may also explain this association, PSV being mostly used in our unit in older and less sedated patients.
Overall, we did not observe any association between severe asynchrony and adverse outcomes during the PICU course, in contrast to studies in adults [4, 5, 7]. Similarly, Blokpoel et al. did not observe pro-longed ventilation in patients with higher levels of asynchrony. While this may be the consequence of the limited power of these two pediatric studies, sev-eral explanations could be hypothesized to explain this difference with adult studies. In adults, adverse outcome was observed in severe PVA groups, while the remaining patients were appropriately synchro-nized [4, 5, 7]. In contrast, the number of children with good patient–ventilator interaction is quite low. In our study, patients with severe PVA frequently had diseases usually associated with good outcome (e.g.,
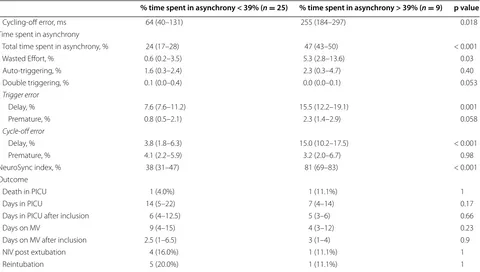
Table 2 Characteristics of patients depending on the level of asynchrony (in patients with Edi > 2 µV, n= 34)
% time spent in asynchrony < 39% (n= 25) % time spent in asynchrony > 39% (n= 9) p value
Age (m) 14 (2–40) 2 (1–3) 0.007
Weight (kg) 7.0 (4.5–17.3) 4.3 (3.6–5.4) 0.049
Male, n (%) 14 (56%) 6 (67%) 0.70
Days between admission and inclusion 8 (2–11) 2 (1–5) 0.054
Main reasons for PICU admission, n (%) 0.56
Respiratory failure 18 (72%) 8 (89%) 0.40
Including bronchiolitis 5 (20%) 5 (56%) 0.08
Hemodynamic failure 1 (4%) 0 (0%) 1
Neurologic disorder 3 (12%) 0 (0%) 0.55
Metabolic disorder 1 (4%) 1 (11%) 0.46
Trauma 0 (0%) 0 (0%) 1
Post‑surgery 2 (8%) 0 (0%) 1
Chronic condition, n (%)
Respiratory disease 5 (20%) 1 (11%) 1
Cardiac disease 6 (24%) 0 (0%) 0.16
Neurological disease 6 (24%) 1 (11%) 0.64
Immuno‑oncologic disease 3 (12%) 0 (0%) 0.55
Clinical status
PIM‑2 score 2.5 (0.9–4.4) 0.9 (0.5–7.0) 0.40
PELOD score 1 (1–11) 11 (1–12) 0.38
pH 7.40 (7.33–7.42) 7.37 (7.33–7.42) 0.63
HCO3−, mmHg 30.0 (25.1–32.9) 28.8 (24.9–32.0) 0.84
PaCO2, mmHg 48.0 (44.4–53.4) 48.9 (45.8–57.5) 0.57
Hb, g/dL 10.2 (7.3–10.7) 10.4 (7.9–12.3) 0.33
Lactate, mmol/L 1.5 (0.8–2.1) 1.5 (1.2–1.9) 1
Comfort score 15 (13–16) 15 (11–17) 0.95
Sedation score 11 (6–23) 21 (11–39) 0.15
ETT size 4.0 (3.5–4.5) 3.5 (3.5–3.5) 0.013
Cuffed ETT 17 (68%) 2 (22%) 0.019
Ventilatory settings
Set RR 25 (20–35) 30 (28–38) 0.13
Measured RR 34 (28–40) 35 (29–40) 0.92
Mode PSV 10 (40%) 0 (0%) 0.034
Mode ACV‑P 4 (16%) 3 (33%) 0.35
Mode IACV‑P 7 (28%) 3 (33%) 1
Mode ACV‑V 0 (0%) 0 (0%) 1
Mode IACV‑V 1 (4%) 2 (22%) 0.16
Mode PRVC 3 (12%) 1 (11%) 1
PEEP, cmH2O 5 (5–5) 6 (5–7) 0.06
FiO2 0.35 (0.26–0.44) 0.35 (0.30–0.60) 0.45
Leaks (%) 7 (4–15) 2 (0–7) 0.17
Analysis
Peak inspiratory Edi, µV 7.2 (3.8–15.3) 5.5 (3.4–7.2) 0.20
Tonic expiratory Edi, µV 0.9 (0.6–2.4) 2.0 (1.1–2.9) 0.058
Type of asynchrony
Wasted Efforts, % of breath analyzed 4.5 (1.6–15.8) 30.6 (18.7–39.8) 0.002
Auto‑triggering, % of breath analyzed 6.1 (1.3–9.9) 8.4 (0.9–23.3) 0.36
Double triggering, % of breath analyzed 2.1 (0.0–3.2) 0.0 (0.0–0.8) 0.08
bronchiolitis). It is also important to note that the patients with more severe PVA were recorded earlier in the PICU course. This baseline discrepancy makes it difficult to assess the relationship between PVA and ventilation duration.
The question remains whether those children would have a better outcome providing the PVA was improved. Only a controlled interventional trial, for example using a specific mode like NAVA, could confirm the independent role of PVA on outcome. Such evidence remains limited
Edi electrical activity of the diaphragm, PICU pediatric intensive care unit, RR respiratory rate, PSV pressure-support ventilation, ACV-P pressure-regulated assist control ventilation, IACV-P pressure-regulated intermittent assist control ventilation, ACV-V volume-regulated assist control ventilation, IACV-V volume-regulated intermittent assist control ventilation, PRVC pressure-regulated volume control ventilation, PEEP positive end-expiratory pressure, ETT endo-tracheal tube, MV mechanical ventilation, NIV noninvasive ventilation
Table 2 continued
% time spent in asynchrony < 39% (n= 25) % time spent in asynchrony > 39% (n= 9) p value
Cycling‑off error, ms 64 (40–131) 255 (184–297) 0.018
Time spent in asynchrony
Total time spent in asynchrony, % 24 (17–28) 47 (43–50) < 0.001
Wasted Effort, % 0.6 (0.2–3.5) 5.3 (2.8–13.6) 0.03
Auto‑triggering, % 1.6 (0.3–2.4) 2.3 (0.3–4.7) 0.40
Double triggering, % 0.1 (0.0–0.4) 0.0 (0.0–0.1) 0.053
Trigger error
Delay, % 7.6 (7.6–11.2) 15.5 (12.2–19.1) 0.001
Premature, % 0.8 (0.5–2.1) 2.3 (1.4–2.9) 0.058
Cycle‑off error
Delay, % 3.8 (1.8–6.3) 15.0 (10.2–17.5) < 0.001
Premature, % 4.1 (2.2–5.9) 3.2 (2.0–6.7) 0.98
NeuroSync index, % 38 (31–47) 81 (69–83) < 0.001
Outcome
Death in PICU 1 (4.0%) 1 (11.1%) 1
Days in PICU 14 (5–22) 7 (4–14) 0.17
Days in PICU after inclusion 6 (4–12.5) 5 (3–6) 0.66
Days on MV 9 (4–15) 4 (3–12) 0.23
Days on MV after inclusion 2.5 (1–6.5) 3 (1–4) 0.9
NIV post extubation 4 (16.0%) 1 (11.1%) 1
Reintubation 5 (20.0%) 1 (11.1%) 1
in PICU. In a crossover trial conducted in 12 children, De la Oliva et al. [13] observed that the improvement in PVA with NAVA was associated with an improvement in com-fort score. This has been supported by another study by Piastra et al. [27]. This finding is interesting when seda-tion is sometimes needed in cases of severe asynchrony. In the present study, we were not able to confirm that a better synchrony leads to a better comfort for the patient, as similar comfort score was observed in both groups. However, the patient with sever asynchrony tended to require more sedatives, as illustrated by higher sedation score (21 (11–39) vs 11 (6–23), although this difference did not reach significance (p = 0.15). An improved syn-chrony might have the potential to reduce sedation needs and its associated side effects. In a large randomized controlled trial, Kallio et al. [28] observed an interesting trend for shorter ventilation and ICU length of stay using NAVA (p = 0.03 and p = 0.07, respectively).
Finally, some authors hypothesize that improved PVA could also have deleterious effects that counterbal-ance the benefits [29]. It is, however, difficult to retain this hypothesis here while very few patients had good synchrony.
Interestingly, the peak Edi in the present study was rel-atively low (IQR 1.2–7.6) as compared to values observed in extubated children, which usually are between 5 and 30 mcV, depending on the lung condition [30, 31]. Many patients had low respiratory drive after several days of intubation, while they were deemed to be actively breathing. We consider this finding as a new form of poor patient–ventilator interaction, although not an asynchrony. This low respiratory activity has previously been reported [14, 32]. It could be the consequence of
overassistance, oversedation, their combination, or more rarely of an abnormal output by the central respiratory center or by bilateral phrenic nerve palsy [33, 34]. In this study group, many patients were admitted for nonres-piratory reasons. Even low level of ventilator support can be sufficient in such conditions to suppress the patient breaths [35]. We previously reported that the ventilatory drive increased in these patients after the extubation, so the central or peripheral neurological explanation seems unlikely [31]. Oversedation may have contrib-uted, as suggested by higher degree of comfort observed in these patients. As described by Vaschetto et al., the combination of overassistance and sedation has a syner-gistic impact on the drive suppression. More attention should be paid to this frequent complication, especially since such respiratory behavior has clearly been linked to diaphragm dysfunction [30, 36, 37].
Several limitations of our study need to be discussed. We included in the analysis fewer patients than expected. It is possible that our study was underpowered in par-ticular to conduct subgroup analysis or to truly assess the impact on patient outcome. This is a single-center study, and the results may have been influenced by the local practice, especially regarding ventilator settings. NAVA was not used in routine practice during the study period in our PICU. NAVA can improve patient–ven-tilator interactions [12, 18, 38], and the results of our study would probably be different in population treated with this mode. Many patients were not included, which could limit the external validity of our findings. Certain medical conditions, as chronic respiratory insufficiency with prior ventilatory support, tracheostomy or neuro-muscular disease, were a priori excluded, preventing us to generalize our findings to these patients. Two ventila-tors (Evita XL and Servo-I) were used during the study. Similar studies are necessary to confirm our findings with other ventilators. Due to the study design and the need to observe active breathing for considering patient inclu-sion, patients were not recorded at the same time after admission. Although the degree of PVA did not seem to change so much over the PICU course, this difference in inclusion timing made it difficult to interpret the rela-tionship between asynchrony and outcome.
Conclusion
Patient–ventilator interaction is poor in critically ill chil-dren supported by conventional ventilation. The study did not permit to ascertain if these poor interactions have important clinical consequence. But the magnitude of PVA and the prevalence of low ventilatory drive warrant further studies to assess whether strategies to optimize patient–ventilator interactions can improve the outcome of PICU patients.
Abbreviations
Edi: electrical activity of the diaphragm; ETT: endotracheal tube; NAVA: neurally adjusted ventilatory assist; PICU: pediatric intensive care unit; PSV: pressure support ventilation; PVA: patient–ventilator asynchrony.
Authors’ contributions
AL, GE, OF, SE, and PJ designed the study. GM, AL, GC, AAPL, OF, JB, CS, and GE performed the analysis and carried out the chart review and data collection. GM, JB, CS, PJ, and GE wrote the manuscript, which was reviewed, edited, and approved by all authors. As the corresponding author, GE has full access to all the data in the study and has final responsibility for the decision to submit for publication. All authors read and approved the final manuscript.
Author details
1 Pediatric Intensive Care Unit, CHU Sainte‑Justine, 3175 Côte Sainte‑Catherine, Montreal, QC, Canada. 2 INSERM U 955, Equipe 13, Créteil, France. 3 CHU Sainte‑Justine Research Center, Université de Montréal, Montreal, Canada. 4 Pediatric Intensive Care Unit, CHU Fort‑de‑France, Fort‑de‑France, France. 5 Department of Pediatrics, CHU Sainte‑Justine, Montreal, QC, Canada. 6 Queen’s University, Kingston, Canada. 7 Keenan Research Centre for Biomedi‑ cal Science, Li Ka Shing Knowledge Institute, St. Michael’s Hospital, Toronto, ON, Canada. 8 Department of Pediatrics, University of Toronto, Toronto, Can‑ ada. 9 Institute for Biomedical Engineering and Science Technology (iBEST), Ryerson University and St‑Michael’s Hospital, Toronto, Canada. 10 Department of Medicine, University of Toronto, Toronto, Canada.
Acknowledgements
The authors are indebted to the patients and their families for their willingness to participate in our study. We thank Mariana Dumitrascu, Laurence Bertout, and Noémie Loron for their help in the screening and enrollment process, Lucy Clayton for the study management support, the respiratory therapists for their logistic help, the PICU fellows, attending healthcare providers, and PICU nurses for their collaboration, and Norman Comtois for his invaluable support regarding signal recording and analysis. This work was performed in CHU Sainte‑Justine, Pediatric Intensive Care Unit, Montreal, Quebec, Canada.
Competing interests
GM, LDC, OF, GC, SE, and AAPL have no conflict of interest to declare. GE’s research program is supported by a scholarship award by the Fonds de Recherche du Québec – Santé. He is currently leading a feasibility study in neonatal ventilation, which is financially supported by Maquet Critical Care. PJ is supported by a scholarship award by the Fonds de Recherche du Québec – Santé, Ministry of Health and Sainte‑Justine Hospital. He was a consult‑ ant for Sage Therapeutic inc. and was invited to a congress by Medunik Inc and Covidien. JB and CS have made inventions related to neural control of mechanical ventilation that are patented. The patents are assigned to the academic institution(s) where inventions were made. The license for these patents belongs to Maquet Critical Care. Future commercial uses of this technology may provide financial benefit to JB and CS through royalties. JB and CS each own 50% of Neurovent Research Inc (NVR). NVR is a research and development company that builds the equipment and catheters for research studies. NVR has a consulting agreement with Maquet Critical Care. Neurovent research Inc. provided a recording device. Maquet Critical Care provided the ventilator and catheters for the study. This company was not involved in the result analysis and reporting.
Availability of data and materials
The data used and analyzed during the current study are available from the corresponding author on reasonable request.
Consent for publication
Written informed consent was obtained from the parents or legal tutor.
Ethics approval and consent to participate
The study protocol was approved by the local ethics committee (CHU Sainte‑ Justine, Montreal, QC, Canada). Written informed consent was obtained from the parents or legal tutor.
Funding
The study was supported by a Young Investigator Award of the Respiratory Health Network of the Fonds de la Recherche du Québec–Santé and by an
operating grant for applied clinical research of CHU Sainte‑Justine and Sainte‑ Justine Research Center.
Publisher’s Note
Springer Nature remains neutral with regard to jurisdictional claims in pub‑ lished maps and institutional affiliations.
Received: 12 May 2017 Accepted: 13 December 2017
References
1. Payen V, Jouvet P, Lacroix J, Ducruet T, Gauvin F. Risk factors associated with increased length of mechanical ventilation in children. Pediatr Crit Care Med. 2012;13(2):152–7.
2. Petrof BJ, Hussain SN. Ventilator‑induced diaphragmatic dysfunction: what have we learned? Curr Opin Crit Care. 2016;22(1):67–72. 3. Beck J, Reilly M, Grasselli G, Mirabella L, Slutsky AS, Dunn MS, et al.
Patient–ventilator interaction during neurally adjusted ventilatory assist in low birth weight infants. Pediatr Res. 2009;65(6):663–8.
4. de Wit M, Miller KB, Green DA, Ostman HE, Gennings C, Epstein SK. Inef‑ fective triggering predicts increased duration of mechanical ventilation. Crit Care Med. 2009;37(10):2740–5.
5. Thille AW, Rodriguez P, Cabello B, Lellouche F, Brochard L. Patient–ventila‑ tor asynchrony during assisted mechanical ventilation. Intensive Care Med. 2006;32(10):1515–22.
6. Colombo D, Cammarota G, Alemani M, Carenzo L, Barra FL, Vaschetto R, et al. Efficacy of ventilator waveforms observation in detecting patient– ventilator asynchrony. Crit Care Med. 2011;39(11):2452–7.
7. Blanch L, Villagra A, Sales B, Montanya J, Lucangelo U, Lujan M, et al. Asyn‑ chronies during mechanical ventilation are associated with mortality. Intensive Care Med. 2015;41(4):633–41.
8. Bosma K, Ferreyra G, Ambrogio C, Pasero D, Mirabella L, Braghiroli A, et al. Patient–ventilator interaction and sleep in mechanically ventilated patients: pressure support versus proportional assist ventilation. Crit Care Med. 2007;35(4):1048–54.
9. Kacmarek RM, Villar J, Blanch L. Cycle asynchrony: always a concern dur‑ ing pressure ventilation! Minerva Anestesiol. 2016;82(7):728–30. 10. Blokpoel RG, Burgerhof JG, Markhorst DG, Kneyber MC. Patient–ventilator
asynchrony during assisted ventilation in children. Pediatr Crit Care Med. 2016;17(5):e204–11.
11. Vignaux L, Grazioli S, Piquilloud L, Bochaton N, Karam O, Jaecklin T, et al. Optimizing patient–ventilator synchrony during invasive ventilator assist in children and infants remains a difficult task*. Pediatr Crit Care Med. 2013;14(7):e316–25.
12. Bordessoule A, Emeriaud G, Morneau S, Jouvet P, Beck J. Neurally adjusted ventilatory assist improves patient–ventilator interaction in infants as compared with conventional ventilation. Pediatr Res. 2012;72(2):194–202. 13. de la Oliva P, Schuffelmann C, Gomez‑Zamora A, Villar J, Kacmarek RM.
Asynchrony, neural drive, ventilatory variability and COMFORT: NAVA ver‑ sus pressure support in pediatric patients. A non‑randomized cross‑over trial. Intensive Care Med. 2012;38(5):838–46.
14. Ducharme‑Crevier L, Du Pont‑Thibodeau G, Emeriaud G. Interest of monitoring diaphragmatic electrical activity in the pediatric intensive care unit. Crit Care Res Pract. 2013;2013:384210.
15. Randolph AG, Wypij D, Venkataraman ST, Hanson JH, Gedeit RG, Meert KL, et al. Effect of mechanical ventilator weaning protocols on respiratory outcomes in infants and children: a randomized controlled trial. JAMA. 2002;288(20):2561–8.
16. Larouche A, Massicotte E, Constantin G, Ducharme‑Crevier L, Essouri S, Sinderby C, et al. Tonic diaphragmatic activity in critically ill children with and without ventilatory support. Pediatr Pulmonol. 2015;50:1304–12. 17. Ducharme‑Crevier L, Beck J, Essouri S, Jouvet P, Emeriaud G. Neurally adjusted ventilatory assist (NAVA) allows patient–ventilator synchrony during pediatric noninvasive ventilation: a crossover physiological study. Crit Care (London, England). 2015;19:44.
ventilator assist (NAVA) during non‑invasive ventilation (NIV) for respira‑ tory failure: systematic review and meta‑analysis. Intensive Care Med. 2016;42(11):1813–5.
19. Sinderby C, Liu S, Colombo D, Camarotta G, Slutsky AS, Navalesi P, et al. An automated and standardized neural index to quantify patient–ventila‑ tor interaction. Crit Care (London, England). 2013;17(5):R239.
20. Doorduin J, Sinderby CA, Beck J, van der Hoeven JG, Heunks LM. Assisted ventilation in patients with acute respiratory distress syndrome: lung‑ distending pressure and patient–ventilator interaction. Anesthesiology. 2015;123(1):181–90.
21. Doorduin J, Sinderby CA, Beck J, van der Hoeven JG, Heunks LM. Automated patient–ventilator interaction analysis during neurally adjusted non‑invasive ventilation and pressure support ventilation in chronic obstructive pulmonary disease. Crit Care (London, England). 2014;18(5):550.
22. Beck J, Tucci M, Emeriaud G, Lacroix J, Sinderby C. Prolonged neural expiratory time induced by mechanical ventilation in infants. Pediatr Res. 2004;55(5):747–54.
23. Vignaux L, Grazioli S, Piquilloud L, Bochaton N, Karam O, Levy‑Jamet Y, et al. Patient–ventilator asynchrony during noninvasive pressure support ventilation and neurally adjusted ventilatory assist in infants and children. Pediatr Crit Care Med. 2013;14(8):e357–64.
24. Piquilloud L, Vignaux L, Bialais E, Roeseler J, Sottiaux T, Laterre PF, et al. Neurally adjusted ventilatory assist improves patient–ventilator interac‑ tion. Intensive Care Med. 2011;37(2):263–71.
25. Azoulay E, Kouatchet A, Jaber S, Lambert J, Meziani F, Schmidt M, et al. Noninvasive mechanical ventilation in patients having declined tracheal intubation. Intensive Care Med. 2013;39(2):292–301.
26. Kim P, Salazar A, Ross PA, Newth CJ, Khemani RG. Comparison of tidal volumes at the endotracheal tube and at the ventilator. Pediatr Crit Care Med. 2015;16(9):e324–31.
27. Piastra M, De Luca D, Costa R, Pizza A, De Sanctis R, Marzano L, et al. Neu‑ rally adjusted ventilatory assist vs pressure support ventilation in infants recovering from severe acute respiratory distress syndrome: nested study. J Crit Care. 2014;29(2):312e1‑5.
28. Kallio M, Peltoniemi O, Anttila E, Pokka T, Kontiokari T. Neurally adjusted ventilatory assist (NAVA) in pediatric intensive care—a randomized controlled trial. Pediatr Pulmonol. 2015;50(1):55–62.
29. Richard JC, Lyazidi A, Akoumianaki E, Mortaza S, Cordioli RL, Lefebvre JC, et al. Potentially harmful effects of inspiratory synchronization during pressure preset ventilation. Intensive Care Med. 2013;39(11):2003–10. 30. Beck J, Emeriaud G, Liu Y, Sinderby C. Neurally adjusted ventilatory
assist (NAVA) in children: a systematic review. Minerva Anestesiol. 2016;82:874–83.
31. Emeriaud G, Larouche A, Ducharme‑Crevier L, Massicotte E, Flechelles O, Pellerin‑Leblanc AA, et al. Evolution of inspiratory diaphragm activ‑ ity in children over the course of the PICU stay. Intensive Care Med. 2014;40(11):1718–26.
32. Alander M, Peltoniemi O, Pokka T, Kontiokari T. Comparison of pressure‑, flow‑, and NAVA‑triggering in pediatric and neonatal ventilatory care. Pediatr Pulmonol. 2012;47(1):76–83.
33. Szczapa T, Beck J, Migdal M, Gadzinowski J. Monitoring diaphragm electrical activity and the detection of congenital central hypoventilation syndrome in a newborn. J Perinatol. 2013;33(11):905–7.
34. Liet JM, Dejode JM, Joram N, Gaillard Le Roux B, Pereon Y. Bedside diagnosis of bilateral diaphragmatic paralysis. Intensive Care Med. 2013;39(2):335.
35. Khemani RG, Smith LS, Zimmerman JJ, Erickson S. Pediatric acute respiratory distress syndrome: definition, incidence, and epidemiology: proceedings from the Pediatric Acute Lung Injury Consensus Conference. Pediatr Crit Care Med. 2015;16(5 Suppl 1):S23–40.
36. Levine S, Nguyen T, Taylor N, Friscia ME, Budak MT, Rothenberg P, et al. Rapid disuse atrophy of diaphragm fibers in mechanically ventilated humans. N Engl J Med. 2008;358(13):1327–35.
37. Jaber S, Petrof BJ, Jung B, Chanques G, Berthet JP, Rabuel C, et al. Rapidly progressive diaphragmatic weakness and injury during mechanical ventilation in humans. Am J Respir Crit Care Med. 2011;183(3):364–71. 38. Demoule A, Clavel M, Rolland‑Debord C, Perbet S, Terzi N, Kouatchet A,