ARTICLE
Systolic Blood Pressure in Childhood Predicts
Hypertension and Metabolic Syndrome Later in Life
Shumei S. Sun, PhDa, Gilman D. Grave, MDb, Roger M. Siervogel, PhDa, Arthur A. Pickoff, MDa,c, Silva S. Arslanian, MDd, Stephen R. Daniels, MDe
aLifespan Health Research Center, Department of Community Health, andcDepartment of Pediatrics, Wright State University Boonshoft School of Medicine, Dayton,
Ohio;bNational Institute of Child Health and Human Development, National Institutes of Health, Bethesda, Maryland;dDepartment of Pediatrics, University of Pittsburgh
School of Medicine, Pittsburgh, Pennsylvania;eDepartment of Pediatrics, University of Colorado, School of Medicine, Denver, Colorado
The authors have indicated they have no financial relationships relevant to this article to disclose.
ABSTRACT
OBJECTIVE.The goal was to link hypertension and the metabolic syndrome in adult-hood directly to blood pressures measured decades earlier for the same individuals as children and to establish criterion values for blood pressure that predict hyper-tension and the metabolic syndrome later in life.
METHODS.We analyzed serial data for 240 men and 253 women in the Fels Longi-tudinal Study. We derived age- and gender-specific childhood blood pressures that predict hypertension and the metabolic syndrome in adulthood, and we validated these criterion values in a larger sample.
RESULTS.Blood pressure diverged between adults with and without the metabolic syndrome beginning at age 5 for boys and age 8 for girls. The odds ratios for
developing hypertension atⱖ30 years of age ranged from 1.1 for 14- to
18-year-old boys to 3.8 for 5- to 7-year-18-year-old boys and from 2.7 for 8- to 13-year-18-year-old girls to 4.5 for 5- to 7-year-old girls, if their blood pressure exceeded criterion values at a single examination in childhood. The corresponding odds ratios for the metabolic syndrome, with or without hypertension, ranged from 1.2 for 14- to 18-year-old boys to 2.6 for 8- to 13-year-old boys and from 1.5 for 14- to 18-year-old girls to 3.1 for 5- to 7-year-old girls. The relative risk of adult hypertension ranged from 1.5 to 3.8 for boys and from 1.5 to 4.7 for girls, and that of the metabolic syndrome ranged from 1.1 to 1.8 for boys and from 1.2 to 5.6 for girls. These relative risks varied directly with the number of examinations at which systolic blood pressure exceeded criterion values.
CONCLUSION.Children with systolic blood pressures above the criterion values estab-lished in this longitudinal study are at increased risk of hypertension and the metabolic syndrome later in life.
www.pediatrics.org/cgi/doi/10.1542/ peds.2006-2543
doi:10.1542/peds.2006-2543
Key Words
childhood blood pressure, adult hypertension, metabolic syndrome Abbreviations
NCEP—National Cholesterol Education Program
ATP III—Adult Treatment Panel III NHANES—National Health and Nutrition Examination Survey
EBP— elevated blood pressure ROC—receiver operating characteristic HDL— high-density lipoprotein Accepted for publication Oct 12, 2006 Address correspondence to Shumei S. Sun, PhD, Department of Community Health, Wright State University Boonshoft School of Medicine, 3171 Research Blvd, Dayton, OH 45420. E-mail: shumei.sun@wright.edu
T
HE CLUSTER OFdyslipidemia, hypertension, andglu-cose intolerance defines the metabolic syndrome1in
adults and predicts the development of type 2 diabetes
and cardiovascular disease.2–4 The third report of the
National Cholesterol Education Program (NCEP) Expert Panel on Detection, Evaluation, and Treatment of High Blood Cholesterol in Adults (Adult Treatment Panel III [ATP III]) redefines this syndrome by including waist circumference as a proxy measure for visceral fat
accu-mulation.5 The ATP III further defines the metabolic
syndrome in adults as a cluster of 3, 4, or 5 risk factors that exceed criterion values, that is, waist circumference
of ⬎102 cm for men or ⬎88 cm for women; systolic
blood pressure of ⬎130 mm Hg and/or diastolic blood
pressure of⬎85 mm Hg; fasting plasma triglyceride level
of⬎150 mg/dL; fasting plasma high-density lipoprotein
(HDL) cholesterol level of⬍40 mg/dL for men or ⬍50
mg/dL for women; and fasting plasma glucose level of
⬎110 mg/dL.6 In 2003, the Expert Committee on the
Diagnosis and Classification of Diabetes Mellitus recom-mended lowering the criterion for impaired fasting
plasma glucose levels to 100 mg/dL.7There are 16
pos-sible clusters of the 5 risk factors combined in 3, 4, or 5 ways, including 10 triads, 5 tetrads, and 1 pentad. Four of these triads and 1 tetrad do not include elevated blood pressure (EBP). Among the participants in the Fels Lon-gitudinal Study who meet the ATP III criteria for diag-nosis of the metabolic syndrome, the most commonly encountered diagnostic triad for both men and women, namely, increased waist circumference, low fasting plasma HDL cholesterol level, and elevated fasting plasma triglyceride level, does not include EBP.
Currently, there is no agreement regarding the defi-nition of the metabolic syndrome in children or adoles-cents. Several investigators have selected various crite-rion values to estimate the prevalence of the metabolic syndrome in children and adolescents, on the basis of absolute values of fasting plasma triglyceride levels, fast-ing plasma HDL cholesterol levels, and fastfast-ing plasma glucose levels, coupled with age- and gender-specific
ⱖ90th percentile values for waist circumference and
blood pressure from National Health and Nutrition
Ex-amination Survey (NHANES) III.8–10However, it is more
informative to link the adult metabolic syndrome di-rectly to childhood risk factors in the same individuals, to establish criterion values according to age and gender that are associated with metabolic and cardiovascular health later in life.
Significant tracking of obesity and blood pressure
from childhood into adulthood has been observed,11–13
and the onset of obesity and hypertension often begins
in childhood.14However, little is known about the
accu-racy of age- and gender-specific cutoff values for blood pressure in childhood for predicting hypertension
(de-fined as systolic blood pressure of⬎130 mm Hg and/or
diastolic blood pressure of⬎85 mm Hg) and the
meta-bolic syndrome later in life, because of the paucity of serial data collected for the same individuals over several decades. Lacking such serial data, earlier studies were not capable of ascertaining the age in childhood when values for risk factors diverge between subjects who develop hypertension or the metabolic syndrome in adulthood and those who do not.
The present study identifies the earliest age of diver-gence of blood pressure in childhood among adults with the metabolic syndrome and age- and gender-matched adults without the metabolic syndrome. The present study also establishes age- and gender-specific criterion values of childhood blood pressure for predicting hyper-tension and the metabolic syndrome later in life and validates the predictiveness of these childhood criterion values independent of the effects of age when the met-abolic syndrome was first diagnosed and independent of childhood BMI.
METHODS
Study Sample
The 493 study participants were drawn from the Fels
Longitudinal Study population ⱖ20 years of age at the
time of analysis. The 493 participants included 240 men and 253 women who have been monitored since birth and have had serial blood pressure readings recorded
from age 2 into adulthood.15 Childhood measurements
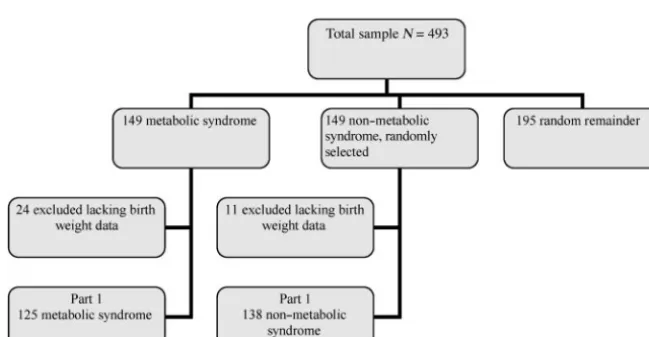
for these participants included weight; height; skinfold thicknesses; waist, arm, and leg circumferences; and blood pressure. These data were recorded during exam-inations at birth, at 1, 3, 6, 9, and 12 months, every 6 months to 18 years, and every 2 years thereafter. Addi-tional measurements were added to the examination protocol when these participants turned 8 years of age, including hydrodensitometry, dual-energy x-ray absorp-tiometry, fasting plasma lipid and lipoprotein measure-ments, fasting plasma glucose measurement, and fasting plasma insulin measurement. Approximately 8% of Fels Longitudinal Study participants have been lost to fol-low-up monitoring, but their anthropometric, meta-bolic, and cardiovascular data at the last visit did not differ from those of the 92% who remain in the study. There are 2 parts to this study. Part 1 is a retrospective cohort study of a discovery sample of 149 subjects (90
men and 59 women; 50⫾15 years and 49⫾16 years of
age, respectively) within the Fels Longitudinal Study population who met the NCEP ATP III criteria for the metabolic syndrome and 149 randomly selected men and women within the Fels Longitudinal Study popula-tion, matched for age and gender, who did not meet the ATP III criteria for the metabolic syndrome.
miss-ing data for birth weight. The remainmiss-ing subjects in-cluded 125 with the metabolic syndrome (75 men and 50 women) and 138 without the metabolic syndrome (83 men and 55 women). The 263 subjects had been examined an average of 37 times each during their years of participation in the Fels Longitudinal Study. Data from these 263 subjects were used to identify the age in childhood when blood pressure diverges between adults with and without the metabolic syndrome and to estab-lish age- and gender-specific criterion values for blood pressures in childhood that predict the metabolic syn-drome in adulthood.
In part 2, we validated the accuracy of the age- and gender-specific criterion values for blood pressure in childhood that we derived in part 1 in predicting hyper-tension and the metabolic syndrome later in life. We reviewed childhood blood pressure data in the validation sample of all 493 subjects to determine whether their blood pressures at any time in childhood exceeded the age- and gender-specific criterion values established in part 1. We then ascertained the prevalence of hyperten-sion and the metabolic syndrome, with or without hy-pertension, in the 493 subjects. We found that 118 of the 240 men and 86 of the 253 women had hypertension and 89 of the 240 men and 80 of the 253 women had the metabolic syndrome, with or without hypertension.
A flowchart depicting the origin of the discovery sam-ple in part 1 is shown in Fig 1. The validation samsam-ple in part 2 included all 493 subjects in the original total sample.
Measurement Protocols
Systolic and diastolic blood pressures were measured with a standard mercury sphygmomanometer every 6 months from age 2 through age 18 and every 2 years thereafter, by trained technicians, while the participants
were seated.15Three blood pressure measurements were
taken at each examination, and the mean of the last 2 readings was used in the analyses.
Birth weights were obtained from hospital records.
We assessed bone age, with the Fels Longitudinal Study method, from hand-wrist radiographs obtained at each
annual visit.16Relative bone age (bone age minus
chro-nological age) was used as a proxy for biological matu-rity. A positive relative bone age indicates accelerated maturity, which may hasten the appearance of risk fac-tors in childhood for the metabolic syndrome later in life. All procedures were approved by the institutional review board of Wright State University, and all partic-ipants provided written consent to join the Fels Longi-tudinal Study.
Statistical Analyses
Part 1: Discovery Sample Analysis
A random-effects model was used to analyze the
com-plete set of serial data simultaneously.17The model
im-puted missing values and included measurements made at various time intervals, as well as time-varying covari-ates, such as relative bone age, and non–time-varying covariates, such as birth weight. The random-effects model can be expressed asyijk⫽⫹␣i⫹j⫹␥ij⫹␦ijxijk
⫹ ⑀ijk,where yijk is the dependent variable (ie, serial
childhood blood pressure),idenotes the group variable
(adults with metabolic syndrome versus adults with
non–metabolic syndrome), j denotes the subject,k
de-notes the within-subject factor (age),xijkrepresents the
covariates of birth weight and relative bone age,⑀ijkis an
error term, and ␥ij is the age at which the dependent
variable differs significantly between the groups with and without the metabolic syndrome.
Annual age- and gender-specific least-squares means and SEs were estimated from the fitted ran-dom-effects models for blood pressure with adjust-ment for relative bone age and birth weight. The age-and gender-specific least-squares means were chosen as criterion values for blood pressures in childhood that were associated with hypertension and the met-abolic syndrome in adulthood.
FIGURE 1
Part 2: Validation Sample Analysis
Because blood pressure increases with age during child-hood and adolescence in a curvilinear, rather than in a linear, manner, we divided the childhood systolic blood pressure data for the 493 subjects in the validation sam-ple into 3 age intervals (5–7 years, 8 –13 years, and 14 –18 years of age). These 3 age intervals were chosen to reflect age-blood pressure interactions during the pre-pubertal, pre-pubertal, and postpubertal years. We used lo-gistic regression analysis to relate the first appearance of hypertension or the metabolic syndrome, with or
with-out hypertension, at ⱖ30 years of age to 3 childhood
predictors, that is, BMI; EBP, defined as a single mean elevated systolic blood pressure that exceeded age- and gender-specific criteria established in part 1 at any ex-amination within 1 of the 3 age intervals; and recurring EBP, expressed as the proportion of examinations within an age interval in childhood at which systolic blood pressure exceeded criterion values established in part 1. Logistic models were used for the 2 dependent variables, that is, adulthood hypertension and the metabolic syn-drome, with or without hypertension. We analyzed the effects of childhood EBP on hypertension and the met-abolic syndrome, with or without hypertension, inde-pendent of contemporaneous BMI and indeinde-pendent of the age at which hypertension was first diagnosed. The effects of recurrent EBP in childhood on hypertension and the metabolic syndrome, with or without hyperten-sion, in adulthood were also examined independent of contemporaneous BMI values and the age at which hy-pertension was first diagnosed. Analyses were per-formed with SAS software (version 9.0.1; SAS Institute, Cary, NC).
RESULTS
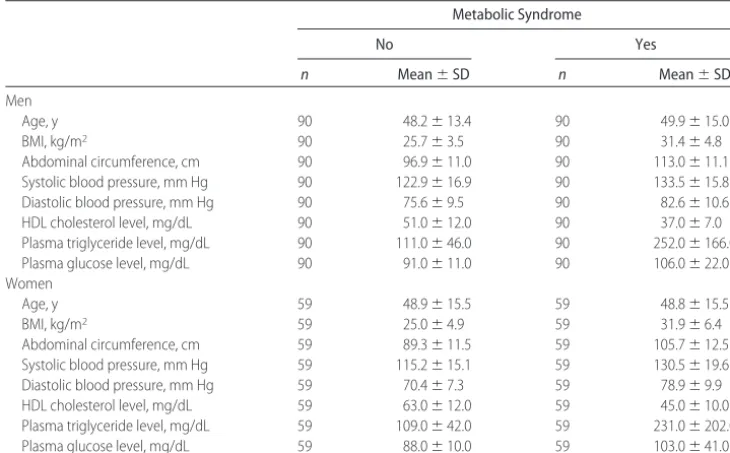
Part 1
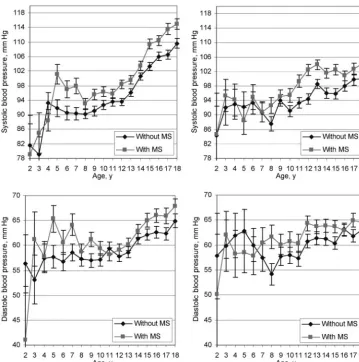
The sample characteristics for the 90 men and 59 women who met the NCEP ATP III criteria for the metabolic syndrome and equal numbers of randomly selected men and women matched for age who did not meet the ATP III criteria are presented in Tables 1 and 2. The random-effects models permitted the least-squares estimation of means and SDs for the annual childhood systolic and diastolic blood pressures from 2 to 18 years of age, with adjustment for birth weight and relative bone age, for men and women with and without the metabolic syn-drome (Fig 2). The random-effects models indicated that, independent of birth weight and relative bone age, the earliest significant difference in systolic blood pres-sure values between adults with and without the meta-bolic syndrome occurred at 5 years of age for boys and 8
years of age for girls (P⬍.05) (Fig 2). Men and women
with the metabolic syndrome had significantly higher childhood systolic blood pressures than did those
with-out the metabolic syndrome (P⬍.05).
Childhood diastolic blood pressure values were higher for boys and girls who later developed the met-abolic syndrome, compared with those who did not, but these differences were not statistically significant at any
age for either gender (P ⬎ .05). Therefore, the
subse-quent discussion is limited to predictive features of sys-tolic blood pressure only. The age- and gender-specific mean childhood systolic blood pressure values shown in Fig 2 for adults who met the ATP III criteria for 3, 4, or 5 risk factors for the metabolic syndrome were used as criterion values, and their accuracy for predicting
adult-TABLE 1 Adult Characteristics of the Retrospective Cohort Discovery Sample (Part 1) Metabolic Syndrome
No Yes
n Mean⫾SD n Mean⫾SD
Men
Age, y 90 48.2⫾13.4 90 49.9⫾15.0
BMI, kg/m2 90 25.7⫾3.5 90 31.4⫾4.8
Abdominal circumference, cm 90 96.9⫾11.0 90 113.0⫾11.1 Systolic blood pressure, mm Hg 90 122.9⫾16.9 90 133.5⫾15.8 Diastolic blood pressure, mm Hg 90 75.6⫾9.5 90 82.6⫾10.6 HDL cholesterol level, mg/dL 90 51.0⫾12.0 90 37.0⫾7.0 Plasma triglyceride level, mg/dL 90 111.0⫾46.0 90 252.0⫾166.0 Plasma glucose level, mg/dL 90 91.0⫾11.0 90 106.0⫾22.0 Women
Age, y 59 48.9⫾15.5 59 48.8⫾15.5
BMI, kg/m2 59 25.0⫾4.9 59 31.9⫾6.4
hood hypertension and the metabolic syndrome, with or without hypertension, was tested with the validation sample in part 2.
Birth weight did not exert a significant effect on child-hood systolic or diastolic blood pressure in boys or girls. Among children of the same ages, advanced bone age was associated with significantly higher systolic blood pressures of 1.9 mm Hg per year of advancement for
boys and 1.5 mm Hg per year of advancement for girls (P
⬍ .05). Advanced bone age was also associated with a
significantly higher diastolic blood pressure of 1.3 mm
Hg per year of advancement for girls (P⬍.05) and with
a nonsignificantly higher diastolic blood pressure of 0.4 mm Hg per year of advancement for boys.
Part 2
Adult Hypertension
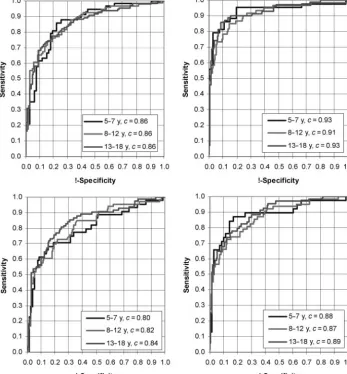
The sample characteristics for the 89 men and 80 women who met the NCEP ATP III criteria for the metabolic syndrome and for the 151 men and 173 women in the Fels Longitudinal Study sample who did not meet the ATP III criteria are presented in Table 3. Table 4 presents the results of a logistic model used to predict hyperten-sion in adulthood. The accuracy of the prediction was evaluated by using a receiver operating characteristic (ROC) curve (Fig 3). A ROC curve is a plot of the
true-positive rate (sensitivity) versus the false-positive
rate (1 ⫺ specificity). The closer the curve is to the
top-left border of the ROC space, the more accurate the logistic model is. The closer the curve is to the 45° diagonal of the ROC space, the less accurate the model is.
The area under the curve is denoted as thecstatistic and
is a measure of predictive accuracy. Thecstatistics were
0.86 for male subjects and 0.91 to 0.93 for female sub-jects, which indicates excellent predictive accuracy for
both genders. The highcstatistics demonstrate the ability
of the criterion values for childhood blood pressure es-tablished in part 1 to predict correctly the children who will become hypertensive as adults and those who will not.
Childhood BMI at any age interval did not contribute significantly to the metabolic syndrome, with or without hypertension, in men or women when childhood blood pressure was included in the models (Table 4). The odds
of developing hypertension atⱖ30 years of age for 5- to
18-year-old girls and 5- to 12-year-old boys with mean systolic blood pressure at any examination within an age interval that exceeded age- and gender-specific criterion values were 3 to 4 times greater than those for girls and boys in the same age intervals whose blood pressure measurements never exceeded these criterion values (Table 5).
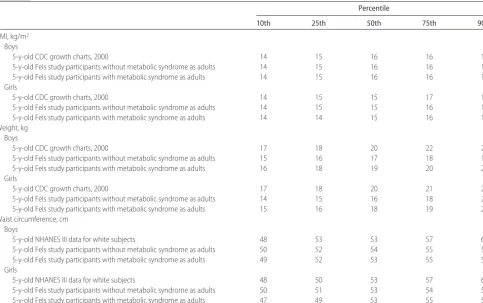
TABLE 2 Childhood Characteristics of the Retrospective Cohort Discovery Sample (Part 1)
Percentile
10th 25th 50th 75th 90th
BMI, kg/m2
Boys
5-y-old CDC growth charts, 2000 14 15 16 16 17
5-y-old Fels study participants without metabolic syndrome as adults 14 15 16 16 17 5-y-old Fels study participants with metabolic syndrome as adults 14 15 16 16 17 Girls
5-y-old CDC growth charts, 2000 14 15 15 17 19
5-y-old Fels study participants without metabolic syndrome as adults 14 15 15 16 17 5-y-old Fels study participants with metabolic syndrome as adults 14 14 15 16 17 Weight, kg
Boys
5-y-old CDC growth charts, 2000 17 18 20 22 23
5-y-old Fels study participants without metabolic syndrome as adults 15 16 17 18 19 5-y-old Fels study participants with metabolic syndrome as adults 16 18 19 20 22 Girls
5-y-old CDC growth charts, 2000 17 18 20 21 24
5-y-old Fels study participants without metabolic syndrome as adults 14 15 16 18 20 5-y-old Fels study participants with metabolic syndrome as adults 15 16 18 19 21 Waist circumference, cm
Boys
5-y-old NHANES III data for white subjects 48 53 53 57 61
5-y-old Fels study participants without metabolic syndrome as adults 50 52 54 55 57 5-y-old Fels study participants with metabolic syndrome as adults 49 52 53 55 57 Girls
5-y-old NHANES III data for white subjects 48 50 53 57 61
5-y-old Fels study participants without metabolic syndrome as adults 50 51 53 54 56 5-y-old Fels study participants with metabolic syndrome as adults 47 49 53 55 59
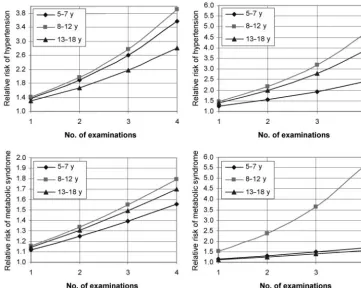
Boys of 5 to 18 years of age and girls of 8 to 18 years of age with recurring blood pressure measurements ex-ceeding criterion values had significantly greater risk of developing hypertension, compared with boys and girls of similar ages whose blood pressure values exceeded
the criterion values at only 1 examination (P⬍.05) (Fig
4). The relative risks of adult hypertension ranged from 1.5 to 3.8 for boys and from 1.5 to 4.7 for girls and varied directly with the proportion of examinations at which systolic blood pressure exceeded the criterion values (Fig 4).
Adult Metabolic Syndrome
Table 4 presents the results of a logistic model predicting the metabolic syndrome, with or without hypertension. The accuracy of the prediction was evaluated by using a
ROC curve (Fig 3). The cstatistics ranged from 0.80 to
0.84 for male subjects and from 0.87 to 0.89 for female
subjects. The high cstatistics demonstrate the ability of
the criterion values for childhood blood pressure estab-lished in part 1 to predict correctly adults with the met-abolic syndrome and adults without the metmet-abolic syn-drome. The risk of developing the metabolic syndrome
was significantly greater for boys with a mean systolic blood pressure at any examination at 8 to 12 years of age and for girls with a mean systolic blood pressure at any examination at 5 to 12 years of age that exceeded age-and gender-specific criterion values, compared with boys and girls in the same age intervals whose blood pressure measurements never exceeded the criterion
values (P⬍.05) (Tables 4 and 5). Childhood BMI at any
age interval did not contribute significantly to the adult-hood metabolic syndrome in men or women when childhood blood pressure was included in the models (Tables 4 and 5). Boys 13 to 18 years of age and girls 8 to
12 years of age with recorded blood pressures at ⬎1
examination that exceeded criterion values had signifi-cantly greater risk of developing the metabolic syndrome
(P⬍.05) than did boys and girls of the same age whose
blood pressure values exceeded criterion values at only 1 examination (Fig 4).
DISCUSSION
This study involves longitudinal modeling of long-term serial data collected from childhood into adulthood in the Fels Longitudinal Study, to link blood pressures in
FIGURE 2
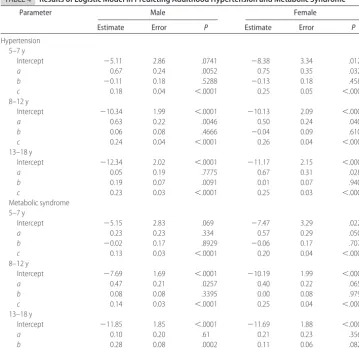
TABLE 4 Results of Logistic Model in Predicting Adulthood Hypertension and Metabolic Syndrome
Parameter Male Female
Estimate Error P Estimate Error P
Hypertension 5–7 y
Intercept ⫺5.11 2.86 .0741 ⫺8.38 3.34 .0121
a 0.67 0.24 .0052 0.75 0.35 .0325
b ⫺0.11 0.18 .5288 ⫺0.13 0.18 .4586
c 0.18 0.04 ⬍.0001 0.25 0.05 ⬍.0001
8–12 y
Intercept ⫺10.34 1.99 ⬍.0001 ⫺10.13 2.09 ⬍.0001
a 0.63 0.22 .0046 0.50 0.24 .0409
b 0.06 0.08 .4666 ⫺0.04 0.09 .6103
c 0.24 0.04 ⬍.0001 0.26 0.04 ⬍.0001
13–18 y
Intercept ⫺12.34 2.02 ⬍.0001 ⫺11.17 2.15 ⬍.0001
a 0.05 0.19 .7775 0.67 0.31 .0282
b 0.19 0.07 .0091 0.01 0.07 .9406
c 0.23 0.03 ⬍.0001 0.25 0.03 ⬍.0001
Metabolic syndrome 5–7 y
Intercept ⫺5.15 2.83 .069 ⫺7.47 3.29 .0229
a 0.23 0.23 .334 0.57 0.29 .0507
b ⫺0.02 0.17 .8929 ⫺0.06 0.17 .7077
c 0.13 0.03 ⬍.0001 0.20 0.04 ⬍.0001
8–12 y
Intercept ⫺7.69 1.69 ⬍.0001 ⫺10.19 1.99 ⬍.0001
a 0.47 0.21 .0257 0.40 0.22 .0654
b 0.08 0.08 .3395 0.00 0.08 .9798
c 0.14 0.03 ⬍.0001 0.25 0.04 ⬍.0001
13–18 y
Intercept ⫺11.85 1.85 ⬍.0001 ⫺11.69 1.88 ⬍.0001
a 0.10 0.20 .61 0.21 0.23 .3565
b 0.28 0.08 .0002 0.11 0.06 .082
c 0.14 0.02 ⬍.0001 0.23 0.03 ⬍.0001
The model equations were as follows: ln odds of adulthood hypertension⫽intercept⫹a(yes⫽1, no⫽0 childhood blood pressure exceeds criterion values)⫹b(childhood BMI)⫹c(age when adulthood hypertension first diagnosed) and ln odds of metabolic syndrome⫽intercept⫹
a(yes⫽1, no⫽0 chilhood blood pressure exceeds criterion values)⫹b(childhood BMI)⫹c(age when metabolic syndrome first diagnosed). TABLE 3 Sample Characteristics of the Validation Sample (Part 2)
Metabolic Syndrome
No Yes
n Mean⫾SD n Mean⫾SD
Men
Age, y 151 34.6⫾5.9 89 45.2⫾10.3
BMI, kg/m2 146 23.9⫾2.9 89 30.1⫾3.7
Abdominal circumference, cm 124 88.9⫾8.8 89 108.8⫾9.4 Systolic blood pressure, mm Hg 146 115.0⫾11.1 88 132.5⫾13.7 Diastolic blood pressure, mm Hg 146 72.3⫾9.2 88 84.0⫾9.6 HDL cholesterol level, mg/dL 116 51.4⫾11.8 89 38.2⫾7.7 Plasma triglyceride level, mg/dL 116 110.4⫾65.0 89 241.9⫾160.7 Plasma glucose level, mg/dL 81 89.7⫾10.2 72 101.8⫾18.2 Women
Age, y 173 34.0⫾4.8 80 47.3⫾11.1
BMI, kg/m2 166 23.2⫾4.2 80 29.8⫾5.9
childhood to hypertension and the metabolic syndrome in adulthood. The age-matched retrospective cohort study design eliminates the effect of age differences in
the prevalence of the metabolic syndrome.18This is the
first report of direct relationships between childhood blood pressure and hypertension and the metabolic syn-drome in adulthood. These relationships can be revealed only through analysis of long-term serial data.
The age- and gender-specific criterion values we es-tablished in part 1 predicted hypertension and the met-abolic syndrome, with or without hypertension, later in life. The relative risk of adult hypertension for children with repeated measurements of systolic blood pressure exceeding criterion values was greater for 5- to 7-year-old children than for 7-year-older children and adolescents. This observation suggests that prevention of adult hyperten-sion should begin as early as 5 years of age and that prevention and intervention programs may be more ef-fective for 5- to 7-year-old children than for older chil-dren.
Although blood pressure has been found to be
ele-vated in association with increased BMI in childhood,19
in this study we found that childhood BMI values did not contribute significantly to adult hypertension or the
TABLE 5 Odds Ratios for Hypertension and Metabolic Syndrome at
>30 Years of Age (Adjusted for Adult Age and Childhood
BMI), Given a Systolic Blood Pressure Exceeding Criterion Values at a Single Examination in Childhood
EBP (Yes/No) Odds Ratio (95% Confidence Interval)
Male Female
Hypertension
5–7 y 3.8 (1.5–9.7)a 4.5 (1.1–17.7)a
8–13 y 3.5 (1.5–8.3)a 2.7 (1.0–7.1)a
14–18 y 1.1 (0.5–2.4) 3.8 (1.2–12.7)a
Metabolic syndrome
5–7 y 1.6 (0.6–3.9) 3.1 (1.0–9.7)a
8–13 y 2.6 (1.1–5.9)a 2.2 (1.0–5.2)a
14–18 y 1.2 (0.6–2.6) 1.5 (0.6–3.7)
EBP indicates elevated blood pressure at a single examination in childhood that exceeded age-and gender-specific criteria established in part 1; hypertension, systolic blood pressure of⬎130 mm Hg and/or diastolic blood pressure of⬎85 mm Hg.
aValue is significant atP⬍.05. FIGURE 3
ROC curves predicting adulthood hyper-tension (upper) and metabolic syn-drome (lower) from blood pressure in childhood for boys (left) and girls (right).
metabolic syndrome independent of childhood blood pressure. In the present study sample, the age-specific correlations between BMI and systolic blood pressure ranged from 0.26 to 0.48 for boys and from 0.20 to 0.56
for girls, and increases in childhood BMI of 1 kg/m2
resulted in average increases in systolic blood pressure of
1.0⫾0.2 mm Hg for boys and 0.8⫾0.2 mm Hg for girls.
Therefore, the effects of childhood BMI on adulthood hypertension and the metabolic syndrome seem to be mediated by childhood blood pressure.
Birth weight and relative bone age were included in the longitudinal models as covariates. Birth weight has
been reported to affect adulthood blood pressure,20and
advanced maturation, assessed as relative bone age, is
associated with EBPs in childhood.19,21In this study, we
found no effect of birth weight on blood pressure in adulthood, but we did observe that advanced matura-tion, assessed as relative bone age, was associated with EBPs in childhood. This association may reflect the
in-fluence of obesity on early maturation.22
The age- and gender-specific values for systolic blood pressure among children in the Fels Longitudinal Study who subsequently developed hypertension and the met-abolic syndrome are similar to the mean values gener-ated with the cross-sectional data for white children in
the Bogalusa Heart Study23and are lower than the
cor-responding mean values for children in the NHANES in
1999 to 2000.24Age- and gender-specific values for
sys-tolic blood pressure in childhood among adults with hypertension and the metabolic syndrome were slightly
below the 50th percentile for systolic blood pressure of children of median height whose data were included in theFourth Report on the Diagnosis, Evaluation, and Treat-ment of High Blood Pressure in Children and Adolescents.25
The discrepancy between our data and the NHANES 1999/2000 data may be explained by our adjustment for relative bone age and by the habituation associated with the collection of serial measurements in the Fels
Longi-tudinal Study.19Our data indicate that, to remain free of
hypertension or the metabolic syndrome, with or with-out hypertension, childhood blood pressures should re-main below the 50th percentile for age and gender, as
indicated in the Fourth Report.25 If mean systolic blood
pressure readings exceed age- and gender-specific crite-rion values (presented graphically in Fig 2) at any ex-amination from 5 years to 18 years of age for boys or from 8 years to 18 years of age for girls, then the child or adolescent has an increased risk of developing the met-abolic syndrome, with or without hypertension, as an adult.
Ideally, for validation of the predictive accuracy of the criterion values established in part 1, another indepen-dent sample would have been studied. However, such a sample would require access to serial data collected from childhood into adulthood for the same individuals and is not available. Therefore, data from the 205 subjects an-alyzed in part 1 were included in the final validation sample of 493 subjects. This approach avoids the need to split the data set arbitrarily into a model-fitting discovery sample and a validation sample.
FIGURE 4
There was a significant increase in the prevalence of childhood obesity in the US population from 1963 to
1991.26A secular trend toward higher blood pressure in
children has also been reported.24The Fels Longitudinal
Study participants in this study were born between 1930 and 1983. Among the annual cohorts in the Fels Longi-tudinal Study, we have observed increased BMI values over the past 20 years (S.S.S., unpublished data, 2006). However, a significant secular trend toward higher blood pressure has not been observed for the Fels Longitudinal Study subjects. The Fels Longitudinal Study population was drawn from southwestern Ohio, and participants in the Fels Longitudinal Study are nearly all non-Hispanic white. Therefore, our findings may not be applicable to other races and ethnicities.
The ability to predict adult hypertension and the met-abolic syndrome by measuring levels of blood pressure in childhood as early as 5 years of age is of clinical and public health importance. Such prediction might signal the need for corrective interventions that could be made during childhood. This approach is preferable to waiting until adulthood, when the deleterious clustering of risk factors has been established and when lifestyle changes are difficult to implement.
ACKNOWLEDGMENTS
This work was supported by grants DK 071485, HL 072838, and HD 12252 from the National Institutes of Health (Bethesda, MD).
REFERENCES
1. Reaven G. Banting Lecture 1988: role of insulin resistance in human disease.Diabetologia.1988;30:1595–1607
2. Meigs JB, Wilson PWF, Nathan DM, D’Agostino RB, Williams K, Haffner SM. The metabolic syndrome: prevalence and char-acteristics of the metabolic syndrome in the San Antonio Heart and Framingham Offspring Studies. Diabetes. 2003;52: 2160 –2167
3. Alexander CM, Landsman PH, Teutsch SM, Haffner SM. NCEP-defined metabolic syndrome, diabetes, and prevalence of cor-onary heart disease among NHANES III participants age 50 years and older.Diabetes.2003;52:1210 –1214
4. Rutter MK, Meigs JB, Sullivan LM, D’Agostino RB, Wilson PW. Insulin resistance, the metabolic syndrome, and incident car-diovascular events in the Framingham Offspring Study. Diabe-tes.2005;54:3252–3257
5. Expert Panel on the Detection, Evaluation, and Treatment of High Blood Cholesterol in Adults.Third Report of the National Cholesterol Education Program Expert Panel on Detection, Evalua-tion, and Treatment of High Blood Cholesterol in Adults (Adult Treatment Panel III). Bethesda, MD: National Institutes of Health; 2001. National Institutes of Health publication 01-3670 6. Expert Panel on the Detection, Evaluation, and Treatment of High Blood Cholesterol in Adults. Executive summary of the third report of the National Cholesterol Education Program (NCEP) Expert Panel on Detection, Evaluation, and Treatment of High Blood Cholesterol in Adults (Adult Treatment Panel III).JAMA.2001;285:2486 –2497
7. Kahn R. Follow-up report on the diagnosis of diabetes mellitus:
the Expert Committee on the Diagnosis and Classification of Diabetes Mellitus.Diabetes Care.2003;26:3160 –3167
8. Cook S, Weitzman M, Auinger P, Nguyen M, Dietz WH. Prev-alence of a metabolic syndrome phenotype in adolescents.Arch Pediatr Adolesc Med.2003;137:821– 827
9. Cruz ML, Goran MI. The metabolic syndrome in children and adolescents.Curr Diabetes Rep.2004;4:53– 62
10. Weiss R, Dziura J, Burgert T. Obesity and metabolic syndrome in children and adolescents.N Engl J Med.2004;350:2362–2374 11. Guo SS, Chumlea WC, Roche AF, Siervogel RM. Age- and maturity-related changes in body composition during adoles-cence into adulthood: the Fels Longitudinal Study.Int J Obesity. 1997;21:1167–1175
12. Guo SS, Huang C, Maynard LM, et al. BMI during childhood, adolescence, and young adulthood in relation to adult over-weight and adiposity: the Fels Longitudinal Study.Int J Obesity. 2000;24:1628 –1635
13. Beckett LA, Rosner B, Roche AF, Guo SS. Serial changes in blood pressure from adolescence into adulthood.Am J Epide-miol.1992;135:1166 –1177
14. Berenson GS, Srinivasan SR, Bao W, Newman WP III, Tracy RE, Wattingney WA. Association between multiple cardiovas-cular risk factors and atherosclerosis in children and young adults.N Engl. J Med.1998;338:1650 –1656
15. Roche AF. Growth, Maturation and Body Composition: The Fels Longitudinal Study 1929 –1991. Cambridge, United Kingdom: Cambridge University Press; 1992
16. Roche AF, Chumlea WC, Thissen D.Assessing the Skeletal Ma-turity of the Hand-Wrist: Fels Method. Springfield, IL: Charles C. Thomas; 1988
17. Laird NM, Ware JH. Random-effects models for longitudinal data.Biometrics.1982;38:963–974
18. Ford ES, Giles WH, Dietz WH. Prevalence of the metabolic syn-drome among US adults: findings from the Third National Health and Nutrition Examination Survey.JAMA.2002;283:356 –359 19. Guo SS, Wisemandle WA, Chumlea WC, Roche AF, Siervogel
RM. Serial changes in blood pressure from childhood into young adulthood for females in relation to body mass index and maturational age.Am J Hum Biol.1998;10:589 –598 20. Pharoah POD, Stevenson CJ, West CR. Association of blood
pressure in adolescence with birthweight.Arch Dis Child Fetal Neonatal Ed.1998;79:F114 –F118
21. Remsberg KE, Demerath EW, Schubert CM, Chumlea WC, Sun SS, Siervogel RM. Early menarche and the development of car-diovascular disease (CVD) risk factors in adolescent girls: the Fels Longitudinal Study.J Clin Endocrinol Metab.2005;90:2718 –2724 22. Must A, Naumova E, Phillips S, Blum M, Dawson-Hughes B, Rand W. Childhood overweight and maturational timing in the development of adult overweight and fatness: the Newton Girls Study and its follow-up.Pediatrics.2005;116:620 – 627 23. Voors A, Foster T, Frerichs R, Webber L, Berenson G. Studies of
blood pressures in children, ages 5–14 years, in a total biracial community: the Bogalusa Heart Study. Circulation. 1976;54: 319 –327
24. Muntner P, He J, Cutler JA, Wildman RP, Whelton PK. Trends in blood pressure among children and adolescents. JAMA. 2004;291:2107–2113
DOI: 10.1542/peds.2006-2543
2007;119;237
Pediatrics
Arslanian and Stephen R. Daniels
Shumei S. Sun, Gilman D. Grave, Roger M. Siervogel, Arthur A. Pickoff, Silva S.
Syndrome Later in Life
Systolic Blood Pressure in Childhood Predicts Hypertension and Metabolic
Services
Updated Information &
http://pediatrics.aappublications.org/content/119/2/237
including high resolution figures, can be found at:
References
http://pediatrics.aappublications.org/content/119/2/237#BIBL
This article cites 22 articles, 7 of which you can access for free at:
Subspecialty Collections
http://www.aappublications.org/cgi/collection/cardiology_sub Cardiology
ub
http://www.aappublications.org/cgi/collection/metabolic_disorders_s Metabolic Disorders
http://www.aappublications.org/cgi/collection/endocrinology_sub Endocrinology
following collection(s):
This article, along with others on similar topics, appears in the
Permissions & Licensing
http://www.aappublications.org/site/misc/Permissions.xhtml
in its entirety can be found online at:
Information about reproducing this article in parts (figures, tables) or
Reprints
http://www.aappublications.org/site/misc/reprints.xhtml
DOI: 10.1542/peds.2006-2543
2007;119;237
Pediatrics
Arslanian and Stephen R. Daniels
Shumei S. Sun, Gilman D. Grave, Roger M. Siervogel, Arthur A. Pickoff, Silva S.
Syndrome Later in Life
Systolic Blood Pressure in Childhood Predicts Hypertension and Metabolic
http://pediatrics.aappublications.org/content/119/2/237
located on the World Wide Web at:
The online version of this article, along with updated information and services, is
by the American Academy of Pediatrics. All rights reserved. Print ISSN: 1073-0397.