IN VITRO RELEASE KINETICS STUDY AND OPTIMIZATION OF AMBROXOL HCl 75 MG MATRIX TABLETS USING RESPONSE SURFACE METHODOLOGY
8
0
0
Full text
(2) Md. Mizanur Rahman Moghal et al. IRJP 2012, 3 (5) MATERIALS AND METHODS Materials Ambroxol hydrochloride was obtained from Alchymars ICM SM Pvt.Ltd., India, Hydroxy propyl methylcellulose (Methocel K4M) was a gift sample received from colorcon Asia Pvt.Limited. Microcrystalline Cellulose (MCC) and PVP K30 (polyvinyl pyrrolidone K30) were purchased from Ming Tai Chemical Co.Ltd., Taiwan. Magnesium stearate was procured from Hanua Chemicals Limited, Japan. Preparation of matrix tablets This method of tablet production has previously been described by several authors10,11 that provided reproducible experimental results in terms of in vitro release. Drug, polymer and other excipients were weighed separately for 20 tablets per formulation as per proposed formulations (table: 1). The proposed formulations were coded as K4M1, K4M2, K4M3, K4M4, K4M5, K4M6, K4M7, K4M 8, K4M9, K4M10, K4M11, K4M12 and K4M13. The amounts of drug and excipients are expressed in milligram. Then active ingredient, microcrystalline cellulose (MCC), PVP K-30, and polymer were blended for 20 minutes and then magnesium stearate was added and further blended for another 2 minutes. Blended mass was taken in the hopper and then die and punch were adjusted to get the desired weight of the tablet (600 mg). The tablets were prepared by direct compression using a Perkin-Elmer laboratory hydraulic press equipped with a 11.7 mm flat faced punch and die set. Tablet assay and physical evaluation The tablets of the proposed formulations (K4M1 to K4M13) were evaluated for hardness, weight variation, thickness, friability and drug content. Hardness of the tablets was tested using a hand operated Monsanto hardness tester. Friability of the tablets was determined in a Roche friabilator (Campbell Electronics, Mumbai). The thickness of the tablets was measured by vernier calipers. Weight variation test was performed according to the official method. Drug content for Ambroxol hydrochloride was carried out by measuring the absorbance of the sample at 244.5 nm using Shimadzu 1240 UV spectrophotometer and comparing the content from a calibration curve prepared with standard Ambroxol hydrochloride in the same medium. Design of experiment A 23 factorial (central composite) design with α=1 was employed as per the standard protocol12, 13. The amounts of HPMC K15M (X1) and PVP K 30 (X2) were selected as the factors, studied at 3 levels each. The central point (0, 0) was studied in quintuplicate. The range of HMPC K4M (30-90 mg) and PVPK30 (0-30 mg) was selected based on preformulation trial to prepare 600 mg ambroxol HCl sustained release tablet. All other formulation and processing variables were kept invariant throughout the study. Tables (23) summarize an account of the 13 experimental runs studied, their factor combinations and the translation of the coded levels to the experimental units employed during the study. Amount of drug released in 1 hour (rel1hr) (Y1), % of drug released in 4 hour (rel4hr) (Y2), % of drug released in 8 hour (rel8hr) (Y3), time to 50% drug release (t50%) (Y4) and MDT (Y5) were taken as the response variables. The response surface graphs and mathematical models were obtained by Design Expert® 7.0 (Statease, USA) software. In vitro dissolution study of tablets Dissolution studies were conducted for a period of 8 hours according to USP method (USP XXII) using apparatus II at a speed of 100rpm and the temperature was maintained at 37 ± 0.5° C. The dissolution studies were carried out in triplicate. in 900 ml 0.1 N HCl for 2 hours followed by 900 ml phosphate buffer (pH 6.8) for subsequent 6 hours. At every 1hour interval samples of 10 ml were withdrawn from the dissolution medium and replaced with fresh medium to maintain the volume constant. After filtration and appropriate dilution, the sample solution was analyzed at 244.5 nm by a UV spectrophotometer (UV-1601, Shimadzu, Japan). The amounts of drug present in the samples were calculated with the help of appropriate calibration curves constructed from reference standards. Drug dissolved at specified time periods was plotted as percent release versus time (hours) curve. Kinetic analysis of release data Different kinetic models (zero-order, first-order, Higuchi’s and korsmeyer’s) were applied to interpret the release profile from matrix system. The best fit with higher correlation (R2>0.99) was found with the Higuchi’s equation. However, two factors diminish the applicability of Higuchi’s equation to matrix systems. This model fails to allow the influence of swelling of the matrix (upon hydration) and gradual erosion of the matrix. Therefore, the dissolution data were also fitted according to the well-known exponential equation (Korsmeyer equation), Eq. (1), which is often used to describe the drug release behavior from polymeric systems14. Log ( Mt / Mf ) = Log k + n Log t …………. (1) Where, Mt is the amount of drug release at time t; Mf is the amount of drug release after infinite time; k is a release rate constant incorporating structural and geometric characteristics of the tablet; and n is the diffusional exponent indicative of the mechanism of drug release. Talukder et al applied this equation to evaluate the drug release mechanism from xanthan gum matrix tablets15. To clarify the release exponent for different batches of matrix tablets, the log value of percentage drug dissolved was plotted against log time for each batch according to the equation 1. A value of n = 0.45 indicates Fickian (case I) release; >0.45 but <0.89 for non-Fickian (anomalous) release; and >0.89 indicates super case II type of release. Case II generally refers to the erosion of the polymeric chain and anomalous transport (non-Fickian) refers to a combination of both diffusion and erosion controlled-drug release16. Mean dissolution time (MDT) was calculated from dissolution data using the following equation (Mockel and Lippold)17. MDT=( n / n+1 ).k -1/n ……………. (2) Analysis of similarity For every point of observed/predicted drug release profiles for optimal formulation, difference (f1) and similarity (f2 ) factors were calculated. According to the US Food and Drug Administration’s guide for industry18generally f1 values up to 15 (0-15) and f2 values greater than 50 ensures sameness of the two curves. The value is determined by the following equation:. (6) Where n is the number of dissolution sample times, and Rt and Tt are the individual percentages dissolved at each time point t for the reference and test dissolution profiles respectively. RESULTS AND DISCUSSION Physical Evaluation of Ambroxol HCl matrix tablets The tablets of the proposed formulations (K4M1 to K4M13) were subjected to various evaluation tests such as thickness, hardness, uniformity of weight, drug content, and friability. Page 166.
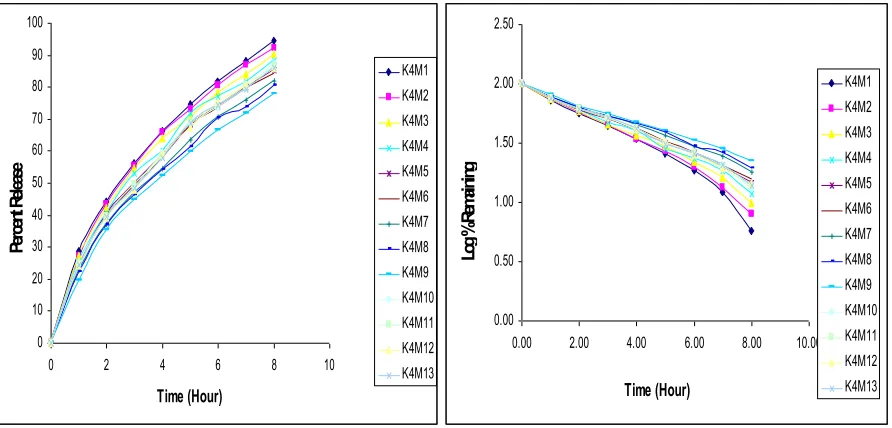
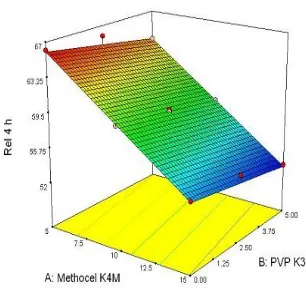
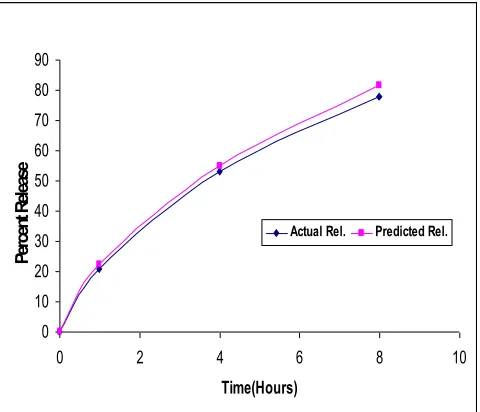
(3) Md. Mizanur Rahman Moghal et al. IRJP 2012, 3 (5) The thickness of the tablets ranged from 3.41 to 3.54 mm. The hardness and percentage friability of the tablets of all batches ranged from 7.21 to 7.98 kg/cm2 and 0.01 to 0.03%, respectively. The average percentage deviation of 20 tablets of each formula was less than ±5%. Drug content among different batches of tablets ranged from 97.13 to 100.03%. Thus, all the physical parameters of the matrices were practically within control. Effect of Methocel K4M on release pattern of Ambroxol Hydrochloride matrix tablets For this experiment, different Methocel K4M matrix tablets containing ambroxol hydrochloride as active ingredient were prepared according to formulation shown in table 1. The prepared tablets were subjected to in vitro dissolution studies in paddle method at 100 rpm in 900ml, 0.1N HCl medium at 370 c (± 0.50c) for 2 hours followed by 900 ml, phosphate buffer (pH 6.8) medium for another 6 hours at 370c (±0.50c). Three tablets from each formulation were used for the dissolution study. The release profile of Ambroxol HCl was monitored up to 8 hours. To determine the effects of polymers on drug release, different kinetic models such as Zero order, First order, Korsmeyer, Higuchi were investigated. The zero order, First order, Higuchi and Korsmeyer release patterns are shown in figure 1(A-D). The percent of drug release from these 13 formulations at different time intervals is shown in the table 4. From the graphs, a release profile of ambroxol HCl containing Methocel K4M matrix tablet of 13 formulations was obtained. The total % of ambroxol HCl release from the formulation K4M1, K4M2, K4M3, K4M4, K4M5, K4M6, K4M7, K4M 8, K4M9, K4M10, K4M11, K4M12 and K4M13 were 94.35%, 92.14%,90.22% 88.24%, 85.41%, 84.26%,81.85%, 80.53%, 77.99%, 87.06%, 86.42%, 85.89%, 86.14% respectively. It has been observed that the release rate has been declined with the increase of polymer content. The highest percent of drug release within 8 hours is obtained from K4M1 where polymer content is 5%. But in K4M9, the polymer content is 15% , the release of drug is minimum 77.99 % within 8 hours. The rate of drug release was found to be inversely related to the amount of Methocel K4M present in the matrix structure, i.e. the drug release increased with decrease in the polymer content of the matrix tablet. This is due to the formation of gel barrier of the hydrophilic HPMC polymer. Elevating the concentration of HPMC may result increased tortuosity or gel strength of the polymer. When HPMC polymer is exposed to aqueous medium, it undergoes rapid hydration and chain relaxation to form viscous gelatinous layer (gel layer). This is an agreement with the literature19,20 findings that the viscosity of the gel layer around the tablet increases with increase in the hydrogel concentration, thus limiting the release of the active ingredient. Failure to generate a uniform and coherent gel may cause rapid drug release.. In this experiment, the release kinetics data (table 5) were treated according to Higuchi’s and Korsmeyer et al.’s equations. The in vitro release profiles of drug from all these formulations could be best expressed by Higuchi’s equation, as the plots showed high linearity ( R2: 0.992~0.997). From Higuchi model, it is evident that Ambroxol hydrochloride is released by diffusion process. To confirm the diffusion mechanism, the data were fitted into Korsmeyer’s equation. The formulations showed good linearity (R2: 0.990~0.998), with slope (n) values ranging from 0.546-0.615. This n value appears to indicate a coupling of diffusion and erosion mechanism (known as anomalous non-Fickian diffusion). The drug release also fitted first order kinetic model to high extent. It indicates the drug release is dependent on the concentration of Ambroxol hydrochloride. The mean dissolution time (MDT) of K4M9 formulation figure 1(E) is highest (4.38 hrs), which means it can retard drug release most effectively.The values of t50% figure 1(F) enhanced markedly from 2.55 hrs, observed at low levels of both the variables, to as high as 3.82 hrs, observed at high levels of both the variables. This finding indicated considerable release retarding potential of the polymer and binder. To determine possible interaction of two polymers a response surface study was also done. The drug release percentages at 1hr, 4hrs, 8 hrs, t50% and MDT were selected as responses(table 4). These time periods are selected to detect any initial burst effect, t50% and t90%. From multiple regression analysis (table 6), it was found that Methocel K4M (X1) was responsible for reducing drug release significantly (p<0.05) at 1, 4 and 8 hours. No Interaction between Methocel K4M and PVP K 30 was found regarding drug release. It was also found that PVP K 30 (X2) was responsible for reducing drug release significantly (p<0.05) at 1, 4 and 8 hours. Optimization Figure 2 (A to E) shows the three-dimensional diagrams of each response variable as a function of HPMC K4M and PVP K30 obtained by using RSM. The model was optimized by choosing optimum formulation based on predetermined criteria of release profile. The target release profile was selected as 24%, 54% and 76% in 1h, 4h and 8 h respectively. The range of Methocel K4 M and PVP K 30 was set at 5-15% and 0-5% respectively. The optimization was carried out in Design Expert® 7.0 software. Out of 39 solutions suggested by the software, the solution having highest desirability was selected. Tablets were prepared using 13.38% w/w Methocel K4M and 3.06% w/w PVP K 30 respectively. Other excipients used were same as table-1. Tablets were prepared by direct compression method. The dissolution of optimized formulation was carried out by the method described in “Materials and Method” section. The f1 and f2 values were also calculated for each time point. The predicted and actual release were almost same (f1≥5 andf2≥86, Fig.:3).. Page 167.
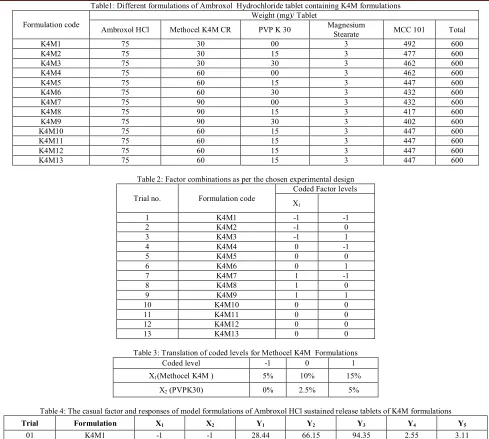
(4) Md. Mizanur Rahman Moghal et al. IRJP 2012, 3 (5) Formulation code K4M1 K4M2 K4M3 K4M4 K4M5 K4M6 K4M7 K4M8 K4M9 K4M10 K4M11 K4M12 K4M13. Table1: Different formulations of Ambroxol Hydrochloride tablet containing K4M formulations Weight (mg)/ Tablet Magnesium Ambroxol HCl Methocel K4M CR PVP K 30 MCC 101 Stearate 75 30 00 3 492 75 30 15 3 477 75 30 30 3 462 75 60 00 3 462 75 60 15 3 447 75 60 30 3 432 75 90 00 3 432 75 90 15 3 417 75 90 30 3 402 75 60 15 3 447 75 60 15 3 447 75 60 15 3 447 75 60 15 3 447 Table 2: Factor combinations as per the chosen experimental design Coded Factor levels Trial no. Formulation code X1 1 2 3 4 5 6 7 8 9 10 11 12 13. K4M1 K4M2 K4M3 K4M4 K4M5 K4M6 K4M7 K4M8 K4M9 K4M10 K4M11 K4M12 K4M13. -1 -1 -1 0 0 0 1 1 1 0 0 0 0. Total 600 600 600 600 600 600 600 600 600 600 600 600 600. X 2. -1 0 1 -1 0 1 -1 0 1 0 0 0 0. Table 3: Translation of coded levels for Methocel K4M Formulations Coded level -1 0 1 X1(Methocel K4M ). 5%. 10%. 15%. X2 (PVPK30). 0%. 2.5%. 5%. Table 4: The casual factor and responses of model formulations of Ambroxol HCl sustained release tablets of K4M formulations Trial. Formulation. X1. X2. Y1. Y2. Y3. Y4. Y5. 01 02 03 04 05 06 07 08 09 10 11 12 13. K4M1 K4M2 K4M3 K4M4 K4M5 K4M6 K4M7 K4M8 K4M9 K4M10 K4M11 K4M12 K4M13. -1 -1 -1 0 0 0 1 1 1 0 0 0 0. -1 0 1 -1 0 1 -1 0 1 0 0 0 0. 28.44 27.02 26.91 25.39 24.32 24.13 22.88 22.15 19.54 25.05 24.15 23.99 24.31. 66.15 65.83 63.73 60.05 58.93 57.99 54.53 54.14 52.38 59.31 58.44 59.05 57.89. 94.35 92.14 90.22 88.24 85.41 84.26 81.85 80.53 77.99 87.06 86.42 85.89 86.14. 2.55 2.66 2.75 2.92 3.10 3.16 3.44 3.54 3.82 3.10 3.11 3.16 3.14. 3.11 3.20 3.35 3.49 3.69 3.76 4.07 4.19 4.38 3.70 3.68 3.72 3.72. X1 and X2 are the amount of Mehocel K4M and PVP K 30 respectively. The formulations are according to table 1. Y: responses, the release percent at 1 h(Y1), 4 h (Y2), 8 h (Y3), T 50%(Y4) and MDT (Y5).. Page 168.
(5) Md. Mizanur Rahman Moghal et al. IRJP 2012, 3 (5) Table 5: Release kinetics of Ambroxol HCl matrix tablets of K4M formulations Zero Order. Code K4M1 K4M2 K4M3 K4M4 K4M5 K4M6 K4M7 K4M8 K4M9 K4M10 K4M11 K4M12 K4M13. First Order. n. 0.997. 34.091. 0.998. 0.574. -0.130. 0.996. 33.652. 0.995. 0.588. 0.987. -0.118. 0.994. 31.304. 0.996. 0.577. 10.220. 0.992. -0.110. 0.994. 32.157. 0.994. 0.596. 0.937. 9.921. 0.996. -0.100. 0.995. 31.167. 0.995. 0.599. 0.938. 9.844. 0.998. -0.097. 0.995. 30.904. 0.996. 0.600. 0.946. 9.487. 0.996. -0.088. 0.994. 29.654. 0.997. 0.606. 0.944. 9.306. 0.994. -0.084. 0.994. 29.109. 0.995. 0.609. 0.947. 9.104. 0.997. -0.079. 0.992. 28.401. 0.990. 0.646. 0.944. 10.012. 0.987. -0.103. 0.994. 31.324. 0.998. 0.596. 0.944. 10.012. 0.993. -0.103. 0.994. 31.494. 0.996. 0.609. 0.947. 10.084. 0.995. -0.103. 0.993. 31.479. 0.997. 0.615. 0.943. 10.006. 0.993. -0.102. 0.994. 31.304. 0.996. 0.605. r. K1. r. 0.933. 10.818. 0.964. -0.142. 0.931. 10.676. 0.984. 0.930. 10.343. 0.933. 2. Korsmeyer r2. K0. 2. Higuchi KH. r. 2. Table 6: Regression equation for each response variable determined by Multiple regression analysis for K4M formulations Regression Independent Y2 Y3 Y4 Y5 Y1 coefficient variables 24.48308 59.10923 86.19231 3.111863 3.697534 b0 b1 b2. X1. -2.96667. -5.77667. -6.05667. 0.472107. 0.495881. X2. -1.02167. -1.105. -1.995. 0.136013. 0.135654. X1 and X2 are the amount of Mehocel K4M and PVP K 30 respectively. The formulations are according to table 1. Y: responses, the release percent at 1 h(Y1), 4 h (Y2), 8 h (Y3), T 50%(Y4) and MDT (Y5). 100. 2.50. 90. K4M1. 70. K4M3. 60. K4M4 K4M5. 50. K4M6. 40. K4M7. 30. K4M8. 20. K4M9. K4M1. 2.00. K4M2. K4M2 K4M3. 1.50. Log%Remaining. Percent Release. 80. K4M4 K4M5. 1.00. K4M6 K4M7 K4M8. 0.50. K4M9. K4M10. 10. K4M11. 0 0. 2. 4. 6. 8. 10. Time (Hour). Fig. 1A: Zero order plot of release kinetics of ambroxol HCl matrix tablets. K4M12 K4M13. 0.00 0.00. K4M10 2.00. 4.00. 6.00. 8.00. 10.00. K4M11 K4M12. Time (Hour). K4M13. Fig. 1B: First order plot of release kinetics of ambroxol HCl matrix tablets. Page 169.
(6) Md. Mizanur Rahman Moghal et al. IRJP 2012, 3 (5) 100.00 90.00. K4M1. 80.00. K4M2 K4M3 K4M4. 60.00. K4M5. 50.00. K4M6. 40.00. K4M7 K4M8. 30.00. K4M9. 20.00. K4M10. 10.00. K4M11 1.00. 1.50. 2.00. 2.50. 3.00. K4M13. 0.80. 1.00. K4M1 K4M2 K4M3 K4M4 K4M5 K4M6. -0.40. K4M7. -0.50. K4M8 K4M9. -0.60. K4M10 K4M11 K4M12. -0.80. K4M13. Log Time(Hour). Fig. 1D: Korsmeyer plot of release kinetics of ambroxol HCl matrix tablets. 5.00. 4.50. 4.50. 4.00. 4.00. 3.50. 3.50. 2.50. MDT. 2.00 1.50. T50%(Hour). 3.00. 3.00. 2.50 2.00 1.50 1.00. 1.00. 0.50. 0.00. 0.00. K4 M1 K4 M2 K4 M3 K4 M4 K4 M5 K4 M6 K4 M7 K4 M8 K4 M9 K4 M1 0 K4 M1 1 K4 M1 2 K4 M1 3. 0.50. Formulation Code. Fig.1E: MDT values of Methocel K4M based matrix tablets. K4 M1 K4 M2 K4 M3 K4 M4 K4 M5 K4 M6 K4 M7 K4 M8 K4 M9 K4 M1 0 K4 M1 1 K4 M1 2 K4 M1 3. MDT(Hour). 0.60. -0.30. Square Root of Time (Hour). Fig. 1C: Higuchi plot of release kinetics of ambroxol HCl matrix tablets. 0.40. -0.70. K4M12 0.50. 0.20. -0.20. Log Fraction Released. Percent Release. 70.00. 0.00 0.00. 0.00 0.00 -0.10. Formulation code. Fig. 1F: T50% values of Methocel K4M based matrix tablets. Fig. 2A: Response surface plot of tablet Fig. 2B: Response surface plot of tablet formulations after 1 hours dissolution formulations after 4 hours dissolution. Page 170.
(7) Md. Mizanur Rahman Moghal et al. IRJP 2012, 3 (5). Fig. 2C: Response surface plot of tablet showing the effect of polymer on T50%. Fig. 2D: Response surface plot of tablet formulations after 8 hours dissolution. 90 80 70 Percent Release. 60 50 40 Actual Rel.. 30. Predicted Rel.. 20 10 0 0. 2. 4. 6. 8. 10. Time(Hours). Fig.2E: Response surface plot of tablet formulations showing the effect of polymer on MDT. Fig. 3: Predicted and actual drug release from optimized formulation. CONCLUSION It may be concluded from the present study that the hydrophilic matrix tablets of Ambroxol hydrochloride, prepared using Methocel K4M and PVP K 30, can successfully be employed as twice-a-day oral sustained release drug delivery system. Both the polymer and binder plays major role for the sustained release of Ambroxol hydrochloride. However, appropriate balancing between various levels of the polymer and binder may contribute better results. High degree of prognosis obtained using Response Surface Methodology. So, optimization of Ambroxol hydrochloride by Response Surface Methodology is quite efficient. ACKNOWLEDGEMENT The authors are thankful to Colorcon Asia Pvt. Ltd., Bangladesh for their generous donation of Methocel K4M . The authors are also thankful to all the teachers and staffs of the University of Dhaka for their support and cooperation. REFERENCES 1. Silvina, A., Bravo, R., Claudio, J. 2002. In-vitro studies of diclofenac sodium controlled-release from biopolymeric hydrophyllic metrices. J. pharm. Pharmaceut Sci. 5, 213-319.. 2. Merkus, F.W.H.M. 1986. In Rate controlled Administration and action. Struyker-Boundier. H.A.J.,Ed.;CRC Press, Boca Raton, FL. 15-47. 3. George, M.,Grass, I.V. and Robinson, J.R. 1989. Sustained and controlled release drug delivery systems. Modern Pharmaceutics (Banker GS, Rhodes CT Eds). 2, 575-609. 4. Hiroshi, S., Yasuhiko, M., Toshio, O., Masahru, M. and Hisakazu, S. 1997. Dissolution mechanism of diclofenac Na from wax matrix granules. Journal of Pharmaceutical Sciences. 86, 929-935. 5. Lordi, N.G., Sustained Release Dosage Forms, in Lachman, L., Lieberman, H.A. and Kanig, J. L. (Edts), 1992. 6. R.F. Shangraw,”Compressed Tablets by Direct Compression,” Pharmaceutical Dosage Forms: Tablets, H.A.Lieberman, L.Lachman, and J.B. Schwartz, Eds, 1989. 7. Talukder, MM, Michoel A, Rombaut P and Kinget R, Comparative study on Xanthun gum and hydroxypropylmethylcellulose as Matrices for Controlled-Release Drug Delivery I. Int J Pharm, 129: 231-241, 1996. 8. Barar, F.S.K., Eds., In; Essentials of Pharmacotherapeutics, 3rd Edn., S. Chand and Company Ltd., New Delhi, 2005, 550 9. Vergin H, Bishop Freudling-GB, M Miczka, Nitsche V, Strobel K, Matzkies F. Untersuchungen zur Pharmakokinetik und Biequivalenz unterschiellicher Darreichungsformen von Ambroxol. Arzneim-Forsch / Drug Res 1985; 35: 1591-5.. Page 171.
(8) Md. Mizanur Rahman Moghal et al. IRJP 2012, 3 (5) 10. Ritger PL and Peppas NA, A simple equation for description of solute release II. Fickian and anomalous release from swellable devices. J Control Rel, 1987; 5: 37-42, 11. Shato H, Miyagawa Y, Okabe T, Miyajima M and Sunada H, Dissolution mechanism of diclofenac sodium from wax matrix granules. J Pharm Sci, 1997; 86 (8): 929-934, 12. Singh B, Kumar R, Ahuja N. Optimizing drug delivery systems using systematic “design of experiments”. Part I: Fundamental aspects. Crit Rev Ther Drug Carrier Syst. 2005;22:27-105 13. Singh B, Mehta G, Kumar R, Bhatia A, Ahuja N, Katare OP. Design, development and optimization of nimesulide-loaded liposomal systems for topical application. Curr Drug Deliv. 2005;2:143-153. 14. Korsmeyer RW, Gurny R, Docler E, Buri P, Peppas NA. Mechanism of solute release from porous hydrophilic polymers. Int J Pharm. 1983; 15:25-35. DOI: 10.1016/03785173(83)90064-9. 15. Talukder MM, Michoel A, Rombaut P and Kinget R. Comaprative study on xanthun gum and hydroxypropyl methyl cellulose as matrices for controlled-release drug delivery. Int. Pharm. (1996) 129:231-241. 16. Shato H, Miyagawa, Y, Okabe T, Miyajima M and Sunada H. Dissolution mechanism of diclofenac sodium from wax matrix granules. J. Pharm. Sci.(1997) 86: 929-934 17. Mockel JE, Lippold BC. Zero order release from hydrocolloid matrices. Pharm Res. 1993; 10:1066- 1070. PubMed DOI: 10.1023/A:1018931210396 18. FDA Guidance for Industry, “Dissolution Testing of Immediate Release Solid Oral Dosage Forms,” Center for Drug Evaluation and Research, Rockville, MD, 1997. 19. Vazques MJ, Perez-Marcos B, Gomez-Amoza JL, Martinez-Pacheco R, Souto C, Concheiro A. Influence of technological variables on release of drugs from hydrophilic matrices. Drug Dev Ind Pharm. 1992; 18: 1355-1375. 20. Ford JL, Rubinstein MH, Hogan JE. Formulation of sustained release promethazine hydrochloride tablets using hydroxypropyl methyl cellulose matrices. Int J Pharm. 1985;24:327-338., DOI: 10.1016/03785173(85)90031-6.. Source of support: Nil, Conflict of interest: None Declared. Page 172.
(9)
Figure
Related documents
Aim: This study was conducted to identify plasma methionine, S-adenosyl methionine (SAM), S-adenosyl homocysteine (SAH), folate, vitamin B12, cysteine levels on
When the tumour has a large posterior extension involv- ing the gluteus maximus, ligation of the posterior branch of the internal iliac artery can be used to reduce
Detection of missing edges (or link prediction) is the opposite technique of outlier edge detection. These algorithms find missing edges between pairs of nodes in a graph. They
It then discusses the impact of these reforms on the corporate sector under five main heads: corporate governance, risk management, capital structure, group structure and
Ellansé (Sinclair Pharma, London, UK), the PCL-based collagen stimulator (PCL- fi ller) has a longer action duration than other col- lagen stimulators used in esthetics, such as
By using transfer learning, it is possible to use a deep learning model that has been pretrained on large dataset to learn from relatively smaller dataset.. The use of this con-
The in vitro and in vivo skin permeation studies further demonstrated the usefulness of formulating polymeric NPs in sunscreen creams in order to achieve high retention for
Figure 6: Activity diagram showing control flow of login system and authentication method.. Figure 7: Activity diagram showing control flow of insurance value
