An investigation into the use of visualisations
in the Resource Consent Process
Ben M. BAIRD and Hamish G. RENNIE
Department of Environmental Management, Lincoln University, New Zealand
ABSTRACT
The use of Computer Aided Design (CAD) drawings or other static images (including photo-shop and simulations) to visualise potential future situations is common and powerful in planning processes. Its production, use and understanding in gaining planning permission in the New Zealand context is investigated through interviews with 13 architects and planners in Christchurch. The findings highlight the dilemma faced by planners in using visualisations and questions the drive for accuracy and realism in visualisations.
1. INTRODUCTION
Increasingly, visualisations or images pervade every aspect of our lives (Lange, 2001, p.179); from billboards to magazines, movies and live events. They offer almost instant information and are therefore considered an effective communication tool; as the old saying goes - a picture is worth a thousand words. Through better technology, these images appear increasingly realistic, with the promise of the concept that they portray being better able to be comprehended by the viewer (Appleton & Lovett, 2003, p. 117; Lewis, Casello, & Groulx, 2012, p. 100). However, is this sense of comprehension based on the assumption that increased realism means increased accuracy? Could an increase in realism blur the line between ‘accurate’ and ‘idealistic’ (Lange, 2001, p. 165)? Could ‘realistic’ images in fact mislead (Lewis, 2012, pp. 551-552) and, if so, how might the use of images affect decision-making in the planning process? This paper presents an analysis of the use of visualisations within New Zealand’s land use planning process, specifically the resource
consent process through which planning permission is gained.
2. VISUALISATIONS AND PLANNING
cartographic representations of reality or design (Duhr, 2007) are applicable to visualisations.
Visualisations frequently appear during planning processes and may be considered as aiding the decision-making process by showing a future, with or without a proposed project or action. More cynically, they may be seen as an attempt to paint a more positive picture of the future of the project than might be the case. Visualisations generally accompany large scale, mostly commercial developments due to the significant cost involved in their creation, though they appear to be becoming generally more prevalent as technological costs decrease and the complexity of projects increase. The resource consent process is initiated when someone wishes to undertake an activity that is not otherwise permitted under the Resource Management Act 1991 (RMA), New Zealand’s primary land use planning legislation.
Visualisations may be prepared by a wide range of people, from amateurs to urban designers, engineers, planners, and architects. Typically in the New Zealand planning processes, architects, especially landscape architects, are accepted as the experts on visual effects and prepare visualisations as part of an application for a resource consent. Resource consent planners at the local authority receiving the application are required to assess the application for its completeness, provide an initial screening of the scale and significance of impacts and determine what pathway the application will take. Implicit is that the information provided in the application enables the planner to gain a good understanding of the proposed action or project and is sufficiently accurate for an informed decision. If it is not then it is deemed incomplete and returned to the applicant. There is no legal requirement to include visualisations as part of an application, however visual effects are required to be addressed in application documents (cl.7(1)(b) of Schedule 4, RMA) and are often important parts of the consideration of effects on landscape and amenity values. The RMA process involves council planners determining the level of effects and subsequent type of
public (if any) notification based on their assessment (whether the effects of the application are more or less than minor). Usually the planners then produce a report to the person or panel that decides the application, and that report includes an assessment of the effects of the application against provisions in the plan’s objectives, policies, and rules, and other relevant legislation. The views of the architects, planners, as well as the decision-makers, as to the purpose and role of the visualisation therefore appears important in the overall decision-making process. As our interest is in the perceived purpose of the visualisations provided with an application and the potential for manipulation or to focus discussion, our method comprises a comparison of the purpose for which architects perceive they are creating visualisations, and how planners interpret visualisations.
might place on its validity’ (p. 29). This raises questions as to whether those using the improved technology for generating images are providing realistic information that can be relied on by decision-makers or whether a growing reliance on the technology is actually exacerbating the potential manipulability of planners, decision-makers and, if publicly notified, the community.
The potential for confusion between visualisation and reality is highlighted by the New Zealand Institute for Landscape Architecture’s (NZILA’s) Best Practice Guideline 10.1 for visual simulations (visualisations). On its opening page, under a series of before and after photographs and simulations, it states boldly that ‘Visual Simulations can accurately portray in a realistic manner and in a realistic context, a proposed change or modification in the landscape’ (NZILA Education Foundation, 2010, p.2, emphasis added). The guide subsequently states that visual simulations are ‘not real life views’ (p.3), but continues to repeat the words ‘accurately’ and ‘realistic’- thereby adding weight to both those concepts and the perception that good quality visualisations deliver ‘reality’. The courts appear also to expect accurate and realistic visualisations to aid them in their decision-making and have not been persuaded by visualisations that do not accurately portray the reality of a view, but when a visualisation is obviously poorly portraying reality (e.g., apparent pixelisation), decision-makers may set them aside (e.g., Tram Lease Ltd v Auckland Council [2015] EnvC 133). If, however, a visualisation is not obviously inaccurate it might be unwittingly accepted as accurate1.
This is not to suggest that there is necessarily a deliberate attempt to mislead. If they do mislead, it may just be a consequence of how visualisations have evolved. Before
1 It has been stated by the courts generally that
the need for accuracy is ‘self-evident’ in an assessment of environmental effects provided with an application. If an inaccuracy in that assessment is sufficient to have materially affected the decision then the conditions of a consent can be reviewed and if the adverse effects of the
computer generated images, visualisations were unmistakably hand-drawn and therefore, ‘can’t be mistaken for anything but illustrations’ (Xie, 2013). Images were justifiably understood as ideas, not reality (Faludi, 1996). But as technology has improved, better, cheaper visualisations are possible and subsequently there is greater potential for application or misapplication of visualisations (Lewis et al., 2012, p. 89). The increased use of computer technology and its capacity means every aspect of an image can be artificially contrived. As Xie (2013) describes it, ‘adding beautiful furniture ... picking a flattering angle that’s hard to physically photograph ... to producing lighting conditions that only exist in a fantasy world’, and finally ‘inserting trees or hip young people doing yoga’. Other factors such as sky colour, angle, use of transport, style and the context shown are all decisions made or assumed by the designer (Bressi, 1995, Wissen et al., 2008, Halbur & Haugh, 2010). Smallman and St. John (2005) argue that these decisions may, in fact, be subconscious - that it is not intended to deceive (p. 12). However, deception is possible.
Perception issues are exacerbated by the potential lack of direct connection between the creator and the viewer (Sheppard, 2001, p. 188). This is exemplified in understanding how the public interact with visualisations. The public only has the visualisation and the immediate context for points of reference unless they are involved in the process through either consultation or as a submitter. If neither, then they are one step removed from the process, and they have no ability to question or respond when images do not reflect the eventual reality. Their perception is distorted because of distance (Rabie, 1991, p. 57; Levy, 1995, p. 345).
cancelled (New Zealand Wind Farms Ltd v
Palmerston North City Council [2013] NZHC 1504). In practice, to achieve a cancellation (or even a review) is likely to involve substantial court action and costs. If an inaccuracy is not obvious it may be hard to argue that the adverse effects are
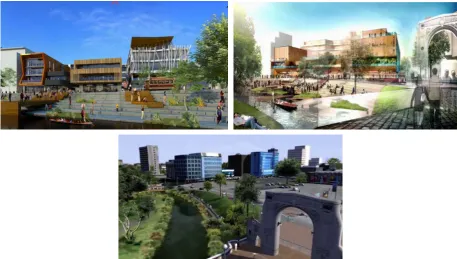
The Terrace development in Christchurch (a nearly completed post-2011 earthquake development that required planning permission) provides a useful example. The Terrace is situated along Oxford Terrace and before the earthquakes this was a popular bar and restaurant area. The Terrace is a development project that involves building three buildings for mixed use along the Avon River. The images reproduced in Figure 1, show three different visualisations of The Terrace, one by the promoter (downloaded from its website in 2014) and two that are from a flyover produced by the Christchurch City Development Unit’s (CCDU’s) Avon River Precinct development (2014). The visualisations serve similar purposes of portraying what the future appearance of this area will be, however there are obvious differences in the style of the images as well as the actual appearance of buildings and their context. Even in the two images from the one CCDU flyover video only seconds apart, there are two different riverscape developments shown as if it was the one seamless development. Having three images displayed together as in Figure 1 enables direct comparison and thereby alerts the viewer to their more obvious artificial nature.
When looked at individually and in more detail, it is notable that none is of a day of inclement weather, but otherwise there are few visual clues that might act as reference points for a viewer to assess the representativeness of the view as typical or otherwise. In fact, any information on the degree to which such images represent the average probable daily scene at a particular representative time of day or season is not provided, nor is there an explanation for differences in greenery and other features. An unrealistic luminous glow or halo-like ‘shininess’ permeates one of the images in which people appear transparent making it obvious that one image is clearly more artistic than the others. However, by contrast this also adds a greater sense of reality to the other images, which are, in fact, just as simulated.
(even subconscious) may remain unknown (Lewis, 2012, p. 562-563).
This example highlights the openness of the landscape in which visualisations operate. Smallman and St. John (2005) describe this developing visualisation 'landscape' as being like the ‘wild west’. Other authors (Kidd 1998, Wissen et al., 2008), have suggested different ways to provide structure and confidence in the use and interpretation of visualisations. One of the most cited examples is Forester’s (1982) framework for assessing visualisations. This is based around the key concepts of being comprehensive, trustworthy, legitimate and accurate. To be comprehensive, images need to be a clear and reliable representation of the project, while to be trustworthy implies a need to be transparent in the production process. Legitimacy relates to the rationale of the visualisation through disclosing information assumptions, and accuracy is a measure of its realism (which is difficult to define, as described above). These elements together form a broad framework for understanding the effectiveness of visualisations.
3. METHOD
This research used a qualitative approach, interviewing (face-to-face) seven architects and six planners in Christchurch (see Baird, 2014, for further details of the interviewees and the images used). The interviews followed a semi-structured approach with pre-circulated questions to help lead the conversation. The issues identified in the theory, encapsulated in Forester’s (1982) framework, shaped the questions for first the architects and then the planners. These questions focused around key ideas, such as the perception, context and intended audience of visualisations and the use and awareness of composition techniques. The architects were interviewed first with the discussion focused on a visualisation they had been involved in creating. These visualisations were static images and, overall, five images were discussed. These images were not discussed in terms of specific consents, but rather in general terms. The planners were interviewed afterwards, discussing their perceptions of the same visualisations. This enabled a comparison
between how architects develop images and how planners interpret them, as well as if the way in which images were prepared affected the planners’ assessment of effects. The discussion also examined how architects perceive planners will interpret the images and vice versa. As the sample size is small (a total of 13 interviewees), and is only of Christchurch practitioners, which might reflect a regional ‘school’ of thinking or approach, no attempt is made at statistical analysis. To maintain anonymity of the respondents, the responses are grouped generally under the title of the representative group: ‘Architects’ or ‘Planners’ (see Baird 2014, for a more detailed presentation of individual anonymised responses).
4. RESULTS
Architects interviewed generally considered that visualisations are composed with the clients in mind, not the public, planners or decision-makers. Architects said they believed that planners understand how images are developed and are not influenced by good design. In fact because of this, some, not all, architects said they made consent application images with elements of the original client-oriented images removed or diminished to make them more ‘objective’. Architects said they generally composed images using a sunny day, from street view and eye height; though they varied in their approach to context, transport, and landscaping. The individual architect’s responses were not consistent on how to prepare visualisations and how important context is; for example, some architects include neighbouring buildings for reference while others exclude them as they consider these would detract from the proposal. Architects described images as being accurate with artistic elements and any manipulation was unintended in ‘trying to show the building in the best possible light … you do massage a bit with some artistic license’.
created for a consent, architects would downplay elements and remove additional information to provide more ‘objectivity’ to assist the decision-making process, or as one architect put it ‘we put enough detail in it to get it approved’.
Planners said that the architects’ visualisations were developed with their client in mind, but contradictions were evident in the planners’ responses. They understood that images contained artistic elements and that accuracy is not as important early on (when they are first encountered in a resource consent process). Planners would follow up any differences between the plan and visualisation and vice versa, to ensure accuracy. This suggests that accuracy was considered important and that planners may have been asking for detail that might have been removed to be brought back in, or new material added.
Planners considered context as the most important element as it helped them understand the environmental effects and provided reference points. Planners were unsure what architects considered important in the image and were less aware of compositional techniques used by architects (e.g. the use of a sunny day and views from eye height), but were aware that ‘it is always the nice fancy cars' in the visualisation. When asked, planners agreed that images could potentially influence their and the public’s perception, but they considered that the images are beneficial in understanding the application. They also agreed that visualisations are becoming more common and increasingly complex, which can make them confusing, and that more information could help minimise these negative effects.
The planners and architects accepted that images are subjective, but said that they are still beneficial in communicating and initiating dialogue. Their responses indicated that they did not consider subjectivity necessarily meant the images were not credible representations of reality. Context, however, was a key element that differed between the two groups. Furthermore, planners said they do not fully
2 This represents the difference between what
Faludi (1996) refers to as the private domain in
understand the image-generating technology though accepted that this is probably beyond their role. As one planner said ‘I trust the architect to provide technical and professional advice’. So while they understood that visualisations could be manipulated and that they were not cognisant of many of the ways in which this might be achieved, planners continued to accept and use them.
5. DISCUSSION
This research shows that visualisations are at least initially prepared for a client’s benefit, and not for assisting planning assessments2.
This gives rise to a paradox. Planners are not certain of the degree to which they can rely on the images provided. Consequently, it could be argued that the visualisations should be treated as nice additions to resource consent applications, but nonessential. However, without visualisations it would appear difficult for planners to assess visual effects for notification decisions, and the public’s and decision-makers’ subsequent consideration of the potential effects of the development would also be more difficult. Despite their awareness that visualisations can be manipulated planners agree that images are useful for comprehending a proposal. Consequently, an understanding by planners of the technology and assumptions and an agreed approach to context and composition may be necessary for visualisations to be legitimately and appropriately used by planners.
Lacking such knowledge, it appears that when a specific visualisation is created and included as part of a resource consent application, planners have a healthy level of scepticism that they rely on to hinder any attempt at manipulation. Xie’s (2013) fears about the potential manipulability of every aspect of a visualisation is seemingly diminished by the lack of reliance on images that accompany resource consents and the preparedness to seek clarifications. However, as they still lack that technical knowledge of how the visualisations can be manipulated, when seeking clarifications and further
information planners remain susceptible to subtleties that lie within the images that shape their overall impression of a project. The responses from the interviewed architects indicate that they may be overestimating planners’ understanding and ability to see through, what one architect described as, ‘the flashy stuff’ in visualisations. Lacking this awareness, architects may not make the production process sufficiently transparent.
This research suggests that the potential gains in the use and effectiveness of visualisation may not be through better technology, but better understanding of the means of producing visualisations; that a search for a common framework for projects and their visualisation would be better than the pursuit of more accurate images. Agreeing or stating, for example, the point of view used, a realistic sunlight angle, inclusion of important contextual buildings and appropriate (anticipated) use of people and cars provides the planner with a better understanding of the visual effects and overall impact of the project. An agreed framework might reduce the need for the present iterative approach between architects and planners, improving the efficiency of the process. Care would be needed to ensure that such a framework reduced, rather than reinforced, the element of manipulation present in statements such as including only sufficient detail ‘to get it approved’. The NZILA’s Best Practice Guideline might form a basis for such an agreed framework, although the extent to which the Guideline’s current emphasis on accuracy and realism should be encouraged over more obviously artistic representations should be a matter for careful consideration
While manipulability within the resource consent process may be minimised by the above steps, the question of how images may affect public understanding, being one step removed from the process, still remains. The public interaction and understanding of the visualisation process and how this might influence their engagement in planning processes would be a useful area of potential future research.
6. CONCLUSION
The increasingly sophisticated and complex technology available for visualisations has considerably increased the potential for seemingly accurate and realistic portrayals of present and future realities. To the extent that planners, decision-makers and the public might be influenced by such portrayals, visualisations remain powerful and there is scope for manipulation by those preparing them. At present, planners are caught in the dilemma of recognising that visualisations have utility in their decision-making processes, while being equally aware that the visualisations presented to them may be misleading or insufficient for them to have confidence in their use for assessing visual effects. This results in an iterative, interactive process between planner and architect that influences decisions on public notification, but might also be characterised as inefficient. The extent to which the resultant visualisations may influence decisions by the public and others, if notified, to engage in the planning process is unknown. The differences in depiction of the CCDU (2014) riverscape in Figure 1, for example, probably would be addressed in a resource consent process by the planner. Whether or not these differences are noticed and understood by the general public, and how these might influence the way in which they become involved in the resource consent process, is an open question. This places a considerable burden on planners in making decisions where images have been used to promote projects to the public and created expectations that may not be met in reality.
promoted or accidental. In particular, there is a need for transparency about the assumptions underlying and the decisions made as to what to include and exclude from a visualisation and the compositional techniques employed.
We conclude that a drive for accuracy and realism obfuscates the fact that visualisations are only partial and simplified representations of realities, current and future. This will not be solved through increased technological capability and sophistication in visualisation.
7. ACKNOWLEDGEMENTS
We gratefully acknowledge the very helpful comments from two anonymous reviewers and the editor.
8. REFERENCES
Appleton, K., & Lovett, A. (2003). GIS-based visualisation of rural landscapes: defining 'sufficient' realism for environmental decision-making. Landscape and Urban Planning, 65, pp. 177-131
Baird, B.M. (2014). The effect of visualisation on the resource consent process: A case study in Christchurch City. Unpublished MEP dissertation, Lincoln University, New Zealand
Bressi, T., (1995). The real thing? We’re getting there. Planning, 61(7), pp. 16-20 Carrie, N. (2007, June). More - And Less - Than
the Eye Can See. Planning Quarterly, pp. 27-29
CCDU. (2014). Te Papa Otakaro/Avon River Precinct - animated flythrough. Sourced from vimeo.com/73282494 in March 2014
Coggan, T. (2007, March). Highly Accurate Visual Simulations Power Up Community Consultation Process. Planning Quarterly, pp. 25-27
Duhr, S. (2007). The Visual Language of Spatial Planning – Exploring Cartographic Representations for Spatial Planning in Europe. Oxford; Routledge. pp. 224 Faludi, A., (1996). Framing with images.
Environment and Planning B: Planning and Design 23(1), pp. 93-108
Forester, J. (1982). Planning in the Face of Power. Journal of the American Planning Association (48), pp. 67-80 Froude, V.A., (2011). Quantitative
Methodology for Measuring Natural Character in New Zealand’s Coastal Environments. Doctoral Thesis, University of Waikato
Halibur, T., & Haugh, G. (2010, July 19). False Friendliness: Photoshopped People in Public Spaces Retrieved April 29, 2014
from Planetizen:
https://www.planetizen.com/node/45 159
Kidd, V. V. (1998). To shape and direct the audiences point of view. Retrieved December 2017 from:
http://www.csus.edu/indiv/k/kiddv/pr oductiontechniques.htm
Lange, E. (2001). The limits of realism: perceptions of virtual landscapes. Landscape and Urban Planning , 54, pp. 153-182
Lewis, J. L., Casello, J. M., & Groulx, M. (2012). Effective Environmental Visualization for Urban Planning and Design: Interdisciplinary Reflections on a Rapidly Evolving Technology. Journal of Urban Technology , 19 (3), pp. 85-106
Lewis, J. (2012). More art than science: the sources and effects of stylistic variation in visualization for planning and design. Evnironment and Planning B: Planning and Design , 39, pp. 551-565 Levy, R. (1995). Visualization of urban
alternatives. Environment and
Planning B: Planning and Design, 22, pp. 343-358
NZILA Education Foundation (2010). Best Practice Guide – Visual Simulations.
https://nzila.co.nz/media/uploads/20 17_01/vissim_bpg102_lowfinal.pdf Rabie, J. (1991). Towards the Simulation of
Urban Morphology. Environment and Planning B: Planning and Design, 18, pp. 57-70
Smallman, H., & St. John, M. (2005, Summer). Naive Realism: Misplaced Faith in Realistic Displays. Ergonomics in Design, pp. 6-13
The Terrace. (2014). The Terrace. Sourced from theterrace.co.nz/#oxford-terrace-day in March 2014
Thomson, J., (2003).Coastal values and beach use survey report Environment Waikato Technical Report 2003/09. Hamilton: Waikato Regional Council Wissen, U., Schroth, O., Lange, E., & Schmid, W.
(2008). Approaches to integrating indicators into 3D landscape visualisations and their benefits for participative planning situations. Journal of Environmental Management, pp. 184-196