http://www.sciencepublishinggroup.com/j/bmb doi: 10.11648/j.bmb.20190403.12
ISSN: 2575-5064 (Print); ISSN: 2575-5048 (Online)
Expression and Characterization of
Manduca sexta
Stress
Responsive Peptide-1; An Inducer of Antimicrobial Peptide
Synthesis
Lynn Goss Schrag
1, Xiaolong Cao
2, Hawa Dembele
1, Xiaorong Liu
3, Qasim Al Souhail
1,
Michael Robert Kanost
1, Jianhan Chen
3, 4, Haobo Jiang
2, *, Om Prakash
1, *1Department of Biochemistry and Molecular Biophysics, Kansas State University, Manhattan, USA 2Department of Entomology and Plant Pathology, Oklahoma State University, Stillwater, USA 3
Department of Chemistry, University of Massachusetts, Amherst, USA
4Department of Biohemistry and Molecular Biology, University of Massachusetts, Amherst, USA
Email address:
*
Corresponding author
To cite this article:
Lynn Goss Schrag, Xiaolong Cao, Hawa Dembele, Xiaorong Liu, Qasim Al Souhail, Michael Robert Kanost, Jianhan Chen, Haobo Jiang, Om Prakash. Expression and Characterization of Manduca sexta Stress Responsive Peptide-1; An Inducer of Antimicrobial Peptide Synthesis. Biochemistry and Molecular Biology. Vol. 4, No. 3, 2019, pp. 42-52. doi: 10.11648/j.bmb.20190403.12
Received: July 5, 2019; Accepted: August 1, 2019; Published: August 14, 2019
Abstract:
In response to stress conditions such as wounding or infections in insects, several short peptides are processed to act as cytokines that induce AMP gene expression. To study their structure-activity relationship, immune inducibility, tissuespecificity, stress responsiveness, and development relatedness, we chemically synthesized Manduca sexta stress response
peptide-1, a 25-residue peptide with one disulfide bond (SRP1: FGVRVGTCPSGYVRRGTFCFPDDDY). Upon injection of the SRP1 into naïve larvae, several antimicrobial peptide genes were expressed at higher levels. The mRNA levels of SRP1
increased significantly in hemocytes and fat body after larvae were challenged with a mixture of bacteria and β-1,3-glucan.
The expression patterns of SRP1 and its target genes are somewhat different from SRP2’s, suggesting overlapping yet distinct
functions. We elucidated the 3D structure of SRP1 in solution by two-dimensional 1H-1H NMR spectroscopy. The tertiary
structure of SRP1 consists of two short β-strands at Y12−R15 and F18−F20, one type-II β-turn at R15−F18 in its well-defined core and is stabilized by a covalent disulfide bond between C8 and C19. The conformational ensemble of SRP1 from extensive
atomistic simulation in explicit solvent (with 3.0 µs total effective sampling) shows high consistency with experimental
intramolecular NOEs of the core region. The SRP1 core adopts a fold similar to the carboxyl-terminal subdomain of epidermal growth factor (EGF), suggesting that SRP1 may interact with EGF receptor-like molecules to trigger its biological function.
Keywords:
Cytokine, Nuclear Magnetic Resonance, Molecular Dynamics, Epidermal Growth Factor, Hemolymph Protein, Insect Immunity, Phenoloxidase1. Introduction
Insects possess an effective innate immune system to fight against invading pathogens [1-2]. It is comprised of responses mediated by plasma factors made in fat body (pathogen recognition, melanization, antimicrobial peptides) and by blood cells known as hemocytes (phagocytosis, encapsulation). Extracellular serine protease pathways coordinate some of the responses, such as proteolytic
Because PSP and its homologs are mostly activated under stress conditions such as wounding, infection, ligation, and heat or cold shock, we chose stress response peptide (SRP) as a general term to describe these structurally related molecules [7]. These peptides stimulate hemocyte spreading and chemotaxis, block larval growth, induce antimicrobial peptide (AMP) synthesis, and regulate other physiological
processes. In the tobacco hornworm Manduca sexta, two
paralytic peptides [PP1 and PP2:
ENFAGGCATG(Y/F)LRTADGRCKPTF] were isolated from hemolymph collected through a cut proleg [8]. Injection of chemically synthesized PP1 into larval hemocoel induced
rapid paralysis, reduced bleeding, and stimulated
plasmatocyte spreading and aggregation [9]. PP1 has an ordered structure comprised of a short antiparallel β-sheet at Y11−T14 and R18−P21, three β-turns at F3−G6, A8−Y11 and T14−G17, and a half turn at K20−F23 [10]. Genome analysis shows a single PP/PSP gene and ten homologs
(uENF1, uENF2, SRP1−8) in M. sexta [6]. All of these genes
encode predicted pre-pro-peptides, whose maturation is expected to require proteolytic cleavages. SRP2, which stimulates AMP expression, adopts a structure similar to PP1, and is composed of two short β-strands at R12−R15 and I18−V20, one type-I′ β-turn at R15−I18, and a half turn at C8−S10 [6]. The core structures of PP1 and SRP2 are each stabilized by a disulfide bond. To better understand structure-function relationships of this family of cytokines, we investigated the immune inducibility, stress responsiveness,
expression pattern of M. sexta SRP1 and carried out a
two-dimensional 1H-1H NMR to examine its solution structure.
We observed that SRP1 has an ordered structure, including a short twisted anti-parallel β-sheet, a type-II β-turn, and is stabilized by one disulfide bond.
2. Materials and Methods
2.1. Rearing of Insects and Injection, Total RNA Preparation, and cDNA Synthesis
M. sexta eggs were purchased from Carolina Biological Supply (Burlington, NC) and larvae were reared on an
artificial diet at 25°C [11]. Day 2, 5th instar larvae were
individually injected with a mixture of killed bacteria (2×10⁷
Escherichia coli XL1-Blue and 20µg Micrococcus luteus, Sigma-Aldrich) and 20µg insoluble β-1,3-glucan from
Alcaligenes faecalis (Sigma-Aldrich) suspended in water (30 µL per larva). Hemolymph was collected from cut prolegs of
larvae (3 per group) after 24h and centrifuged at 5,000g for 5
min to harvest hemocytes. Fat body was then dissected from the bled larvae. Total RNA was prepared from pooled hemocytes and fat body using TRIZOL Reagent (Thermo Fisher Scientific) and was conducted in triplicate. Control hemocyte and fat body total RNA samples were prepared by
the same method from day 3, 5th instar naïve larvae (3 per
group, 3 groups as biological replicates).
For tissue specific expression analysis, tissues were
dissected from 5–10 day 3, 5th instar naïve larvae (3–6 per
group, 0 biological replicate) for RNA isolation. To study SRP1 expression after heat stress, day 2, 5th instar larvae (3 per group, 3 biological replicates) were incubated at 42°C for 1 h and then switched back to 25°C. Hemocytes, fat body and midgut tissues were collected 6 h later for total RNA preparation. The control insects (3 per group, 3 biological replicates) were day 2 naïve larvae continuously cultured at 25°C prior to hemocyte collection and tissue dissection. To examine developmental changes of SRP1 expression, hemocytes, fat body and midgut tissues were dissected from
insects at stages ranging from day 2, 5th instar larvae to day 1,
pupae (3–6 insects per stage, 0 biological replicate) for total RNA preparation. Each total RNA sample (1 µg each) was incubated with 1× iScript Reverse Transcription Supermix (Bio-Rad) in a 10µL reaction at 42°C for 30min to synthesize cDNA. The reaction mixtures were then heated at 95°C for 3min to denature the enzyme.
To examine possible role of SRP1 in AMP expression regulation, 40µL of PBS (pH 7.4, 137mM NaCl, 2.7mM KCl,
10mM Na2HPO4, 1.8mM KH2PO4) or SRP1 (0.1µg/µL) in
PBS were each injected into six day 2, 5th instar larvae (3
control and 3 test). Fat body tissues were separately collected 6h later for RNA isolation and cDNA synthesis as described previously. This experiment was repeated twice (total of 3 biological replicates).
2.2. Quantitative Real-Time Polymerase Chain Reaction (qRT-PCR)
To measure the mRNA levels of SRP1, rpS3, diapausin-4, attacin-1, 7, 8 and 10, cecropin-6, gloverin, lebocin D, lysozyme-1, and moricin-1 transcripts, qRT-PCR (3 technical repeats) was carried out under the conditions described previously [6]. The primers for SRP1 were: j1066 (5’
GCCGAGGGTATCGTT) and j1067 (5’
TCAGGCTTTGGCGTT). Amplification efficiencies (E) were 88.7% for SRP1, 95.8% for rpS3, 93.2% for diapausin-4, 97.9% for attacin-1, 7, 8 and 10, 83.9% for cecropin-6, 91.8% for gloverin, 90.7% for lebocin D, 102.0% for lysozyme-1, and 98.5% for moricin-1. mRNA levels relative to rpS3 were calculated as: (1 + ErpS3)Ct, rpS3/(1 + Ex)Ct, x [12].
2.3. Synthesis of M. sexta Stress Response Peptide SRP1
M. sexta SRP1 was synthesized by automated protocols of stepwise solid-phase Fmoc chemistry on an automatic peptide synthesizer ABI model 431A (Applied Biosystems, Foster City, CA, USA). For peptide synthesis, CLEAR amide resin (0.3mmol/g; Peptides International, Louisville, KY) and
Nα-Fmoc amino acids (Anaspec Inc., San Jose, CA) were
used. The linear peptides were cyclized by formation of a disulfide bond between C8 and C19 followed by purification on a high-pressure liquid chromatography (HPLC) system (Beckman Instruments, Inc., Fullerton, CA) using a Phenomenex reversed-phase C-18 column (Torrance, CA). The purified (>95%) peptide was eluted (1ml/min) using a linear gradient of 10-90% acetonitrile containing 0.1%
determination of the peptide was performed by matrix-assisted-laser desorption time-of-flight (MALDI-TOF) mass spectrometric analysis (Bruker Ultraflex II spectrometer; Bruker Daltronics, Billerica, MA).
2.4. NMR Spectroscopy
The one- and two-dimension proton-proton NMR experiments described in these studies were carried out on 500 MHz Varian VNMR system (Agilent Technologies Inc., Palo Alto, CA) equipped with a 5mm cryogenic triple resonance inverse detection pulse field gradient probe. The NMR experimental data were acquired at 25°C. The 1.8 mM
solution of the purified SRP1 in 650µL of 10% D2O and 90%
triple distilled H2O was used for NMR data acquisition. A
total of 4096 t2 and 512 t1 data points were acquired for the
2D 1H-1H Double Quantum Filtered Correlation
Spectroscopy (DQF-COSY) [13] experiments with spectral width of 12ppm in each dimension, and 16 transient per
increment. Whereas 2D 1H-1H Total Correlation
Spectroscopy (TOCSY) [14] and Nuclear Overhauser Effect Spectroscopy (NOESY) [15] experiments were performed
using 2048 t2 and 256 t1 data points. The MLEV-17 pulse
sequence [14] with a spin-lock time of 80ms at B1 field
strength of 7kHz was used for acquisition of 2D 1H-1H
TOCSY NMR data. Three different mixing times of 100, 300
and 500ms were used for acquisition 2D 1H-1H NOESY
experimental data under similar conditions. All 2D NMR experiments were performed in hyper-complex phase-sensitive mode. The 2D DQF-COSY NMR data sets were
zero filled to 8K in the t2 dimension and 2K in the t1
dimension respectively. For NMR data processing of all other 2D NMR experiments, the linear prediction and zero filling
to 4K data points in t2 dimension were used. When necessary,
we used spectral Lorentzian-Gaussian apodization for enhancing the NMR spectral resolution. We used WATERGATE pulse scheme [16] during acquisition for suppression of the solvent peak (HOD). The residual water peak at 4.78ppm was used as reference for chemical shift assignments. NMR data was processed using VnmrJ3.2a (Agilent Technologies Inc., Palo Alto, CA) software and analysis was carried out using CCPNMR 2.4 [17] and Sparky 3.12 program [18]. The assignment of side chain proton resonances were achieved by comparing cross peaks in the 2D TOCSY spectra with those in the 2D NOESY spectra acquired under similar experimental conditions. The information for hydrogen bond was obtained through amide proton resonances either appearing after 12h or showing slow
exchange in the 1D and 2D 1H-1H TOCSY spectra acquired
in 100% D2O. The NOE cross peaks were classified as
strong, medium, or weak intensity based on the observed number of contour lines for distance constraints calculation.
2.5. Structure Calculations
The inter-proton distance constraints were obtained using 2D NOESY spectra acquired with the different mixing times (100, 300 and 500ms). We used the 2D NOESY data
acquired with mixing time of 300ms for distance constraint calculations and also confirmed the assigned cross peaks in the spectrum acquired with the 100ms mixing time. In order to rule out the peaks due to spin diffusion, we only considered cross peaks present in the NOESY spectra acquired with 100ms mixing time for distance constraint calculations. We assigned NOE-derived distance constraints into three distance ranges (1.8−2.5, 1.8−3.5, and 1.8−5.0Å) corresponding to strong, medium and weak cross peaks intensities. A correction to the upper bound distance constraint limits for methyl or non-stereo-specifically assigned methylene protons was done by adding 0.5Å appropriately for center averaging [19]. The CNS program version 1.3 [20] that uses a combination of simulated annealing in torsional space with restrained molecular dynamics (MD) in a Cartesian space was used for calculation of SRP1 structures with minimal restraint violation [21]. For structure calculations, the force constants were scaled throughout the procedure using default parameters of CNS. The molecular structure refinement protocol involved 100ps restrained MD simulation at 300K followed by energy minimization. For the NOE derived distance constraints and dihedral angles constraints the force constant value of
50kcal/mol/Å2 and 100kcal/mol/Å2 respectively were
imposed during molecular dynamics calculations. The force constant of NOE derived distance constraints was increased
to 100kcal/mol/Å2 during final energy minimization. We
calculated over 200 SRP1 structures using NOEs, dihedral angles and hydrogen bond derived distance constraints. An ensemble of three-dimensional NMR structures of SRP1 was obtained using 20 lowest energy structures with no restraint violation. The average structure was calculated to represent
3D solution NMR structure of M. sexta SRP1. The Visualized
Molecular Dynamics (VMD) [22] and PROCHECK-NMR programs [23] were used to generate the figure and check the quality of the average structure respectively.
2.6. Explicit Solvent Molecular Dynamic (MD) Simulations
The 5 lowest energy NMR structures of SRP1 were used as the initial coordinates to initiate five independent MD simulations. Each of the 5 replicas was solvated in a cubic TIP3P explicit solvent water-box with an average volume of
~55 x 55 x 55Å3 in CHARMM [24-26]. The system was then
charge balanced with K+. Each of the solvated SRP1
structures was then energy minimized and equilibrated for 100 ps in the Charmm36 force field [27]. Five 600-ns production simulations at standard temperature and pressure were then performed using NAMD [28], together yielding a
total of 3.0µs effective sampling of SRP1. Particle mesh
2.7. Clustering and NOE Analysis
All structural and clustering analysis were performed using the GROMACS program suite [32]. For clustering, snapshots at 1ns intervals were included, giving rise to 3004 unique snapshots together from all five replicas. GROMOS clustering was then employed using Cα RMSD with a cut-off of 3 Å [33]. Theoretical NOE distances were back calculated for each of the eight most populated clusters, which presumably represent key conformational states of SRP1. Back-calculated NOE-like distances were then compared to experimentally derived medium and long-range NOE upper bounds involving NH, CαH, CβH, and CγH protons used in NMR structure calculations (see Section 2.5).
3. Results and Discussion
3.1. Immune Inducibility, Tissue Specificity, Stress Responsiveness, and Developmental Profiles of SRP1 Expression
SRP1 is homologous to Hyphantria cunea Hdd23, a gene
known to be upregulated by immune challenge, but with unknown function [34]. We examined the SRP1 mRNA levels in different tissues at various life stages represented by 52 previously obtained RNA-Seq datasets [35] (Figure A1) and found that SRP1 is expressed at a lower level than SRP2 but substantially higher than SRP5, SRP7 and SRP8 (Cao and Jiang, unpublished data). Our previous transcriptome
analysis showed that M. sexta SRP1 (CIFH contig 06581)
was up-regulated 6.6-fold in fat body and 11.9-fold in hemocytes after immune challenge [36]. We further examined SRP1 expression profiles by qRT-PCR analysis. The mRNA levels of SRP1 were very low in hemocytes and fat body from naïve larvae and became significantly higher
(p<0.05) in both tissues after larvae were injected with a
mixture of bacteria and β-1,3-glucan (Figure 1A). The SRP1 mRNA level in induced hemocytes was higher, relative to
rpS3 mRNA, than that in induced fat body. In day 3, 5th instar
naïve larvae the SRP1 transcripts in integument and trachea were 3−4 fold more abundant than in nerve tissue and muscle (Figure 1B). The mRNA levels in midgut and fat body were negligible. We tested if SRP1 expression is induced after larvae were heat shocked at 42°C for 1 h. At 6h after the treatment, we detected significant up-regulation of SRP1 expression in midgut and hemocytes (Figure 1C). The highest mRNA level was detected in treated fat body but the
p-value was >0.05 when compared with the control. We also
measured the SRP1 mRNA levels in hemocytes, fat body and
midgut during development from feeding stage 5th instar
larvae to pupae (Figure 1D). The SRP1 transcripts in hemocytes increased three-fold in day one pupae, compared with expression in larval hemocytes. Two peaks of expression were detected in fat body, one in the early wandering stage (day 7) and the other at the early pupal stage (day 1). In similar stages, expression of AMP genes is also up-regulated in response to developmental signals [35].
Figure 1. Determination of M. sexta SRP1 mRNA levels by quantitative real-time PCR. (A) Immune inducibility. As described in Materials and methods, the total RNA samples of control and induced hemocytes (CH and IH) and fat body (CF and IF) were reverse transcribed to cDNA and analyzed by qRT-PCR using the SRP1-specific primers. The relative mRNA levels normalized with rpS3 based on their Ct values in three biological replicates (3 larvae per sample) and plotted as a bar graph (mean ± SD, n = 3). The statistical significances were calculated using the Student’s t-test and significant increases are shown as * (p<0.05), ** (p<0.01), and *** (p<0.001). (B) Tissue specificity. RNA samples of integument (I), nerve tissue (N), midgut (MG), muscle (MU), Malpighian tubule (MT), salivary gland (SG), trachea (T), hemocytes (HC), and fat body (FB) from day 3, 5th instar naïve larvae were prepared and analyzed by qPCR
3.2. Induction of AMP Gene Expression by SRP1 Injection
In order to check whether SRP1 regulates AMP gene expression, we injected the SRP1 peptide solution (4.0 µg) or
PBS as a control into day 2, 5th instar larvae. We analyzed the
test and control RNA samples by qRT-PCR and observed two
of the seven AMP genes were significantly induced (p<0.05)
at 6h after SRP1 injection (Figure 2). The diapausin-4 and attacins mRNA levels were 358.8 and 7.6-fold higher
respectively than the control (p<0.05). These results suggest
that SRP1 participates in regulation of immune responses in the tobacco hornworm and justifies a structural study of this cytokine [36].
Figure 2. Induction of AMP expression by injection of PBS (grey) or SRP1 (black). As described in Materials and methods, the test and control total RNA samples of fat body from the larvae injected with buffer or peptide were analyzed by qRT-PCR using the primers specific for the seven AMP genes. After normalization against rpS3, the average SRP1 mRNA levels in the control samples were adjusted to one, and relative levels in the SRP1 injected group were calculated accordingly. The statistical significances were calculated using the Student’s t-test and significant increases are shown as * (p<0.05) or ** (p<0.01)
3.3. NMR Resonance Assignments and Secondary Structure
Following the protocols published earlier [27-29], the
analyses of 2D 1H-1H TOCSY and 2D 1H-1H NOESY NMR
spectra provided intra-residue and inter-residue proton-proton correlations on the amino acid spin system resonances and sequential proton chemical shift assignments respectively for SRP1. The TOCSY spectral data obtained at 25°C showed sufficient chemical shift dispersion for residues with limited spectral overlap. This enabled us to assign proton chemical shift of the spin systems resonances for all residues and indicated the presence of a well-defined secondary and tertiary structure for this peptide. In these assignments, CαH (i) – CδH (i+1: P) (dαδ) or CαH (i) – CαH (i+1: P) (dαα) NOEs instead of dαN(i, i+1) were used to assign trans or cis conformations for P9 and P21. We observed that both prolines (P9 and P21) in SRP1 showing strong dαδ NOEs suggesting trans configuration. The absence of dαα NOE
cross peaks in the 2D 1H-1H NOESY spectra indicated a lack
of any Pro in cis configuration. The proton chemical shifts
assignments data for M. sexta SRP1 have been deposited in
BioMagResBank (http://www.bmrb.wisc.edu) under the accession number 30507.
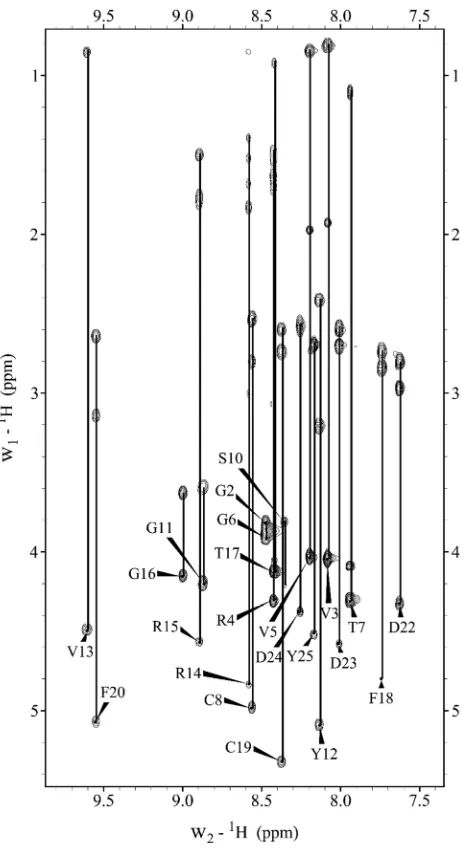
Figure 3. Fingerprint region (NH-CαH/Side chain protons) of 2D 1H-1H
TOCSY spectrum of SRP1 in H2O. Individual amino acid spin systems
connected with vertical lines and labeled with residue name and number.
Figure 3 displays CαH, CβH, CγH, and NH-CδH cross peak assignments of individual amino acid spin system in the fingerprint region of the TOCSY spectrum used
for residue identification. The 2D 1H-1H NOESY spectral
analysis allowed the identification of dαN(i, i+1) cross peaks for sequential assignments and the disambiguation of repeated amino acid residues. Further analysis of the NOESY spectra acquired with different mixing times characterized short, medium and long-range connectivity including dαN, dβN and dNN that provided structural information. An
example of 2D 1H-1H NOESY spectrum fingerprint region
SRP1. A number of non-sequential [weak dNN(i, i+3) NOE between R15 and F18 and weak dNN(i, i+7) NOE between V13 and F20] NOEs suggested an antiparallel β-sheet arrangement. Residues Y12, V13, R14, R15, F18, C19 and F20 were likely to form two short β-strands. This secondary structural observation was further supported by the down field shift of Cα proton resonances in chemical shift index (∆CαH) values (Figure A3) and larger (9.5 -15Hz) coupling
constant (3JNH-CαH) values for these residues. The random
coil values for the chemical shift of CαH protons of residues were taken from the published data [30]. The SRP1 structure consisted of two short β-strands at region Y12-R15 [weak dαN(i, i+1) NOEs from Y12 to R14] and F18– F20 [medium
dαN(i, i+1) NOE between C19 and F20]. These β-strands flanked a type-II β-turn between residues R15 – F18 [weak dNN(i, i+3) NOE from R15 to F18; weak dαN(i, i+1) NOE from residues R15 to F18; weak dNN(i, i+1) NOE between G16 and T17; medium dNN(i, i+1) NOE between T17 and F18]. The short stretch of twisted anti-parallel β-sheet was confirmed by observation of hydrogen bonds between V13 - F20. Low number of NOE cross peaks for N-terminal residues F1 – T7 suggested an extended conformation for this region. However, the C-terminal residues P21 – Y25 displayed turn-like characteristics [weak dαN(i, i+3) NOE between P21 and D24 and dNN(i, i+2) NOE between D23 and Y25].
Table 1. Structural statistics of the 20 lowest energy structures for SRP1.
NOE Constraints Number
Total 284
Intra-residue 139
Sequential 63
Medium range (i-j ≤ 5) 29
Long range (i-j ≥ 5) 21
Disulfide bonds 4
Hydrogen bonds 6
Dihedral constraints 22
Constraints/residue 11.36
Pairwise R.M.S.D. to mean structure (residues 1-25)
Backbone atoms (Å) 2.99±0.88
All nonhydrogen atoms (Å) 3.74±0.82
Pairwise R.M.S.D. to mean structure (residues 8-23)
Backbone atoms (Å) 0.28±0.08
All nonhydrogen atoms (Å) 0.85±0.10
Percentage of residues in regions of φ-ψ space
Allowed 79.5%
Additionally allowed 18.4%
Generously allowed 1.9%
Disallowed 0.2%
3.4. Tertiary Structure of M. sexta SRP1
We determined the tertiary structure of SRP1 by hybrid distance geometry-simulated annealing molecular dynamics calculations using 284 constraints including 139 intra-residue, 63 sequential, 29 medium range, 21 long range NOE and 6 hydrogen bond distance constraints as well as 22 dihedral angle constraints. Two additional distance constraints were used between Sγ and Cβ atoms of C8 and C19 to account for normal disulfide bond geometry (2.0 Å < dS-S < 2.5 Å, 2.2 Å < dCβ-S < 3.5 Å). Table 1 summarized structural statistics of the 20 lowest energy structures for SRP1 in water. The calculated structures converged to a single family of conformers regardless of the starting structure. For these structure calculations, randomly chosen structures with extended conformation were selected as starting structures. From a total of 200 conformers calculated, 20 structures with lowest energy were selected for further analysis. The torsion angle dynamics of all the 20 selected conformers were consistent with a pair of hydrogen bonds involving the backbone carbonyl of V13 and amide proton of F20, and vice versa. Conformational analysis of these 20
structures suggested two additional hydrogen bonds (F18 backbone carbonyl to backbone amide proton of R15, and R15 backbone carbonyl to backbone amide proton of F18). Figure 5A displays
superimposition of the 20 lowest energy structure of SRP1. Alignments along residues C8-P21, forming the core region for SRP1, of the 20 lowest energy structures showed backbone root mean square deviation (RMSD) value of 0.28Å.
These structures showed good agreement with
Figure 4. Summary of the NOE connectivity for SRP1 in water. The line thickness indicates the peak intensity, dotted lines indicate the non-sequential connections and arrows highlight residues that are resistant to deuterium exchange.
Figure 5. Structural representations of SRP1. (A) Superimposition of the 20 lowest energy NMR structures of SRP1. (B) Cartoon of the backbone for the lowest energy structure of SRP1. The disulfide bond between C8 and C19 represented in licorice. (C) 180° rotation of B with side-chains of Y12, D22, D23, and D24 indicated in licorice.
As a means of structural refinement of the calculated NMR ensemble, 600-ns MD simulations seeded with the five lowest energy structures from NMR were conducted in explicit solvent. A total of 3004 unique snapshots taken at 1-ns intervals were collected from these simulatio1-ns. The average structures and populations of the eight largest clusters of the simulated ensemble are shown in Figure 6, which shows a strong degree of agreement in positions and relative integrity of the β-strands throughout simulation with respect to the NMR structure. It also elucidates some conformational heterogeneity present for both N- and C-termini. We have further performed NOE violation analysis on the sub-ensembles of structures that belong to the eight largest clusters. The NOE violation analysis results are summarized in Figure 7. These results suggest that constraints pertaining to the core region residues (C8-P21) are in strong agreement with NOE observations from NMR. However, there are NOEs that only satisfy in smaller sub-populations of the ensemble pertaining to residues D23 and D24. This likely reflects SRP1’s conformational hyper-variability in the C-terminus.
Figure 7. Summary of NOE violation analysis of the eight most populated clusters from the simulated ensemble. Each pairwise medium- and long-range NOE interactions are listed on the y-axis. Cluster population rank and percentage are denoted on the x-axis. Pseudo atom constraints were utilized for methyl group calculations. Black blocks mark NOE that are violated by at least 1.0Å by individual clusters. All instances of gray reflect satisfaction of a constraint for a given cluster.
The analysis of the tertiary structure of SRP1 suggested that in aqueous solution this peptide possessed a very well-defined core region with a short twisted anti-parallel β-sheet that was stabilized by a type-II β-turn and a disulfide bond. The C-terminus displayed turn-like characteristics, possibly due to electrostatic repulsion of the aspartate residues, while the N-terminus was largely unstructured with substantial flexibility. Overall tertiary structure was stabilized by a combination of the hydrogen bonds within the β-sheet structure and the covalent disulfide linkage. Within the core region of the molecule, one side of the structure was mainly composed of charged residues R14 and R15. The opposite side of the structure was composed of hydrophobic residues, including Y12, F18 and F20. The side chain of Y12 showed NOE contacts to the side chains of C8, P9, and C19 (data not shown). This suggested residue Y12 is embedded, as
observed for residues at a similar position in MsPP1 and
MsSRP2 [6, 10]. These structural characteristics, similar to
other ENF peptides [10], indicated that the SRP1 core region adopted a fold very similar to the carboxyl-terminal region of the vertebrate EGF, though they had very low sequence similarities. Interestingly, plasmatocyte-spreading peptide 1
(PSP1) from insect Pseudoplusia includens showing very
similar structural characteristics of its core region also adopted a fold with close similarity to the C-terminal subdomain of EGF-like module 5 of human thrombomodulin (hTM5) [37]. The sequence identity between PSP1 and SRP1 was limited to mainly cysteine, glycine, tyrosine residues and
structures of human epidermal growth factor (hEGF) and the hTM5 shared the general structural features of the family of EGF-like domains [38, 39]. These findings suggested that SRP1 interactions with its receptor may be analogous to EGF-receptor interactions to trigger the biological function of this stress response peptide.
4. Conclusion
In the M. sexta genome there are 11 encoded small
Acknowledgements
This work was supported by National Institutes of Health Grants GM58634 and AI112662 (to HJ) and GM41248 (MK). We also thank K-INBRE (P20GM103418) program
support for molecular dynamic studies. This article was approved for publication by the Director of the Oklahoma Agricultural Experiment Station and supported in part under project OKLO3054. Contribution number 19-332-J from the Kansas Agricultural Experiment Station.
Appendix
Supplementary Material
Figure A1. Transcript levels of M. sexta SRP1 gene in the 52 tissue samples. The relative mRNA levels, as represented by FPKM values, are shown in bar graphs. The 52 cDNA libraries (1 through 52) were constructed from the following tissues and stages: head [1. 2nd (instar) L (larvae), d1 (day 1); 2. 3rd L, d1;
3. 4th L, d0.5; 4. 4th L, late; 5. 5th L, d0.5; 6. 5th L, d2; 7. 5th L, pre-W (pre-wandering); 8. P (pupae), late; 9. A (adults), d1; 10. A, d3; 11. A, d7], fat body (12.
4th L, late; 13. 5th L, d1; 14. 5th L, pre-W; 15. 5th L, W; 16. P, d1-3; 17. P, d15-18; 18. A, d1-3; 19. A, d7-9), whole animals [20. E (embryos), 3h; 21. E, late; 22.
1st L; 23. 2nd L; 24. 3rd L), midgut (25. 2nd L; 26. 3rd L; 27. 4th L, 12h; 28. 4th L, late; 29. 5th L, 1-3h; 30. 5th L, 24h; 31. 5th L, pre-W; 32-33. 5th L, W; 34. P, d1;
35. P, d15-18; 36. A, d3-5; 37. 4th L, 0h), Malpighian tubules (MT) (38. 5th L, pre-W; 39. A, d1; 40. A, d3), muscle (41. 4th L, late; 42-43. 5th L, 12h; 44-45. 5th
L, pre-W; 46-47. 5th L, W), testis (48. P, d3; 49. P, d15-18; 50. A, d1-3), and ovary (51. P, d15-18; 52. A, d1). Some libraries are from single-end sequencing;
the others are from paired-end sequencing. Due to method differences, some synonymous libraries exhibit different FPKMs.
Figure A2. Fingerprint region (HN-HN) of 2D 1H-1H NOESY spectrum. Uniquely assigned inter-residue NOEs are labeled by residue name, residue number,
Figure A3. CαH chemical shift index (∆CαH) of individual residues in SRP1. Reference chemical shift values are based upon published random coil values [40]. Bars represent difference between published values and values observed during NMR acquisition for SRP1.
References
[1] Jiang, H., Vilcinskas, A. Kanost, M. R., Immunity in Lepidopteran Insects. Adv Exp Med Biol 2010, 708, 181-204.
[2] Strand, M. R., The insect cellular immune response. Insect Sci
2008, 15 (1), 1-14.
[3] Kanost, M. R., Jiang, H., Clip-domain serine proteases as immune factors in insect hemolymph. Curr Opin Insect Sci
2015, 11, 47-55.
[4] Lemaitre, B., Hoffmann, J., The host defense of Drosophila melanogaster. Annual Review of Immunology 2007, 25, 697-743.
[5] Cao, X. L., He, Y., Hu, Y. X., Zhang, X. F., Wang, Y., Zou, Z., Chen, Y. R., Blissard, G. W., Kanost, M. R., Jiang, H. B., Sequence conservation, phylogenetic relationships, and expression profiles of nondigestive serine proteases and serine protease homologs in Manduca sexta. Insect Biochem Molec
2015, 62, 51-63.
[6] Schrag, L. G., Cao, X., Herrera, A. I., Wang, Y., Jiang, H., Prakash, O., NMR Structural Studies of Stress Response Peptide-2 from the Insect Manduca sexta. Protein & Peptide Letters 2017, 24 (1), 3-11.
[7] Schrag, L. G., Herrera, A. I., Cao, X., Prakash, O., Jiang, H.; Structure and Function of Stress-Responsive Peptides in Insects. In Peptide-based Drug Discovery (Srivastava, V., Ed.), 2017; pp 438-451. The Royal Society of Chemistry, London, England.
[8] Skinner, W. S., Dennis, P. A., Li, J. P., Summerfelt, R. M., Carney, R. L., Quistad, G. B., Isolation and identification of paralytic peptides from hemolymph of the lepidopteran insects Manduca sexta, Spodoptera exigua, and Heliothis virescens. J Biol Chem 1991, 266 (20), 12873-7.
[9] Wang, Y., Jiang, H., Kanost, M. R., Biological activity of Manduca sexta paralytic and plasmatocyte spreading peptide and primary structure of its hemolymph precursor. Insect Biochem Molec 1999, 29 (12), 1075-1086.
[10] Yu, X. Q., Prakash, O., Kanost, M. R., Structure of a paralytic
peptide from an insect, Manduca sexta. J Pept Res 1999, 54
(3), 256-61.
[11] Dunn, P. E., Drake, D. R., Fate of Bacteria Injected into Naive and Immunized Larvae of the Tobacco Hornworm Manduca-Sexta. J Invertebr Pathol 1983, 41 (1), 77-85.
[12] Rieu, I., Powers, S. J., Real-Time Quantitative RT-PCR: Design, Calculations, and Statistics. Plant Cell 2009, 21 (4), 1031-1033.
[13] Rance, M., Sorensen, O. W., Bodenhausen, G., Wagner, G., Ernst, R. R., Wuthrich, K., Improved spectral resolution in COSY H-1 NMR spectra of proteins via Double Quantum Filtering BiochemBiophys.Res.Commun., 1983, 117, 479-485.
[14] Bax, A., Davis, D. G., Mlev-17-Based Two-Dimensional Homonuclear Magnetization Transfer Spectroscopy. J Magn Reson 1985, 65 (2), 355-360.
[15] Kumar, A., Ernst, R. R., Wuthrich, K., A two-dimensional nuclear Overhauser enhancement (2D NOE) experiment for the elucidation of complete proton-proton cross-relaxation networks in biological macromolecules. Biochem Biophys Res Commun 1980, 95 (1), 1-6.
[16] Piotto, M., Saudek, V., Sklenar, V., Gradient-Tailored Excitation for Single-Quantum Nmr-Spectroscopy of Aqueous-Solutions. J Biomol Nmr 1992, 2 (6), 661-665.
[17] Vranken, W. F., Boucher, W., Stevens, T. J., Fogh, R. H., Pajon, A., Llinas, P., Ulrich, E. L., Markley, J. L., Ionides, J., Laue, E. D., The CCPN data model for NMR spectroscopy: Development of a software pipeline. Proteins 2005, 59 (4), 687-696.
[18] Goddard, T. K., DG, Sparky 3. University of California, San Francisco 2004, 15 (20).
[19] Wuthrich, K., NMR of Proteins and Nucleic Acids. New York: John Wiley & Sons 1986, 93-113.
[20] Brunger, A. T., Adams, P. D., Clore, G. M., DeLano, W. L., Gros, P., Grosse-Kunstleve, R. W., Jiang, J. S., Kuszewski, J., Nilges, M., Pannu, N. S., Read, R. J., Rice, L. M., Simonson, T., Warren, G. L., Crystallography & NMR system: A new software suite for macromolecular structure determination.
Acta Crystallographica Section D-Biological Crystallography
[21] Stein, E. G., Rice, L. M., Brunger, A. T., Torsion-angle molecular dynamics as a new efficient tool for NMR structure calculation. J Magn Reson 1997, 124 (1), 154-64.
[22] Humphrey, W., Dalke, A., Schulten, K., VMD: visual molecular dynamics. J Mol Graph 1996, 14 (1), 33-8, 27-8.
[23] Laskowski, R. A., Rullmannn, J. A., MacArthur, M. W., Kaptein, R., Thornton, J. M., AQUA and PROCHECK-NMR: programs for checking the quality of protein structures solved by NMR. J Biomol Nmr 1996, 8 (4), 477-86.
[24] Brooks, B. R., Brooks III, C. L., Mackerell Jr, A. D., Nilsson, L., Petrella, R. J., Roux, B., Won, Y., Archontis, G., Bartels, C., Boresch, S., CHARMM: the biomolecular simulation program. Journal of computational chemistry 2009, 30 (10), 1545-1614.
[25] Brooks, B. R., Bruccoleri, R. E., Olafson, B. D., States, D. J., Swaminathan, S. A., Karplus, M., CHARMM: a program for macromolecular energy, minimization, and dynamics calculations. Journal of computational chemistry 1983, 4 (2), 187-217.
[26] Mark, P., Nilsson, L., Structure and Dynamics of the TIP3P, SPC, and SPC/E Water Models at 298 K. The Journal of Physical Chemistry A 2001, 105 (43), 9954-9960.
[27] Huang, J., MacKerell, A. D., Jr., CHARMM36 all-atom additive protein force field: validation based on comparison to NMR data. Journal of computational chemistry 2013, 34 (25), 2135-2145.
[28] Phillips, J. C., Braun, R., Wang, W., Gumbart, J., Tajkhorshid, E., Villa, E., Chipot, C., Skeel, R. D., Kale, L., Schulten, K., Scalable molecular dynamics with NAMD. Journal of computational chemistry 2005, 26 (16), 1781-1802.
[29] Darden, T., York, D., Pedersen, L., Particle mesh Ewald: An N⋅ log (N) method for Ewald sums in large systems. The Journal of chemical physics 1993, 98 (12), 10089-10092.
[30] Hopkins, C. W., Le Grand, S., Walker, R. C., Roitberg, A. E., Long-Time-Step Molecular Dynamics through Hydrogen Mass Repartitioning. Journal of Chemical Theory and Computation 2015, 11 (4), 1864-1874.
[31] Ryckaert, J.-P., Ciccotti, G., Berendsen, H. J., Numerical
integration of the cartesian equations of motion of a system with constraints: molecular dynamics of n-alkanes. Journal of computational physics 1977, 23 (3), 327-341.
[32] Hess, B., Kutzner, C., Van Der Spoel, D., Lindahl, E., GROMACS 4: algorithms for highly efficient, load-balanced, and scalable molecular simulation. Journal of chemical theory and computation 2008, 4 (3), 435-447.
[33] Daura, X., Gademann, K., Jaun, B., Seebach, D., Van Gunsteren, W. F., Mark, A. E., Peptide folding: when simulation meets experiment. Angewandte Chemie International Edition 1999, 38 (1-2), 236-240.
[34] Shin, S. W., Park, S. S., Park, D. S., Kim, M. G., Kim, S. C., Brey, P. T., Park, H. Y., Isolation and characterization of immune-related genes from the fall webworm, Hyphantria cunea, using PCR-based differential display and subtractive cloning. Insect Biochem Molec 1998, 28 (11), 827-837.
[35] He, Y., Cao, X., Li, K., Hu, Y., Chen, Y. R., Blissard, G., Kanost, M. R., Jiang, H., A genome-wide analysis of antimicrobial effector genes and their transcription patterns in Manduca sexta. Insect Biochem Mol Biol 2015, 62, 23-37.
[36] Zhang, S. G., Gunaratna, R. T., Zhang, X. F., Najar, F., Wang, Y., Roe, B., Jiang, H. B., Pyrosequencing-based expression profiling and identification of differentially regulated genes from Manduca sexta, a lepidopteran model insect. Insect Biochem Molec 2011, 41 (9), 733-746.
[37] Volkman, B. F., Anderson, M. E., Clark, K. D., Hayakawa, Y., Strand, M. R., Markley, J. L., Structure of the insect cytokine peptide plasmatocyte-spreading peptide-1 from Pseudoplusia includens. J Biol Chem 1999, 274, 4493-4496.
[38] Hommel, U., Harvey, T. S., Driscol, P. C., and Campbell, I. C., Human epidermal growth factor: High resolution solution structure and comparison with human transofrming growth factor α. J Molecular Biol 1992, 227, 271-282.
[39] Samoili-Benitez, B. A., Hunter, M. J., Meininger, D. P., and Komives, E. A., Structure of the fifth EGF-like domain of thrombomodulin: An EGF-like domain with a novel disulfide-bonding pattern. J Molecular Biol 1997, 273, 913-920.


![Figure A3. CαH chemical shift index (∆CαH) of individual residues in SRP1. Reference chemical shift values are based upon published random coil values [40]](https://thumb-us.123doks.com/thumbv2/123dok_us/9533692.1482526/10.595.120.478.76.254/figure-chemical-individual-residues-reference-chemical-values-published.webp)
