Disability 3, 12, and 24 Months After Traumatic Brain
Injury Among Children and Adolescents
WHAT’S KNOWN ON THIS SUBJECT: Significant impairments have been found in many domains of neuropsychological functioning after TBI, although the degree to which these impairments affect quality of life and activities is not clear.
WHAT THIS STUDY ADDS: Children with moderate or severe TBI and children with mild TBI who had intracranial hemorrhage had substantial reduction in their quality of life, participation in activities, and ability to communicate and care for themselves.
abstract
OBJECTIVE:To examine disability in children and adolescents after traumatic brain injury (TBI) across the spectrum of injury severity.
METHODS:This was a prospective cohort study of children younger
than 18 years treated for a TBI (n⫽729) or an arm injury (n⫽197)
between March 1, 2007, and September 30, 2008. The main outcome measures were disability in health-related quality of life, adaptive skills, and participation in social and community activities 3, 12, and 24 months after injury compared with preinjury functioning.
RESULTS:The health-related quality of life for children with moderate or severe TBI was lower at all follow-up times compared with baseline, but there was some improvement during the first 2 years after injury. Three months after injury, there was a substantial decrease in the level of activities in which children with moderate and severe TBI were able to participate; these activities improved at 12 and 24 months but were still significantly impaired. Communication and self-care abilities in children with moderate and severe TBI were lower at 3 months than at baseline and did not improve by 24 months. Children who met the definition of mild TBI but had an intracranial hemorrhage had lower quality-of-life scores at 3 months.
CONCLUSIONS:Children with moderate or severe TBI and children with mild TBI who had intracranial hemorrhage had substantial long-term reduction in their quality of life, participation in activities with
others, and ability to communicate and care for themselves.Pediatrics
2011;128:e1129–e1138 AUTHORS:Frederick P. Rivara, MD, MPH,a,b,cThomas D.
Koepsell, MD, MPH,b,cJin Wang, PhD, MS,a,cNancy Temkin,
PhD,d,eAndrea Dorsch, PhD,fMonica S. Vavilala, MD,a,c,g
Dennis Durbin, MD, MSCE,hand Kenneth M. Jaffe, MDc,e,f
Departments ofaPediatrics,bEpidemiology,dBiostatistics, eNeurological Surgery,fRehabilitation Medicine, and gAnesthesiology andcHarborview Injury Prevention and Research Center, University of Washington, Seattle, Washington; andhDepartment of Emergency Medicine, The Children’s Hospital of Philadelphia and University of Pennsylvania, Philadelphia, Pennsylvania
KEY WORDS
traumatic brain injury, disability, functional outcome
ABBREVIATIONS
TBI—traumatic brain injury ED—emergency department
CDC—Centers for Disease Control and Prevention GCS—Glasgow Coma Scale
CT—computed tomography AIS—Abbreviated Injury Scale
PedsQL—Pediatric Quality of Life Inventory
ABAS-II—Adaptive Behavior Assessment System-Second Edition CASP—Child and Adolescent Scale of Participation
www.pediatrics.org/cgi/doi/10.1542/peds.2011-0840
doi:10.1542/peds.2011-0840
Accepted for publication Jul 12, 2011
Address correspondence to Frederick P. Rivara, MD, MPH, Harborview Injury Prevention and Research Center, Box 359960, 325 Ninth Ave, Seattle, WA 98104. E-mail: fpr@uw.edu
PEDIATRICS (ISSN Numbers: Print, 0031-4005; Online, 1098-4275).
Copyright © 2011 by the American Academy of Pediatrics
Much attention has been focused on mortality from traumatic brain injury
(TBI) in children1–6and on specific
im-pairments in neuropsychological
func-tioning in survivors.7–11Significant
im-pairments have been found in many domains of neuropsychological
func-tioning after TBI,12–14 although the
de-gree to which these impairments af-fect quality of life and activities is not
clear. Neuropsychological
impair-ments after pediatric TBI are believed to manifest as chronic disability in 2 primary areas: (1)
educational/aca-demic15 and (2) behavioral, social,
emotional, and adaptive
function-ing.10,16,17 However, large, prospective
studies that cover the range of TBI se-verity have been “relatively rare, and many questions on the range of func-tional outcomes among children with
TBI remain.”11 Not only can
impair-ments from pediatric TBI be long-standing, such that there is no “recov-ery” of lost skills, but many children also fail to acquire new skills at a
de-velopmentally appropriate rate.18,19
Young children seem particularly vul-nerable to long-term effects, because injury to young brains might severely
affect subsequent brain
develop-ment.18,20,21 Although the results of
most studies suggest that mild TBI does not lead to the long-term neuro-psychological sequelae and functional disability associated with severe TBI, there is some evidence of more subtle and perhaps more variable sequelae with mild TBI that might affect return to school and daily functioning. Recent studies have been focused on concus-sion, but the reports have been con-cerned primarily with physical
symp-toms22,23 and decisions regarding
return to play (sports)24,25and have not
included an examination of disability and functioning in a wider variety of domains.
This study was undertaken to examine level of disability, as measured by
health-related quality of life, adaptive skills, and participation in activities, among children and adolescents after TBI. This study adds to the literature an examination of disability in a large sample across the spectrum of sever-ity. We sought to determine the extent of disability in all areas of functioning for children with mild, moderate, or severe TBI and to describe the time course of disability over the 24 months after injury. We hypothesized that dis-ability would be more common in chil-dren with more severe injury and that this disability would lessen but not re-solve over time since injury. We also hypothesized that there would be no long-term disability in those with mild TBI.
Disability was operationalized accord-ing to the World Health Organization model (International Classification of
Functioning26) as an umbrella term for
impairments, activity limitations, and
participation restrictions. In this
model, TBI potentially affects body function and structures, modified by factors such as age, gender, preexist-ing functionpreexist-ing, and results in impair-ments that might be temporary or per-manent, might change over time, and might be mild or severe. In this article, we report on quality of life, adaptive functioning, and participation in social and community activities, adjusted for age, gender, and functioning before the injury. Findings regarding educa-tional/academic functioning will be presented in a separate report.
METHODS
Patient Population
All study procedures were approved by the human subject committees of par-ticipating institutions. We sought to identify all children younger than 18 years treated either in the emergency department (ED) or as inpatients in a study hospital and discharged alive for either a TBI or an arm injury. All 18
hospitals in King County, Washington, with EDs serving children were classi-fied into 3 strata: the regional chil-dren’s hospital and the only level 1 trauma center; the 7 level 3 and level 4 trauma centers; and the 9 other non-trauma centers. Both hospitals in the first stratum were included; 4 and 3 hospitals were randomly sampled from the second and third strata, re-spectively. Not all hospitals were sam-pled, because the projected number of mild TBI cases needed did not require all possible patients to be included. In addition, inpatients with TBI treated at the Children’s Hospital of Philadelphia were included to increase the number of more severely injured, younger
chil-dren. As described previously,27study
participants were selected by
computer-generated random number from the list of all eligible children who were treated between March 1, 2007, and September 30, 2008, and con-tacted. Different proportions of chil-dren were sampled depending on age group, gender, TBI versus arm injury, and whether hospitalized within the TBI group. This was done to ensure that there was representation across age and gender groups in the study participants.
Definition and Severity of TBI The definition of TBI used was from a 2002 Centers for Disease Control and
Prevention (CDC) report28: an injury to
the head with decreased level of con-sciousness, amnesia, and/or neuro-logic or neuropsychoneuro-logical abnormal-ity or diagnosed intracranial lesion.
We used CDC29and World Health
Orga-nization30definitions to define mild TBI:
(1) any period of transient confusion, disorientation, or impaired conscious-ness as recorded in the medical re-cord or (2) any period of amnesia that
lasted⬍24 hours or (3) signs of other
the time of the first medical evaluation and a GCS score of 15 at discharge from the ED or 24 hours after injury if hospitalized. Mild TBI was further sub-divided into 3 subcategories: mild I, no abnormalities on computed tomogra-phy (CT) or no CT was performed; mild II, skull fracture without intracranial hemorrhage; and mild III, intracranial hemorrhage but case still met criteria for mild TBI. Moderate TBI was defined by a best motor GCS score 24 hours after injury of 4 or 5 or a score of 6 for cases that did not meet the criteria for
mild TBI.29Severe TBI was defined as a
best motor GCS score 24 hours after injury of 1 to 3. Abbreviated Injury Scale (AIS) coding of head injuries was performed manually by 1 investigator
(Dr Rivara) using the 2008 AIS.31
Definition of Control Patients We used as controls patients with iso-lated arm injury who were treated in the same King County study hospitals as those with TBI, consistent with CDC
recommendations32and our previous
studies.33–35Fifty controls were sought
from each of the 4 age groups (0 – 4, 5–9, 10 –14, and 15–17 years), and they were frequency matched on gender to patients with mild TBI. Sampling of con-trols proceeded concurrently with TBI case recruitment.
Procedures
A baseline survey was administered to 1 parent and to adolescents aged 14 years or older, if cognitively able, as soon as possible after injury (median: 37.0 days). Follow-up surveys were conducted 3, 12, and 24 months after the date of the index injury with par-ents and with those adolescpar-ents aged 14 years or older who were able to complete the survey. In addition to ob-taining information on the standard measures described below, we also obtained self-report data on the poten-tial confounders of race/ethnicity,
in-surance, household income, and re-spondent education.
Measures
The Pediatric Quality of Life Inventory
(PedsQL)36 is a measure of
health-related quality of life that assesses physical, emotional, social, and school
functioning of children aged 24
months and older. The PedsQL has been shown to be reliable and valid and has been used previously for
chil-dren with trauma including TBI.37–40Six
additional items from the cognitive functioning scales of the PedsQL multi-dimensional fatigue scale that assess memory, attention, and processing speed were also included, in keeping
with previous studies of pediatric TBI.41
Total PedsQL scores range from 0 to 100; higher scores indicate higher quality of life. A 4.5-point change in the PedsQL total score for parent proxy re-port has been judged to represent a
clinically meaningful difference.36Per
the designers of the PedsQL, separate forms were used for those aged 24 months to younger than 5 years and those aged 5 years or older.
The Adaptive Behavior Assessment System-Second Edition (ABAS-II) is a comprehensive, norm-referenced as-sessment of adaptive skills with
excel-lent reliability and validity.42It is widely
used to evaluate people with neuro-logic disorders including TBI. There are 9 subscales in the ABAS-II; we used the communication and the self-care subscales, for which the mean score among healthy people is 10 (SD: 3); higher scores indicate better function-ing, and scores below 8 represent below-average functioning. Separate forms are used for those younger than 2, 2 to 5, and 5 years or older.
The Child and Adolescent Scale of Par-ticipation (CASP) is a 20-item measure that assesses the involvement of chil-dren aged 5 years and older in various activities at home, at school, and in the
community, including play, interaction with friends, structured activities, and
educational activities.43Total summary
scores range from 0 to 100; higher scores indicate better participation.
Previous studies have shown that pre-injury family functioning is an impor-tant predictor of a child’s function
af-ter injury, including TBI.44We used the
self-report McMaster Family Assess-ment Device to measure family func-tioning and emotional relationships within the family. We used the
12-item general functioning scale,
which assesses overall health and psychopathology within the family
system.45Scores range from 11 to 41;
higher scores indicate worse family functioning.
Medical Record Data
Charts were abstracted by the princi-pal investigator (Dr Rivara) or a trained research nurse using an on-line standardized abstraction form; they were blinded to the baseline and outcome measures. CT scans of the head were reviewed by pediatric neu-roradiologists blinded to the baseline and outcome data. These data were used in the assignment of the head AIS score and in further stratifying pa-tients with mild TBI.
Data Analysis
Multiple imputation was used to ac-count for missing medical record
vari-ables. Data were missing for⬍5% of
the patients on most of the variables. Ten imputed data sets were created, and age, hospital, and ED disposition were used as predictors.
clustering within hospitals, robust SEs were computed.
We performed predictive modeling on the outcome of the PedsQL 3, 12, and 24 months after injury separately. The po-tential independent variables included age, gender, TBI-severity group, house-hold income, respondent education, lowest motor GCS score in the ED,
Mc-Master Family Assessment Device
score at baseline, and PedsQL score at baseline. Injury type and baseline PedsQL scores were forced into the model, and the other potential inde-pendent variables listed previously were added if they changed the point
estimate by⬎10%.
Because the demographic character-istics of the children from the Philadel-phia hospital differed from those of the King County hospitals, analyses were conducted with and without the Phila-delphia patients. These characteris-tics were similar, so only the results with all patients are shown.
RESULTS
Study Patients
There were 2940 patients with a diag-nosis of TBI and 2371 patients with arm injuries treated at the study hospitals during the recruitment period. We ran-domly selected 2179 potential patients with TBI and 694 patients with arm in-jury (74.1% and 29.3% of those treated, respectively); the probability of selec-tion varied according to age, gender, and hospital admission. Of these pa-tients, 1519 with TBI and 381 with arm injury were contacted; 660 and 313, re-spectively, were not able to consent be-cause of missing or incorrect contact information, passive refusals, or expi-ration of the time window for partici-pation in the study. Of those contacted, 347 and 44 children, respectively, were found in a screening telephone inter-view with the parent or after subse-quent medical record review not to have had the injury in question.
Par-ents of 443 children with TBI and 140 children with arm injury refused par-ticipation. Thus, 729 patients with TBI (62.2% of contacted patients later de-termined to be eligible) and 197 with arm injury (58.5% of contacted pa-tients determined to be eligible) were enrolled in the study, and all of them
completed the baseline interview.
Follow-up interviews were completed for 96.8% of the patients with TBI and 96.4% of the patients with arm injury at 3 months, 90.5% and 92.4%, respec-tively, at 12 months, and 87.1% and 90.9%, respectively, at 24 months. En-rollees were of similar age (109.7 vs
106.3 months; P ⫽ .41) and gender
(34.3% vs 35.0% female;P⫽.83) but
more likely to have moderate or severe
TBI (13.5% vs 2.5%;P⫽.001) and less
likely to have been seen at lower-level
trauma centers (20.6% vs 36.7%;P⬍
.0001) than those selected but not enrolled.
Most (84.5%) of the study patients with TBI had mild TBI, 13.2% had moderate TBI, and only 2.3% had severe injuries (Table 1). Children in the mild I TBI group were less likely to be older teens than those in the other TBI-severity groups. The age range of participants at the time of injury was 2 months to 17 years (with the exception of 1 patient who had just turned 18). Nonwhite race/ethnicity, Medicaid insurance, lower education, and lower household income were overrepresented among those with severe injuries, in part be-cause of the larger proportion of mi-nority patients cared for at the Chil-dren’s Hospital of Philadelphia (which only enrolled patients with moderate or severe TBI) compared with Seattle-area hospitals.
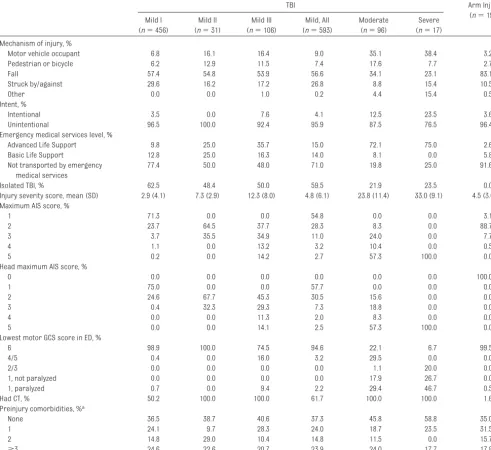
Injury Characteristics
Falls accounted for 56.6% of those with mild TBI but only 34.1% of those with moderate TBI and 23.1% of those with severe TBI (Table 2). Motor vehicle
occupant injuries were the most com-mon cause of injury in those with mod-erate or severe TBI. Among those chil-dren with mild TBI, 76.9% either did not have a CT scan (38.3% of all mild TBI) or had no abnormalities on CT (mild I TBI group), 5.2% had mild TBI complicated by skull fracture (mild II TBI group), and 17.9% were found to have intracranial hemorrhage (mild III TBI group). Rela-tively few children with moderate or se-vere TBI had an isolated TBI, defined as
no other injury with an AIS score ofⱖ1.
In contrast, the majority of those with mild TBI had an isolated TBI.
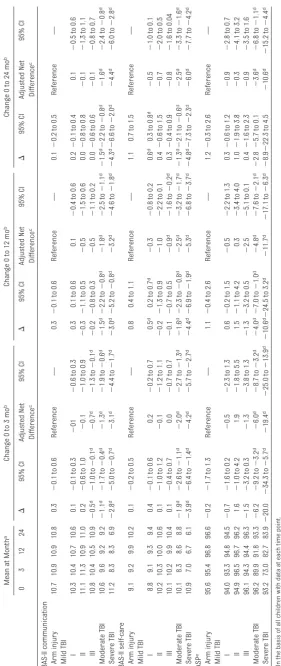
Activities and Adaptive Skills Tables 3 and 4 list the main disability results at 3, 12, and 24 months. The columns labeled “mean at month” list the mean score for all children as-sessed at each time point. Thus, the month-zero average includes some children who did not participate in the follow-up outcome assessment.
The change (⌬) columns are based on
the slightly smaller subset of children who were assessed at both baseline and the follow-up time in question. The “adjusted net difference” lists the esti-mated change for each TBI subgroup, above and beyond the change ob-served in children with arm injury, ad-justing for confounders. The adjusted net difference estimate is from the mixed-model analysis, in which data from all study children were used.
diminished and were not significant by 12 months after injury. Self-care scores were also lower than those at baseline in the moderate and severe TBI groups at 3 months and did not improve by 24 months (Table 3). The small differences in self-care among those in the mild TBI I group were not significant after con-sidering the changes in the controls with arm injury.
Three months after injury, there was a substantial decrease in the level of so-cial and community activities in which children with moderate and severe TBI were able to participate, as measured by the CASP (Table 3). These activities improved by 12 months but were still significantly impaired. There was
an-other small improvement at 24
months.
Health-Related Quality of Life
In all groups, the PedsQL score was lower at 3 months than at baseline; children in the moderate and severe TBI groups scored 17.6 and 30.9 points lower, respectively (Table 4). Children in the mild III group had lower scores at 3 months than those in the other 2 mild TBI groups. Although there
TABLE 1 Characteristics of the Study Population (N⫽926)
TBI Arm Injury
(n⫽197)
Mild I
(n⫽479)
Mild II
(n⫽31)
Mild III
(n⫽106)
Mild, All
(n⫽616)
Moderate
(n⫽96)
Severe
(n⫽17)
Age at injury, %
0–4 y 28.7 12.9 28.3 28.6 38.5 29.4 32.0
5–9 y 23.5 38.7 20.8 23.5 11.5 17.7 21.3
10–14 y 28.5 22.6 23.6 27.1 24.0 23.5 27.9
15–17 y 19.3 25.8 27.4 20.8 26.0 29.4 18.8
Gender, %
Male 61.8 77.4 74.5 64.6 68.8 70.6 61.9
Female 38.2 22.6 25.5 35.4 31.2 29.4 38.1
King County hospitals, %
HMC 18.0 71.0 80.2 30.7 71.9 41.2 5.1
Seattle Children’s 54.2 16.1 5.7 45.6 3.1 35.3 56.4
Other trauma centers 26.4 9.7 3.8 20.7 1.0 0.0 32.4
Other nontrauma centers 1.3 3.2 0.0 1.1 0.0 0.0 6.1
Pennsylvania hospital: Children’s Hospital of Philadelphia, %
0.2 0.0 10.4 2.0 24.0 23.5 0.0
Race/ethnicity, %
White, non-Hispanic 66.7 80.7 65.1 65.9 49.0 23.5 65.5
Black, non-Hispanic 2.2 0.0 7.6 3.3 11.5 23.5 2.5
Hispanic 8.1 6.5 10.4 9.1 15.6 17.7 12.2
Asian 1.8 0.0 4.7 2.1 2.1 5.9 3.1
Other or multiple 21.1 9.7 12.3 19.2 21.9 29.4 16.8
Unknown 0.2 3.2 0.0 0.5 0.0 0.0 0.0
Health insurance, %
None 1.8 6.5 6.6 2.9 11.5 5.9 2.0
Medicaid 25.2 25.8 18.9 25.0 36.5 64.7 25.9
Private 70.8 67.7 68.9 69.3 50.0 11.8 71.1
Tricare/CHAMPUS 0.2 0.0 5.7 1.1 2.1 11.8 0.0
Basic health 2.0 0.0 0.0 1.5 0.0 5.9 1.0
Unknown 0.0 0.0 0.0 0.2 0.0 0.0 0.0
Household income, %
Less than $30 000 20.4 25.8 21.7 21.6 30.2 41.2 16.8
$30 000–$60 000 17.1 16.1 19.8 17.4 27.1 35.3 15.7
$60 000–$100 000 19.1 29.0 28.3 20.9 21.9 5.9 25.4
More than $100 000 39.3 22.6 24.5 35.4 14.6 0 37.6
Unknown 4.2 6.5 5.7 4.7 6.3 17.7 4.6
Respondent parent’s education, %
Less than high school 7.0 6.5 11.3 8.0 18.8 23.5 9.1
High school/GED 12.1 16.1 17.9 13.6 29.2 29.4 11.2
Some college 27.6 35.5 34.0 29.1 29.2 35.3 25.4
College graduate 30.0 32.3 19.8 28.1 15.6 0.0 33.0
Post-college 23.3 9.7 16.0 20.9 7.3 5.9 20.8
Unknown 0.0 0.0 0.9 0.3 0.0 5.9 0.5
Family Assessment Device baseline score, mean (SD)
18.2 (5.0) 17.8 (4.9) 17.5 (4.7) 18.0 (4.9) 18.8 (5.3) 21.5 (5.4) 17.5 (4.9)
was some improvement by 12 months and another small improvement by 24 months, PedsQL scores remained sig-nificantly lower than those at baseline for children with moderate and severe TBI. By 12 months, those in the mild III TBI group had scores that were not sig-nificantly different from those at base-line. The changes from baseline in the PedsQL scores in the other mild TBI groups were small and not significant
after adjusting for the changes in the controls with arm injury.
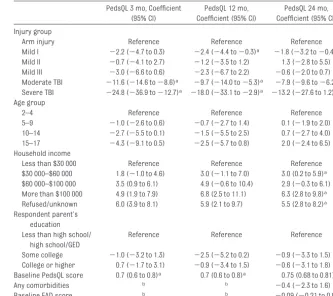
Multivariate Predictors
At 3 months, children with moderate or severe TBI had a significantly lower qual-ity of life than those in the arm-injury group (Table 5). These differences were still substantial for those in the moder-ate and severe TBI groups at both 12 and 24 months. Among children in
the mild TBI I group, quality-of-life scores were lower at all follow-up times and were statistically, but not clinically, significant at the 12- and 24-month follow-up times. Gen-erally, older children had larger decre-ments in their quality of life than did younger children, although none of these differences were significant.
Quality of life was higher in those with higher or not-reported
house-TABLE 2 Injury Characteristics From Chart Abstraction
TBI Arm Injury
(n⫽194)
Mild I
(n⫽456)
Mild II
(n⫽31)
Mild III
(n⫽106)
Mild, All
(n⫽593)
Moderate
(n⫽96)
Severe
(n⫽17)
Mechanism of injury, %
Motor vehicle occupant 6.8 16.1 16.4 9.0 35.1 38.4 3.2
Pedestrian or bicycle 6.2 12.9 11.5 7.4 17.6 7.7 2.7
Fall 57.4 54.8 53.9 56.6 34.1 23.1 83.1
Struck by/against 29.6 16.2 17.2 26.8 8.8 15.4 10.5
Other 0.0 0.0 1.0 0.2 4.4 15.4 0.5
Intent, %
Intentional 3.5 0.0 7.6 4.1 12.5 23.5 3.6
Unintentional 96.5 100.0 92.4 95.9 87.5 76.5 96.4
Emergency medical services level, %
Advanced Life Support 9.8 25.0 35.7 15.0 72.1 75.0 2.6
Basic Life Support 12.8 25.0 16.3 14.0 8.1 0.0 5.8
Not transported by emergency medical services
77.4 50.0 48.0 71.0 19.8 25.0 91.6
Isolated TBI, % 62.5 48.4 50.0 59.5 21.9 23.5 0.0
Injury severity score, mean (SD) 2.9 (4.1) 7.3 (2.9) 12.3 (8.0) 4.8 (6.1) 23.8 (11.4) 33.0 (9.1) 4.5 (3.0)
Maximum AIS score, %
1 71.3 0.0 0.0 54.8 0.0 0.0 3.1
2 23.7 64.5 37.7 28.3 8.3 0.0 88.7
3 3.7 35.5 34.9 11.0 24.0 0.0 7.7
4 1.1 0.0 13.2 3.2 10.4 0.0 0.5
5 0.2 0.0 14.2 2.7 57.3 100.0 0.0
Head maximum AIS score, %
0 0.0 0.0 0.0 0.0 0.0 0.0 100.0
1 75.0 0.0 0.0 57.7 0.0 0.0 0.0
2 24.6 67.7 45.3 30.5 15.6 0.0 0.0
3 0.4 32.3 29.3 7.3 18.8 0.0 0.0
4 0.0 0.0 11.3 2.0 8.3 0.0 0.0
5 0.0 0.0 14.1 2.5 57.3 100.0 0.0
Lowest motor GCS score in ED, %
6 98.9 100.0 74.5 94.6 22.1 6.7 99.5
4/5 0.4 0.0 16.0 3.2 29.5 0.0 0.0
2/3 0.0 0.0 0.0 0.0 1.1 20.0 0.0
1, not paralyzed 0.0 0.0 0.0 0.0 17.9 26.7 0.0
1, paralyzed 0.7 0.0 9.4 2.2 29.4 46.7 0.5
Had CT, % 50.2 100.0 100.0 61.7 100.0 100.0 1.6
Preinjury comorbidities, %a
None 36.5 38.7 40.6 37.3 45.8 58.8 35.0
1 24.1 9.7 28.3 24.0 18.7 23.5 31.5
2 14.8 29.0 10.4 14.8 11.5 0.0 15.7
ⱖ3 24.6 22.6 20.7 23.9 24.0 17.7 17.8
Medical records were not available from 26 patients.
aPreinjury comorbidities assessed included developmental delay, seizures, previous TBI with loss of consciousness, hemiplegia or paraplegia, lung disease, diabetes, attention-deficit/
hold incomes but was not signifi-cantly related to baseline family
functioning or parent-respondent
education.
DISCUSSION
This study of a large cohort of children younger than 18 years has revealed the significant impact of TBI on a wide variety of domains of functioning dur-ing the 2 years after injury. Children with moderate or severe TBI and chil-dren with mild TBI who had intracra-nial hemorrhage had substantial
re-duction in their quality of life,
participation in activities, and ability to communicate and care for themselves.
Certain limitations should be consid-ered. Measures of functional outcome were reported by a parent and might not have fully reflected the child’s own perceptions of their limitations. How-ever, parents’ report of their child’s health-related quality of life using the PedsQL has been shown to be reliable
and valid.46The ABAS-II is only
adminis-tered as a parent or teacher report of adaptive functioning at the ages of the study participants. The median time between injury and baseline interview was 37 days, which might have created recall biases on the part of the par-ents; the amount and direction of this bias is unknown. Not all children with mild TBI received a head CT scan at the initial assessment, which leaves the
possibility that some children in
the mild TBI I group might have had undetected abnormalities that would have placed them in a different mild TBI subgroup. We believe that such misclassification is likely to be minor given the liberal use of CT scans in our study institutions and nationally.
Children aged 2 years and older with moderate and severe TBI had large decrements in their quality of life. In studies of other children, a 4.5-point difference on the PedsQL is clinically
meaningful,36and a 5-point difference
on the PedsQL distinguishes
chroni-cally ill from healthy children.37In our
study, the quality of life of children with moderate and severe TBI was lower than that of children undergoing active
treatment for cancer.47
The lower quality of life in older chil-dren after TBI is supported by findings on other measures used in this study. Participation in life situations and events was impaired in children with moderate and severe TBI. The CASP
reflects disability participating in
movement-related activities and in communication and social activities at
school.48 Measurement of these
di-mensions was supplemented by the ABAS-II, which examined the effect of TBI on adaptive skills that are neces-sary for daily living. Studies of adults with childhood TBI have found that few
survivors have impaired self-care
skills for activities of daily living but
that impaired communication leads to lower quality of life for work and
leisure.49
Children with mild TBI are not a homo-geneous group. We categorized those with mild TBI into 3 groups on the basis of their CT findings, as previously sug-gested but not commonly done with
chil-dren.50–55Those with intracranial
hem-orrhage (mild TBI III) have been labeled as having “complicated mild TBI” by
others.56,57 The lower quality of life in
this group 3 months after injury that seemed to resolve by 12 months
sug-gests short-term adverse
conse-quences of mild TBI with intracranial
pathology and warrants further
exploration.
Children with mild TBI without any in-tracranial hemorrhage on CT scan, or for whom imaging was not performed, constituted the majority of children in
TABLE 4 Health-Related Quality of Life 3 and 12 Months After Injury PedsQL Mean at Month a Change 0 to 3 mo b Change 0 to 12 mo b Change 0 to 24 mo b 0 3 12 24 ⌬ 95% CI Adjusted Net Difference c 95% CI ⌬ 95% CI Adjusted Net Difference c 95% CI ⌬ 95% CI Adjusted Net Difference c 95% CI Arm injury 89.3 86.1 86.7 86.0 ⫺ 3.2 d ⫺ 4.7 to ⫺ 1.7 d Reference — ⫺ 2.6 d ⫺ 4.1 to ⫺ 1.1 d Reference — ⫺ 3.5 d ⫺ 5.1 to ⫺ 2.0 d Reference — Mild TBI I 85.6 81.1 82.1 82.0 ⫺ 4.7 d ⫺ 5.9 to ⫺ 3.4 d ⫺ 1.4 ⫺ 3.7 to 0.8 ⫺ 4.1 d ⫺ 5.4 to ⫺ 2.9 d ⫺ 1.4 ⫺ 3.7 to 0.9 ⫺ 4.6 d ⫺ 5.8 to ⫺ 3.4 d ⫺ 0.7 ⫺ 3.0 to 1.6 II 87.6 83.1 82.7 83.9 ⫺ 4.5 d ⫺ 8.2 to ⫺ 0.7 d ⫺ 1.3 ⫺ 6.2 to 3.7 ⫺ 4.6 d ⫺ 8.4 to ⫺ 0.8 d ⫺ 1.7 ⫺ 6.9 to 3.4 ⫺ 2.7 ⫺ 6.9 to 1.5 0.7 ⫺ 4.4 to 5.9 III 86.9 80.4 81.7 85.2 ⫺ 6.6 d ⫺ 9.2 to ⫺ 3.9 d ⫺ 3.3 ⫺ 6.6 to 0.0 ⫺ 4.9 d ⫺ 7.6 to ⫺ 2.1 d ⫺ 2.4 ⫺ 5.9 to 1.2 ⫺ 3.1 d ⫺ 5.8 to ⫺ 0.4 d 0.9 ⫺ 2.5 to 4.3 Moderate TBI 91.4 74.0 75.6 76.2 ⫺ 17.6 d ⫺ 21.6 to ⫺ 13.5 d ⫺ 14.0 d ⫺ 17.5 to ⫺ 10.5 d ⫺ 15.3 d ⫺ 19.3 to ⫺ 11.2 d ⫺ 12.5 d ⫺ 16.1 to ⫺ 8.8 d ⫺ 14.6 d ⫺ 18.5 to ⫺ 10.7 d ⫺ 10.7 d ⫺ 14.4 to ⫺ 7.1 d Severe TBI 88.6 56.6 66.4 68.1 ⫺ 30.9 d ⫺ 42.1 to ⫺ 19.7 d ⫺ 27.8 d ⫺ 35.4 to ⫺ 20.2 d ⫺ 22.1 d ⫺ 33.0 to ⫺ 11.2 d ⫺ 19.4 d ⫺ 27.0 to ⫺ 11.7 d ⫺ 19.1 d ⫺ 29.6 to ⫺ 8.6 d ⫺ 16.0 d ⫺ 23.6 to ⫺ 8.3 d aOn the basis of all children with data at each time point. bOn the basis of children with data at both time points. cNet change compared to arm-injury controls, adjusted for age, gender, race, insurance, parent income, and parent education, on the basis of all child ren. dSignificant result.
TABLE 5 Prediction Model of PedsQL at 3 and 12 Months for Children Aged 24 Months and Older PedsQL 3 mo, Coefficient
(95% CI)
PedsQL 12 mo, Coefficient (95% CI)
PedsQL 24 mo, Coefficient (95% CI)
Injury group
Arm injury Reference Reference Reference
Mild I ⫺2.2 (⫺4.7 to 0.3) ⫺2.4 (⫺4.4 to⫺0.3)a ⫺1.8 (⫺3.2 to⫺0.4)a
Mild II ⫺0.7 (⫺4.1 to 2.7) ⫺1.2 (⫺3.5 to 1.2) 1.3 (⫺2.8 to 5.5)
Mild III ⫺3.0 (⫺6.6 to 0.6) ⫺2.3 (⫺6.7 to 2.2) ⫺0.6 (⫺2.0 to 0.7)
Moderate TBI ⫺11.6 (⫺14.6 to⫺8.6)a ⫺9.7 (⫺14.0 to⫺5.3)a ⫺7.9 (⫺9.6 to⫺6.2)a
Severe TBI ⫺24.8 (⫺36.9 to⫺12.7)a ⫺18.0 (⫺33.1 to⫺2.9)a ⫺13.2 (⫺27.6 to 1.2)
Age group
2–4 Reference Reference Reference
5–9 ⫺1.0 (⫺2.6 to 0.6) ⫺0.7 (⫺2.7 to 1.4) 0.1 (⫺1.9 to 2.0)
10–14 ⫺2.7 (⫺5.5 to 0.1) ⫺1.5 (⫺5.5 to 2.5) 0.7 (⫺2.7 to 4.0)
15–17 ⫺4.3 (⫺9.1 to 0.5) ⫺2.5 (⫺5.7 to 0.8) 2.0 (⫺2.4 to 6.5)
Household income
Less than $30 000 Reference Reference Reference
$30 000–$60 000 1.8 (⫺1.0 to 4.6) 3.0 (⫺1.1 to 7.0) 3.0 (0.2 to 5.9)a
$60 000–$100 000 3.5 (0.9 to 6.1) 4.9 (⫺0.6 to 10.4) 2.9 (⫺0.3 to 6.1)
More than $100 000 4.9 (1.9 to 7.9) 6.8 (2.5 to 11.1) 6.3 (2.8 to 9.8)a
Refused/unknown 6.0 (3.9 to 8.1) 5.9 (2.1 to 9.7) 5.5 (2.8 to 8.2)a
Respondent parent’s education Less than high school/
high school/GED
Reference Reference Reference
Some college ⫺1.0 (⫺3.2 to 1.3) ⫺2.5 (⫺5.2 to 0.2) ⫺0.9 (⫺3.3 to 1.5)
College or higher 0.7 (⫺1.7 to 3.1) ⫺0.9 (⫺3.4 to 1.5) ⫺0.6 (⫺3.1 to 1.8)
Baseline PedsQL score 0.7 (0.6 to 0.8)a 0.7 (0.6 to 0.8)a 0.75 (0.68 to 0.81)a
Any comorbidities b b ⫺0.4 (⫺2.3 to 1.6)
Baseline FAD score b b ⫺0.09 (⫺0.21 to 0.04)
FAD indicates McMaster Family Assessment Device; GED, general equivalency diploma.
aSignificant result.
our study. These children also had somewhat lower quality of life both 3 and 12 months after injury. However, after adjusting for changes in the con-trols with arm injury, these differ-ences were small and not believed to be clinically significant. Nevertheless, given the large size of this group of children, further efforts to understand the reasons for persistent symptoms
and to develop effective treatments might be needed.
ACKNOWLEDGMENTS
This project was supported by the Na-tional Center for Injury Prevention and Control, CDC grant R49 CE 001021. The CDC had no role in the design or con-duct of the study; collection, manage-ment, analysis, or interpretation of the
data; or preparation, review, or ap-proval of the manuscript.
We thank Maria Roper Caldbeck, Eileen Houseknecht, and Andrea Miller for their work on subject recruitment and interviews and administrative sup-port. We thank the many children and parents who participated in this study and the study hospitals.
REFERENCES
1. Guice KS, Cassidy LD, Oldham KT. Traumatic injury and children: a national assessment.
J Trauma. 2007;63(6 suppl):S68 –S80; dis-cussion S81–S86
2. Odetola FO, Mann NC, Hansen KW, Patrick S, Bratton SL. Source of admission and out-comes for critically injured children in the
mountain States.Arch Pediatr Adolesc Med.
2010;164(3):277–282
3. Tilford JM, Aitken ME, Anand KJ, et al. Hos-pitalizations for critically ill children with traumatic brain injuries: a longitudinal
analysis. Crit Care Med. 2005;33(9):
2074 –2081
4. Sills MR, Libby AM, Orton HD. Prehospital and in-hospital mortality: a comparison of intentional and unintentional traumatic
brain injuries in Colorado children.Arch
Pe-diatr Adolesc Med. 2005;159(7):665– 670
5. Ventura T, Harrison-Felix C, Carlson N, et al. Mortality after discharge from acute care hospitalization with traumatic brain injury:
a population-based study.Arch Phys Med
Rehabil. 2010;91(1):20 –29
6. Shi J, Xiang H, Wheeler K, et al. Costs, mor-tality likelihood and outcomes of hospital-ized US children with traumatic brain
inju-ries.Brain Inj. 2009;23(7):602– 611
7. Babikian T, Asarnow R. Neurocognitive out-comes and recovery after pediatric TBI:
meta-analytic review of the literature.
Neu-ropsychology. 2009;23(3):283–296
8. Anderson V, Catroppa C, Morse S, Haritou F, Rosenfeld JV. Intellectual outcome from preschool traumatic brain injury: a 5-year
prospective, longitudinal study.Pediatrics.
2009;124(6). Available at: www.pediatrics. org/cgi/content/full/124/6/e1064
9. Muscara F, Catroppa C, Anderson V. The im-pact of injury severity on executive function 7–10 years following pediatric traumatic
brain injury.Dev Neuropsychol. 2008;33(5):
623– 636
10. Fay TB, Yeates KO, Wade SL, Drotar D, Stan-cin T, Taylor HG. Predicting longitudinal pat-terns of functional deficits in children with
traumatic brain injury.Neuropsychology.
2009;23(3):271–282
11. Kirkwood MW, Yeates KO. Neurobehavioral outcomes of pediatric mild traumatic brain
injury. In: Anderson V, Yeates KO, eds.
Pedi-atric Traumatic Brain Injury: New Frontiers in Clinical and Translational Research. Cambridge, United Kingdom: Cambridge University Press. 2010:94 –117
12. Ewings-Cobb L, Barnese M. Linguistic out-comes following traumatic brain injury in
children.Semin Pediatric Neurol. 2002;9(3):
209 –217
13. Fay GC, Jaffe KM, Polissar ML, Liao S, Rivara JB, Martin KM. Outcome of pediatric trau-matic brain injury at three years: a cohort
study.Arch Phys med Rehabil. 1994;75(7):
733–741
14. Yeates KO, Swift E, Taylor HG, et al. Short-and long-term social outcomes following
pediatric traumatic brain injury.J Int
Neu-ropsychol Soc. 2004;10(3):412– 426
15. Catroppa C, Anderson VA, Muscara F, et al. Educational skills: long-term outcome and predictors following paediatric traumatic
brain injury.Neuropsychol Rehabil. 2009;
19(5):716 –732
16. Muscara F, Catroppa C, Eren S, Anderson V. The impact of injury severity on long-term social outcome following paediatric
trau-matic brain injury.Neuropsychol Rehabil.
2009;19(4):541–561
17. Fletcher JM, Levin HS, Lachar D, et al. Behav-ioral outcomes after pediatric closed head injury: relationships with age, severity, and
lesion size. J Child Neurol. 1996;11(4):
283–290
18. Anderson VA, Catroppa C, Morse S, Haritou F, Rosenfeld J. Functional plasticity or
vul-nerability after early brain injury?
Pediat-rics. 2005;116(6):1374 –1382
19. Jaffe KM, Polissar NL, Fay GC, Liao S. Recov-ery trends over three years following
pedi-atric traumatic brain injury.Arch Phys Med
Rehabil. 1995;76(1):17–26
20. Wetherington CE, Hooper SR, Keenan HT,
Nocera M, Runyan D. Parent ratings of be-havioral functioning after traumatic brain
injury in very young children.J Pediatr
Psy-chol. 2010;35(6):662– 671
21. Ewing-Cobbs L, Barnes M, Fletcher JM, Levin H, Swank PR, Song J. Modeling of longitudi-nal academic achievement scores after
paediatric traumatic brain injury.
Develop-mental Neuropsychology. 2004;25(1–2): 107–133
22. Yeates KO, Taylor HG, Rusin J, et al. Longitu-dinal trajectories of postconcussive symp-toms in children with mild traumatic brain injuries and their relationship to acute
clin-ical status.Pediatrics. 2009;123(3):735–743
23. McCrea M, Guskiewicz K, Randolph C, et al. Effects of a symptom-free waiting period on clinical outcome and risk of reinjury after
sport-related concussion. Neurosurgery.
2009;65(5):876 – 882; discussion 882– 883
24. Kirkwood MW, Randolph C, Yeates KO. Re-turning pediatric athletes to play after concussion: the evidence (or lack thereof) behind baseline neuropsychological test-ing.Acta Paediatr. 2009;98(9):1409 –1411
25. Meehan WP 3rd, d’Hemecourt P, Comstock RD. High school concussions in the 2008 –2009 academic year: mechanisms,
symptoms, and management.Am J Sports
Med. 2010;38(12):2405–2409
26. World Health Organization.International
Classification of Functioning, Disability and Health. Geneva, Switzerland: World Health Organization; 2001
27. Koepsell TD, Rivara FP, Vavilala MS, Wang J, Temkin N, Temkin KM, Durbin DR. Incidence and descriptive epidemiology of traumatic brain injury in King County, WA children 2007–2008. 2011; In press
28. Marr AL, Coronado VG.Central Nervous
Sys-tem Injury Surveillance Data Submission Standards: 2002. Atlanta, GA: Centers for Disease Control and Prevention, National Center for Injury Prevention and Control; 2004
Control.Report to Congress on Mild Trau-matic Brain Injury in the US: Steps to Pre-vent a Serious Public Health Problem. At-lanta, GA: Centers for Disease Control and Prevention; 2003
30. Carroll LJ, Cassidy JD, Holm L, Kraus J, Coro-nado VG. Methodological issues and re-search recommendations for mild trau-matic brain injury: the WHO Collaborating Centre Task Force on Mild Traumatic Brain
Injury.J Rehabil Med. 2004;(43 suppl):
113–125
31. Gennarelli TA, Wodzin E.Abbreviated Injury
Scale 2005. Des Plaines, IL: Association for the Advancement of Automotive Medicine; 2008
32. Langlois JA.Traumatic Brain Injury in the
US: Assessing Outcomes in Children. At-lanta, GA: Centers for Disease Control and Prevention, National Center for Injury Pre-vention and Control; 2000
33. Thompson RS, Rivara FP, Thompson DC. A case-control study of the effectiveness of
bicycle safety helmets.N Engl J Med. 1989;
320(21):1361–1367
34. Thompson DC, Rivara FP, Thompson RS. Ef-fectiveness of bicycle safety helmets in pre-venting head injuries: a case-control study.
JAMA. 1996;276(24):1968 –1973
35. Mueller BA, Cummings P, Rivara FP, Brooks MA, Terasaki RD. Injuries of the head, face
and neck in relation to helmet use.
Epidemi-ology. 2008;19(2):270 –276
36. Varni JW, Limbers CA. The pediatric quality of life inventory: measuring pediatric health-related quality of life from the
per-spective of children and their parents.
Pedi-atr Clin North Am. 2009;56(4):843– 863
37. Varni JW, Seid M, Kurtin PS. PedsQL 4.0: re-liability and validity of the Pediatric Quality of Life Inventory version 4.0 generic core scales in healthy and patient populations.
Med Care. 2001;39(8):800 – 812
38. McCarthy ML. Measuring children’s
health-related quality of life after trauma. J
Trauma. 2007;63(6 suppl):S122–S129; dis-cussion S130 –S135
39. McCarthy ML, MacKenzie EJ, Durbin DR, et al. Health-related quality of life during the
first year post traumatic brain injury.Arch
Pediatr Adolesc Med. 2006;160(3):252–260
40. McCarthy ML, MacKenzie EJ, Durbin DR, et al. The Pediatric Quality of Life Inventory: an evaluation of its reliability and validity for
children with traumatic brain injury.Arch
Phys Med Rehabil. 2005;86(10):1901–1909
41. Varni JW, Burwinkle TM, Katz ER, Meeske K, Dickinson P. The PedsQL in pediatric cancer: reliability and validity of the Pediatric Qual-ity of Life Inventory Generic Core Scales, Multidimensional Fatigue Scale, and Cancer
Module.Cancer. 2002;94(7):2090 –2106
42. Harrison PL, Oakland T.Adaptive Behavior
Assessment System Manual. San Antonio, TX: Harcourt Assessment; 2003
43. Bedell G. Research update: the Child and
Ad-olescent Scale of Participation.Brain Inj
Prof. 2006;3(4):14
44. Rivara JB, Jaffe KM, Fay GC, et al. Family functioning and injury severity as
predic-tors of child functioning one year following
traumatic brain injury.Arch Phys Med
Re-habil. 1993;74(10):1047–1055
45. Miller IW, Epstein NB, Bishop DS. The McMas-ter family assessment device: reliability and
validity. J Marital Fam Ther. 1985;11:
345–356
46. Varni JW, Limbers CA, Burwinkle TM. Parent
proxy-report of their children’s health-related quality of life: an analysis of 13,878 parents’ reliability and validity across age subgroups using the PedsQL 4.0 Generic
Core Scales. Health Qual Life Outcomes.
2007;5:2
47. Meeske K, Katz ER, Palmer SN, Burwinkle T, Varni JW. Parent proxy-reported health-related quality of life and fatigue in
pediat-ric patients diagnosed with brain tumors
and acute lymphoblastic leukemia.Cancer.
2004;101(9):2116 –2125
48. Bedell GM. Developing a follow-up survey fo-cused on participation of children and youth with acquired brain injuries after
dis-charge from inpatient rehabilitation.
Neu-roRehabilitation. 2004;19(3):191–205
49. Anderson V, Brown S, Newitt H. What con-tributes to quality of life in adult survivors
of childhood traumatic brain injury?J
Neu-rotrauma. 2010;27(5):863– 870
50. Bordignon KC, Arruda WO. CT scan findings in mild head trauma: a series of 2,000
pa-tients. Arq Neuropsiquiatr. 2002;60(2-A):
204 –210
51. Iverson GL. Complicated vs uncomplicated mild traumatic brain injury: acute
neuro-psychological outcome.Brain Injury. 2006;
20(13–14):1335–1344
52. Kashluba S, Hanks RA, Casey JE, Millis SR. Neuropsychologic and functional outcome
after complicated mild traumatic brain
in-jury.Arch Phys Med Rehabil. 2008;89(5):
904 –911
53. Sadowski-Cron C, Schneider J, Senn P,
Ra-danov BP, Ballinari P, Zimmermann H. Pa-tients with mild traumatic brain injury:
im-mediate and long-term outcome compared
to intracranial injuries on CT scan.Brain Inj.
2006;20(11):1131–1137
54. Levin HS, Hanten G, Roberson G, et al. Pre-diction of cognitive sequelae based on
ab-normal computed tomography findings in children following mild traumatic brain
in-jury. J Neurosurg Pediatr. 2008;1(6):
461– 470
55. Hessen E, Nestvold K, Anderson V. Neuropsy-chological function 23 years after mild
trau-matic brain injury: a comparison of out-come after pediatric and adult head
injuries.Brain Inj. 2007;21(9):963–979
56. Fay TB, Yeates KO, Taylor HG, et al. Cognitive
reserve as a moderator of postconcussive symptoms in children with complicated and
uncomplicated mild traumatic brain injury.
J Int Neuropsychol Soc. 2010;16(1):94 –105
57. Lange RT, Iverson GL, Franzen MD. Neuropsy-chological functioning following
compli-cated vs uncomplicompli-cated mild traumatic
DOI: 10.1542/peds.2011-0840 originally published online October 24, 2011;
2011;128;e1129
Pediatrics
Monica S. Vavilala, Dennis Durbin and Kenneth M. Jaffe
Frederick P. Rivara, Thomas D. Koepsell, Jin Wang, Nancy Temkin, Andrea Dorsch,
Services
Updated Information &
http://pediatrics.aappublications.org/content/128/5/e1129 including high resolution figures, can be found at:
References
http://pediatrics.aappublications.org/content/128/5/e1129#BIBL This article cites 47 articles, 2 of which you can access for free at:
Subspecialty Collections
http://www.aappublications.org/cgi/collection/neurology_sub
Neurology
http://www.aappublications.org/cgi/collection/disabilities_sub
Children With Special Health Care Needs
following collection(s):
This article, along with others on similar topics, appears in the
Permissions & Licensing
http://www.aappublications.org/site/misc/Permissions.xhtml in its entirety can be found online at:
Information about reproducing this article in parts (figures, tables) or
Reprints
DOI: 10.1542/peds.2011-0840 originally published online October 24, 2011;
2011;128;e1129
Pediatrics
Monica S. Vavilala, Dennis Durbin and Kenneth M. Jaffe
Frederick P. Rivara, Thomas D. Koepsell, Jin Wang, Nancy Temkin, Andrea Dorsch,
and Adolescents
Disability 3, 12, and 24 Months After Traumatic Brain Injury Among Children
http://pediatrics.aappublications.org/content/128/5/e1129
located on the World Wide Web at:
The online version of this article, along with updated information and services, is
by the American Academy of Pediatrics. All rights reserved. Print ISSN: 1073-0397.