Int. J. Nanosci. Nanotechnol., Vol. 13, No. 1, March. 2017, pp. 91-95
Short Communication
Influence of Size on the Melting Temperature
of Metallic Nanoparticle
Mehrdad Salehian1, Arash Mohammadian2, Majid Vaezzadeh3 and
Mohammadreza Saeidi4
1Faculty of Physics and Energy Engineering, Amirkabir University of Technology, Tehran,
Islamic Republic of Iran
2Department of Physics, Tehran Central Branch, Islamic Azad University, Tehran, Islamic
Republic of Iran
3Department of Solid State Physics, Faculty of Physics, K. N. Toosi University of
Technology, Tehran, Islamic Republic of Iran
4Department of Physics, Faculty of Basic Sciences, Shahed University, Tehran, Islamic
Republic of Iran
(*) Corresponding author: m.saeidi@shahed.ac.ir, Saeidi.mr@gmail.com.
(Received: 01 September 2015 and Accepted: 08 August 2016)
Abstract
In This paper, the effect of size on melting temperature of metallic nanoparticles (Au, Pb and Bi) is theoretically simulated and explained. In this regard, the cause of difference in various experimental data is introduced, which is the difference between nanoparticles’ grain Gaussian distribution. This volume-depended model with the help of the Gaussian distribution can describe the relation between nanoparticle melting temperature and its size. The obtained results are interestingly consistent with reported experimental data.
Keywords:Melting Temperature, Nanoparticles, Distribution Function.
1. INRODUCTION
A Melting point is one of the important thermodynamic properties of all materials. Nanoparticles with different sizes have different melting temperature which refers to the phenomenon of reduction in melting point of particles in small dimension. This phenomenon is interesting in nanoscale particles; for example, the decrease in melting temperature of metals with nanometer dimensions can be on the order of tens to hundreds of Kelvin degrees. The dependence of nanoparticles melting point on their size was first theoretically predicted by pawlow in 1909 [1], and then was demonstrated by Takagi in 1954 [2]. There are several models that can describe the variation of melting temperature [3-8].
model must be introduced to show the effect of volume on melting temperature.
2. MODEL
According to the numerical calculation of phonon spectrum for metallic nanoparticles [10], the surface layer atoms can be excited by lower frequencies. Hence, these atoms
need lower temperature
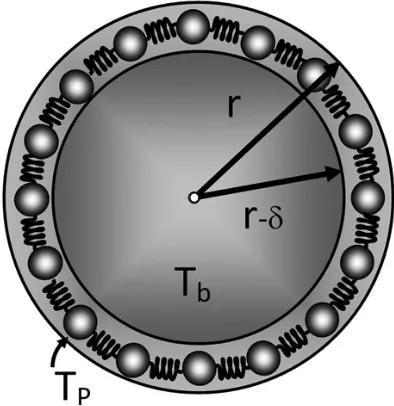
Tpfor melting process. Since our model is based on spherical model and, for small spherical nanoparticles the melting process begins from the surface layer with δ thickness and ends to the central core of nanoparticles, we consider two spheres with r and r-δ radii (Fig. 1).
Figure 1. A nanoparticle with the solid core and a liquid shell.
Hence, the gradient of temperature, ∆T, is directed to the center of the inner core and is proportional to the change of the volume of nanoparticle (∆V) as follows:
b inner
ΔT ΔV =α
T V (1)
Where ΔV
VouterVinner
Vshell is thechange in volume,ΔTTbTpis the change
(Figure 1). The coefficient α in Eq. 1 is a proportional coefficient which depends on the type of nanoparticle. It can be related to the atomic mass, electronic structure and inter atomic distance. So, it is changed by change of type of nanoparticle. But in this paper, dependence of α on effective parameters is not investigated and it is used only as the fitting parameter. The paper focuses on behavior of nanoparticle melting temperature variations by size. By replacing the ΔT and ΔV in Eq. 1, the next expression is obtained:
p outer b inner
T V
1- =α -1
T V
(2)
Also, according to the Figure 1, we have:
3 outer
3 inner
4
V = πr
3 4
V = π(r-δ)
3 (3)
So, one can found the next equation:
3 p b T 1 =1+α 1-δ T 1-r (4)
Where δ is the thickness of the shell or the outer layer of the nanoparticle which is equal to atomic radius of atoms in nanoparticle. Therefore the melting temperature of a nanoparticle is a function of its curvature radius, and larger nanoparticles melt at greater temperatures. This equation can be verified for high limit: If r grows dramatically and tends to infinity
r
, bulk and particle (shell) meltingtemperature will be approximately the same which express that for large particles or bulk materials TP is approximately the same
2.1. Distribution Function of Transition Temperature
In real nanomaterials, the nanoparticles are usually distributed with different sizes. The form and parameters of the distribution function depend on the technology of the sample production. We suppose that the distribution function of radius, r, has Gaussian form [11], namely
, 0 r
2σ r r βT Aexp T)
f(r,
2 0
(6)
where A,β,r0 and σ are respectively
normalization constant, the separation coefficient, the most probable radius of nanoparticles and standard deviation, respectively.
3. RESULTS AND DISCUSSIONS
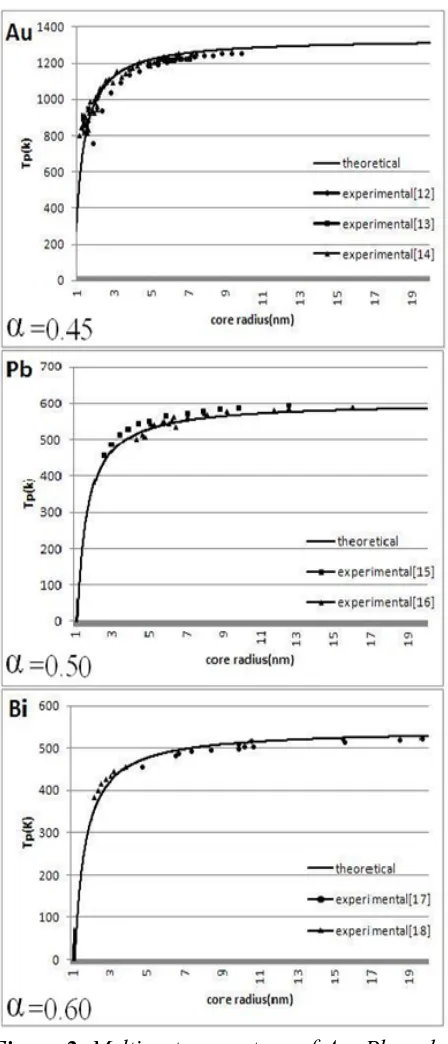
The experimental data [12-18] and the results of our theoretical model for spherical metallic nanoparticles are plotted in the Figure 2 by using the Eqs. 4, 6 for gold (Au), lead (Pb) and bismuth (Bi). Figure 2 clearly shows a decrease in melting temperature with decrease of size. The obtained results from the theory are supported by reported experimental data.
The results are discussed and interpreted as follows: when the size of the nanoparticle is reduced, the ratio of number atoms in surface to number of atoms in volume is decreased. Therefore, the binding energy of surface atoms is reduced which causes the surface atoms are detached from nanoparticle by receiving of less energy.
Consequently, the melting temperature of the nanoparticle is reduced by decreasing of its size. But, after a certain value, when the nanoparticle size is increased, the ratio of number atoms in surface to number of atoms in volume tends to zero. So, the melting temperature goes up and is saturated.
Figure 2. Melting temperature of Au, Pb and Bi nanoparticles as a function of radius. Solid curves are theoretical model results. Symbols are experimental data [12-18].
Table 1. The obtained coefficient α for different metallic nanoparticles.
Element Melting
point
T
bulk[K]
Atomic
radius
r [nm]
coefficient
α
Au
1337.33 0.144
0.45
pb
600.61
0.175
0.50
Bi
544.52
0.154
0.60
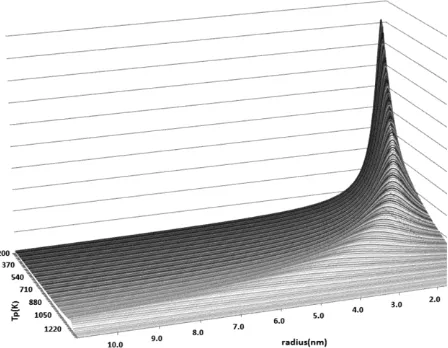
The 3D curve off(r,T)is drawn for gold nanoparticles in Figure 3. This figure shows that the melting temperature of the nanoparticles has the most distribution in the most available radii.
Figure 3. Distribution function of melting temperature for Au nanoparticles 0.0001.
The dispersion of various experimental data in Figure 2 may be caused by the following factors:
1- In real products, the Gaussian distribution of nanoparticles is not symmetric.
2- The melting method.
3- The real shape of nanoparticles.
4-When the size decreases, the density of phonon modes gets irregular.
3- CONCLUSION
In this paper, it was shown that the melting temperature of metallic nanoparticles depends on volume changes. So a theoretical model was presented to describe the melting temperature of nanoparticles. In addition, we applied our theory to some metallic nanoparticle such as Au, Pb and Bi. Obtained values for coefficient α in the theory show that it can depend on heat capacity and atomic number of atoms in nanoparticle. The obtained results from the theory were in good agreement with experimental data.
REFERENCES
1. Pawlow, P., (1909). “Über die Abhängigkeit des Schmelzpunktes von der Oberflächenenergie eines festen Körpers”, Z. Phys. Chem., 65: 1–35.
2. Takagi, M., (1954). “Electron-Diffraction Study of Liquid-Solid Transition of Thin Metal Films”, J. Phys. Soc. Jpn., 9: 359-363.
3. Storozhev, V. B., (1998). “The solid-liquid phase transition in nanoparticles contacting with a solid surface”,
Surf. Sci., 397: 170-178.
4. Jiang, Q., Zhang, Z., Wang, Y. W., (2000). “Thermal stability of low dimensional crystals”, Mater. Sci. Eng. A, 286: 139-143.
5. Qi, W. H., Wang, M. P., (2004). “Size and shape dependent melting temperature of metallic nanoparticles”,
Mater. Chem. Phys., 88: 280-284.
6. Safaei, A., Attarian Shandiz, M., Sanjabi, S., Barber, Z.H., (2007). “Modelling the size effect on the melting temperature of nanoparticles, nanowires and nanofilms”, J. Phys: Condens. Mat., 19: 216216.
7. Mirjalili, M., Vahdati-Khaki, J., (2008). “Prediction of nanoparticles’ size-dependent melting temperature using mean coordination number concept”, J. Phys. Chem. Solids, 69: 2116-2123.
8. Nanda, K. K., (2009). “Size-dependent melting of nanoparticles: Hundred years of thermodynamic model”,
11. Hudson, D. J. (1967). “Statistics for Physicists”, Mir publishers, Moscow.
12. Schmid, G. (2001). “Metals”, in: K.J. Klabunde (Ed.), “Nanoscale Materials in Chemistry”, John Wiley & Sons Inc., New York.
13. Sambles, J. R., (1971). “An Electron Microscope Study of Evaporating Gold Particles: The Kelvin Equation for Liquid Gold and the Lowering of the Melting Point of Solid Gold Particles”, P. Roy. Soc. Lon. Ser-A, 324: 339-351.
14. Buffat, P., Borel, J. P., (1976). “Size effect on the melting temperature of gold particles”, Phys. Rev. A, 13: 2287-2298.
15. Skripov, V. P., Koverda, V. P., Skokov, V. N., (1981). “Size effect on melting of small particles”, Phys. Status Solidi A, 66: 109-118.
16. Coombes, C. J., (1972). “The melting of small particles of lead and indium”, J. Phys. F: Met. Phys., 2: 441– 448.
17. Allen, G. L., Bayles, R. A., Gile, W. W., Jesser, W. A., (1986). “Small particle melting of pure metals”, Thin Solid Films, 144: 297-308.
18. Kellermann, G., Craievich, A. F., (2002). “Structure and melting of Bi nanocrystals embedded in a B2O3−Na2O