http://www.ijcmph.com pISSN 2394-6032 | eISSN 2394-6040
Original Research Article
Determinants of vision function related quality of life of patients
undergoing unilateral cataract surgical services in charitable hospitals
in India: a multicentre prospective cohort study
Elizabeth Kurian, Pankaj Vishwakarma, Jaikumar Deenadayalan, Amit Mondal,
Dhanaji Ranpise, Shobhana Chavan, Prem Kumar S. G.*
INTRODUCTION
Based on the World Health Organization‟s (WHO) definition of health, quality of life is an integral part of health and well-being and the WHO recommended that vision related quality of life (VRQoL) form part of assessments and evaluations of interventions in eye health.1,2 Cataract surgery has a multiplier effect as it not
only improves the Quality of Life (QoL) but also prolonging life as people who can see better post-surgery are more likely to get exercise, take their medications and avoid falls.3 The age-standardised global prevalence of blindness was reported at 0.48% in 2015 as against 0.75% in 1990.4 Though this decline is encouraging, cataract continues to remain the main cause of blindness with the vast majority of cataract blind living in low and ABSTRACT
Background: Cataract is the leading cause of avoidable blindness in developing world, including India. The objective
of this study is to measure the changes in quality of life (VRQoL) after cataract surgery and identify the predictors of an improvement in these outcomes.
Methods: A multi-center prospective, longitudinal cohort study was conducted. At baseline patients aged ≥18 years
with first-eye cataract were interviewed about VRQoL. Six months‟ later participants were re-interviewed at their residences. Multiple classification analysis (MCA) was performed to assess the variation in the intensities of mean change scores for general function, psychosocial impact and visual function with select factors.
Results: The six-month follow-up rate was 87.3%. There was a significant improvement in visual acuity and VRQoL
post-surgery. The mean general function, psychosocial impact and visual function scores were 34.6 (SD 10.9), 10.5 (SD 3.7) and 8.4 (SD 2.2) in the baseline and 15 (SD 5.5), 5 (SD 2.2) and 4.4 (SD 1.6) in the follow-up assessments, respectively. In MCA, patients prescribed spectacles post-surgery (β 0.137) and those from rural backgrounds (β 0.137) had the most impact on general function. Patients with complete follow-up visits had a relatively higher effect on the psychosocial impact (β 0.084) whereas patients from rural background and men had the most impact on the visual function scores (β 0.102 and 0.076) respectively.
Conclusions: Cataract surgery is associated with meaningful improvements in VRQoL in general. The determinants
of better VFQoL include regular and complete patient follow-up visits and prescription and provision of spectacles post-surgery.
Keywords: Cataract, India, Quality of life, Visual acuity, Avoidable blindness, Spectacles
Mission for Vision, Mumbai, Maharashtra, India
Received: 09 January 2018
Accepted: 03 February 2018
*Correspondence: Dr. Prem Kumar SG,
E-mail: [email protected]
Copyright: © the author(s), publisher and licensee Medip Academy. This is an open-access article distributed under
the terms of the Creative Commons Attribution Non-Commercial License, which permits unrestricted non-commercial use, distribution, and reproduction in any medium, provided the original work is properly cited.
middle income countries (LMIC)and approximately nine million of those blind from cataract live in India.4-7 Furthermore, evidence suggests that visual impairment (VI) leads to reduced QoL,poorer general health, lower social status and increased mortality.8-12 Cataract surgery is a highly cost-effective intervention and cataract surgical rates have increased considerably over the past decade in many LMICs, including India.13,14 The aim of cataract surgery is to improve the vision and thereby the positively impact the quality of lives of people affected. However, the quality of providing cataract surgery is not always optimal, with a considerable proportion of patients still blind or visually impaired after cataract surgery in a LMIC setting. 15,16
As the Indian population ages, morbidity associated with cataract surgery is expected to rise. In planning medical services for cataract patients, it is essential to include the assessment of post-surgical outcomes not only in terms of visual acuity, but also for patient reported visual functioning and vision related quality of life. There were many studies that attempted to measure variations in the quality of life of patients pre and post-cataract surgery in the past, however, their sample size was limited.17-22 Of these, majority of studies have used the Visual Function Index (VF-14) to measure VRQoL among cataract patients and the majority were conducted in developed countries.17 This instrument has been criticised for not addressing all the visual concerns of cataract patients, 18 being highly focused on activities that require visual acuity and having ceiling effects.18-20 The subsequent National Eye Institute Visual Function Questionnaire (NEI VFQ-25) and the Indian Vision Function Questionnaire (IND-VFQ33) have addresses a wider range of visual concerns, including social and mental outcomes of visual impairment and allows investigation into which specific aspects of VRQoL improve after cataract surgery.21,22 Against this background, we assessed the impact of successful first eye cataract surgery on the vision and overall vision related QoL (VRQoL) in India.
METHODS
Study setting and sample
Data for this longitudinal study were collected from April 2016 to March 2017 at eighteen private not-for-profit hospitals spread across thirteen Indian states. Study population comprised of adults aged 18 years and above, presenting to the ophthalmology department at these hospitals. They were either walk-in patients or referrals from outreach eye screening camps.
Sample size calculations were powered to detect a 20% improvement in VRQoL six months after cataract surgery based on previous study findings.8,9,22 To detect this improvement required about 200 operated cases in each hospital examined at baseline and follow-up with an alpha of 0.05 and 80% power. A random-proportional
sampling technique was adopted to sample all eligible participants. The sample was proportionately distributed amongst the 18 hospitals based on the annual number of cataract surgeries done during the preceding financial year. Adults who could understand at least one of the following eleven languages– Assamese, Bengali, Gujarati, Hindi, Kannada, Jayantia, Marathi, Oriya, Punjabi, Tamil, Telugu or English were considered eligible for participation.
Data collection: baseline and follow-up
The data collection happened in two phases; Baseline survey (pre-operative) – initially a day or two prior to initiation of cataract surgery; and Follow-up survey (post-operative) – which took place at the residence of the participants six months after the initial first eye cataract surgery. Standard research protocols were followed during data collection in both the baseline and follow-up surveys in accordance with the Helsinki Declaration. During the baseline assessment, each potential participant was contacted by an interviewer trained in the study procedures with the assistance of the hospital staff. Patients admitted to the ophthalmology inpatient ward for cataract surgery were approached. Before starting the interview, each participant was explained the nature and purpose of the interview and their verbal consent for participation sought. Subsequently, participants were interviewed in an isolated area outside the in-patient ward of the hospital. Average interview time was 45 minutes. Follow-up surveys were undertaken approximately six months from the initial interview. All traced participants were re-examined (using same VA assessment procedures as at baseline) and re-interviewed. Interviews were conducted in respondents‟ own homes by trained interviewers who were regularly observed by supervisors. The interviewers at baseline and follow up were the same. Interviews were recorded electronically using
Patient Related Impact Studying Mechanism (PRISM), a mobile data recording application (CommCare-Dimagi, Inc. Cambridge, MA, USA).23
Measures
Snellen tumbling E chart. All measurements were taken in full daylight with available correction. To assess quality of life of adult due to visual impairment, we used the WHO/ prevention of blindness and deafness 20-item visual functioning questionnaire (WHO/PBD VF20) which was in turn adapted from the Indian IND-VFQ33 and proposed by the WHO as a tool for assessing VRQoL in low-income settings.25,26 The scale includes 20 items on overall eyesight, visual symptoms, visual functioning and psychosocial well-being, each with a 5-point response option. The WHO/PBD VF20, was translated into the local languages for use by the researchers, and then was back-translated and field-tested to ensure proper readability. The composite score was the sum of all the items and higher scores indicated increased difficulty of visual functionality. If option on visual task was not applicable, it was also mentioned. Two rounds of pre-testing of the study instrument were undertaken prior to the start of actual data collection. Based on these exercises, certain definitions were simplified, revisions in local language translation made, and interview techniques improved.
Statistical analysis
Microsoft office Excel 2013 and SPSS statistical software (Version 20.0, SPSS Science, Chicago, IL) were used to analyze the data. Participants who were not traced or contacted in the follow-up were excluded from all analyses. Descriptive statistical analyses were performed to characterize the participants‟ socio-demographic, clinical and WHO/PBD VF20 data using Chi-square tests or one-way analysis of variance tests as appropriate. Descriptive statistics for general function, psychosocial impact and visual function sub-scale scores are reported for relevant variables, and independent sample T test and
ANOVA test were used to assess significance as appropriate. Change scores were computed as a difference between baseline and follow-up scores for the WHO/PBD VF20 and all of its three sub scales. Effect sizes for longitudinal change in VRQoL was calculated as the mean change in scores divided by the standard deviation of the baseline score. Effect sizes of 0.2–0.49 were considered “small,” 0.5–0.79 medium and ≥0.8 large.27 Multiple classification analysis (MCA) was performed to assess the variation in the intensities of mean change scores for general function, psychosocial impact and visual function with select factors. Mean change scores for the three sub-scales were considered as dependent variables in the MCA.
RESULTS
A total of 3,452 adult participants consented to the study and completed baseline assessments.
Response rates at follow-up were generally high; with a total of 3,015 (87.3%) completing the follow-up assessment. Results are presented for participants who completed both baseline and follow-up assessments.
Socio-demographic characteristics
Table 1 describes the socio-demographic characteristics of the study population. Of the 3,015 participants, half were female (50.6%) and aged between 41 and 60 years (49.9%). The median ages were 63 and 60 for men and women respectively. About three-quarters were currently married (78.2%). Most participants had no formal education (57.6%), and just a little over one-thirds were currently working (38.9%). A greater majority were rural residents (81.1%).
Table 1: Demographic and clinical characteristics of participants who completed baseline and follow-up assessments.
Variable Categories Total (%);
N=3,015
Male (%); N=1,489
Female (%); N=1,526
Age
< 40 years 70 (2.3) 24 (1.6) 46 (3)
41 to 60 years 1,505 (49.9) 614 (41.2) 891 (58.4) 61 to 80 years 1,413 (46.9) 830 (55.7) 583 (38.2)
> 80 years 27 (0.9) 21 (1.4) 6 (0.4)
Marital status*
Never married 50 (1.7) 23 (1.5) 27 (1.8)
Currently married 2,350 (78.2) 1,339 (90) 1,011 (66.6) Previously married 606 (20.2) 126 (8.5) 480 (31.6)
Education
Illiterate 1,737 (57.6) 587 (39.4) 1,150 (75.4) Primary schooling 683 (22.7) 459 (30.8) 224 (14.7) Secondary schooling 565 (18.7) 415 (27.9) 150 (9.8)
College or more 30 (1) 28 (1.9) 2 (0.1)
Place of residence Urban 570 (18.9) 266 (17.9) 304 (19.9)
Rural 2,445 (81.1) 1,223 (82.1) 1,222 (80.1)
Job other than working on own field
Yes 1,173 (38.9) 650 (43.7) 523 (34.3)
Variable Categories Total (%); N=3,015
Male (%); N=1,489
Female (%); N=1,526
Own social security cards
BPL card 2,557 (84.8) 1239 (83.2) 1,318 (86.4)
GHI card 184 (6.1) 122 (8.2) 62 (4.1)
Both 22 (0.7) 13 (0.9) 9 (0.6)
None 252 (8.4) 115 (7.7) 137 (9)
Surgery done on the eye Right eye 1,640 (54.4) 794 (53.3) 846 (55.4)
Left eye 1,375 (45.6) 695 (46.7) 680 (44.6)
Baseline visual acuity in operated eye
Good 53 (1.8) 26 (1.7) 27 (1.8)
Borderline 964 (32) 483 (32.4) 481 (31.5)
Poor 1,998 (66.3) 980 (65.8) 1,018 (66.7)
Follow-up visual acuity in operated eye
Good 2,688 (89.2) 1,325 (89) 1,363 (89.3)
Borderline 223 (7.4) 103 (6.9) 120 (7.9)
Poor 104 (3.4) 61 (4.1) 43 (2.8)
Complete post-operative review attended
Yes 615 (20.4) 283 (19) 332 (21.8)
No 2,400 (79.6) 1,206 (81) 1,194 (78.2)
Spectacles prescribed post-surgery
Yes 723 (24) 363 (24.4) 360 (23.6)
No 2,292 (76) 1,126 (75.6) 1,166 (76.4)
Ocular complaints post-surgery
Yes 562 (18.6) 248 (16.7) 314 (20.6)
No 2,453 (81.4) 1,241 (83.3) 1,212 (79.4)
BPL – Below poverty line; GHI - Government health insurance; * Data missing for 9 cases.
Clinical characteristics and visual acuity
All participants had cataracts and a little over half reported surgery in the right eye (54.4%). The grades of visual acuity of the operated eye at six months and before surgery were compared for unilateral eye cataract surgeries (Table 1). Considerable improvement was noted in the vision six months after cataract surgery among adults operated for cataract. Prior to the cataract surgery, majority (66.3%) had a poor VA reading, followed by those with a borderline VA (32%). However, following the surgery, an overwhelming number of them had good VA (89.2%). About 20% patients had completed full post-operative review and 24% were provided with spectacles post-surgery.
VRQoL – WHO/PBD VF20
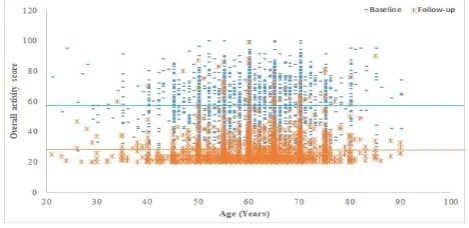
The overall mean VRQoL score was 56.6 (Standard Deviation, SD 15.5) and 26.4 (SD 8.8) in the baseline and follow-up respectively. The mean general function, psychosocial impact and visual function scores were 34.6 (SD 10.9), 10.5 (SD 3.7) and 8.4 (SD 2.2) in the baseline and 15 (SD 5.5), 5 (SD 2.2) and 4.4 (SD 1.6) in the follow-up assessments, respectively. Figure 1 shows the distribution of overall mean scores for VRQoL using WHO/PBD VF20 for the baseline and follow-up assessments. The distribution of overall VRQoL score was clustered above the mean level in the baseline as against lower than the mean level during the follow-up assessment, signifying a significant improvement in the quality of life of patients‟ post-surgery (p<0.001; Figure 1).
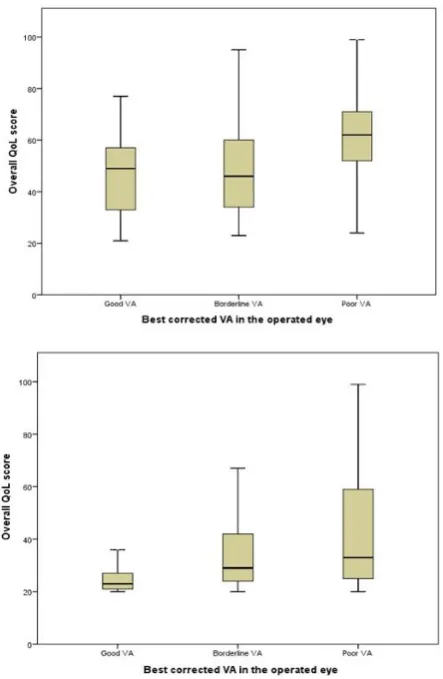
The distribution of the overall VRQoL score by grades of VA are presented in Figure 2.
Figure 1: Distribution of overall activity score by age before and after cataract surgery amongst adult
patients in India.
A statistically significant association was seen in overall VRQoL scores and improvements in VA before and after cataract surgery as the median QoL scores exhibit a sharp decline in the follow-up scenario (p<0.001; Figure 2).
Table 2: Distr ibution of pre an d p os t-oper at ive ov er all f unct ional ac tivit y sc ores by sel ect varia ble s a m ong adul t patients in I n dia. Va ri ab le Cate go ri es Mean ch ange in score General funct ion Psychos ocial i mpa ct Visua l functi on Mean SD Media n P value * Mean SD Media n P value * Mean SD Media n P value * Age < 40 yea rs 17.8 12.5 18 0.261 5.9 4.7 6 0.251 3.7 2.7 3 0.563
41 to 6
0 ye ars 19.6 12.1 20 5.5 4.1 5 4 2.6 4
61 to 8
0 ye ars 19.6 12.5 21 5.3 3.9 5 4 2.6 4
> 80 years
23.4 14.1 27 6.2 3.5 6 4.6 2.7 4 Sex Ma le 18.5 12.2 19 <0.001 5.3 4 5 0.171 3.8 2.7 4 <0.001 Fem ale 20.6 12.3 22 5.5 4 5 4.2 2.6 4 Ma ri ta l s tat u s Nev er m arr ie d 22.8 13.9 28 0.115 5.9 4.4 6 0.645 4.5 3.3 5 0.403 Currentl y m arr ie d 19.6 12.1 21 5.4 4 5 4 2.6 4 Pr eviously m arr ie d 19.1 12.9 21 5.4 4 6 4.1 2.8 4 Educa tion Illi te rate 19.8 12.4 21 0.002 5.5 3.9 5 0.208 4 2.6 4 0.1 Pr im ary sch oo li ng 19.7 12.2 21 5.4 4.2 5 4.1 2.8 4 Seco nd ary sch oo li ng 19.2 11.6 20 5.3 3.9 5 4 2.6 4 Coll ege or m ore 11.3 15.8 11.5 4.1 5.8 5 2.4 3.8 2.5 Place of resi dence Urba n 23.1 11.9 27 <0.001 5.0 3.9 5 0.002 4.7 2.5 5 <0.001 Rural 18.7 12.2 19 5.5 4 5 3.9 2.7 4 Job ot he r than w orking o n ow n fiel d Yes 19.8 12.8 21 0.228 5.2 3.7 5 0.007 4.1 2.8 4 0.284 No 19.2 11.5 20 5.6 4.2 5 4.0 2.5 4 Baseli ne VA Goo d 11.7 11.6 12 <0.001 3.6 3.7 4 <0.001 3.3 2.9 3 <0.001 Borderli ne 13 11.5 11 3.9 3.4 4 3.1 2.6 3 Poor 23 11.2 24 6.2 4 6 4.5 2.6 5 Co m plete post -op er at ive review att en d ed Yes 20 11.8 21 0.292 5 3.6 5 0.014 4.2 2.9 4 0.165 No 19.4 12.4 21 6 4.1 5 4 2.6 4 Spect acles prescri bed Yes 16.3 12.5 15 <0.001 4.7 3.8 4 <0.001 3.8 2.9 4 <0.001 No 20.6 12.1 22 5.6 4.1 6 4.1 2.6 4
Ocular compl
aint s po st -s urger y Yes 15.2 13.5 17 0.002 4.4 4.4 4 0.01 3.1 3 3 0.01 No 20.6 11.8 22 5.7 3.9 5 4.2 2.5 4 * AN OVA tes
t for s
Table 3: Contribution of WHO/PBD VF20 items towards the burden of quality of life among the adult patients operated for cataract in India.
Baseline (N=3,015) Follow-up (N=3,015)
Option 1
Option 2
Option 3
Option 4
Option 5
Option 1
Option 2
Option 3
Option 4
Option 5 Overall, how would you rate your
eyesight using both eyes – with glasses or contact lenses if you wear them?*
37 703 1,278 882 115 1,060 1,482 226 232 15
1.2% 23.3% 42.4% 29.3% 3.8% 35.2% 49.2% 7.5% 7.7% 0.5% General function
Because of your eyesight, how much difficulty do you have in going down steps or stairs?†
383 644 1,005 805 178 2,434 430 112 34 5
12.7% 21.4% 33.3% 26.7% 5.9% 80.7% 14.3% 3.7% 1.1% 0.2% How much difficulty do you have in
noticing obstacles while you are walking alone (e.g. animals or vehicles)?†
360 748 1,088 702 117 2,385 485 99 39 7
11.9% 24.8% 36.1% 23.3% 3.9% 79.1% 16.1% 3.3% 1.3% 0.2% Because of your eyesight, how much
difficulty do you have in searching for something on a crowed shelf?†
459 761 1,079 579 137 2,472 419 91 28 5
15.2% 25.2% 35.8% 19.2% 4.5% 82.0% 13.9% 3.0% 0.9% 0.2% How much difficulty do you have in
seeing differences in colours?†
780 650 727 636 222 2,466 422 98 20 9
25.9% 21.6% 24.1% 21.1% 7.4% 81.8% 14.0% 3.3% 0.7% 0.3% Because of your eyesight, how much
difficulty do you have in recognizing the face of a person standing near you?†
802 963 794 377 79 2,831 125 42 14 3
26.6% 31.9% 26.3% 12.5% 2.6% 93.9% 4.1% 1.4% 0.5% 0.1% How much difficulty do you have in
seeing the level in a container when pouring?†
731 634 857 614 179 2,597 321 68 23 6
24.2% 21.0% 28.4% 20.4% 5.9% 86.1% 10.6% 2.3% 0.8% 0.2% Because of your eyesight, how much
difficulty do you have in going to activities outside of the house (e.g. sporting events, shopping, religious events)?†
476 509 1,058 656 316 2,454 389 104 28 40
15.8% 16.9% 35.1% 21.8% 10.5% 81.4% 12.9% 3.4% 0.9% 1.3%
Because of your eyesight, how much difficulty do you have in recognizing people you know from a distance of 20 meters?†
48 112 807 1,064 984 1,969 695 273 48 30
1.6% 3.7% 26.8% 35.3% 32.6% 65.3% 23.1% 9.1% 1.6% 1.0% How much difficulty do you have in
seeing close objects (e.g. making out differences in coins or notes, reading newsprint)?†
528 819 926 557 185 2,489 400 90 24 12
17.5% 27.2% 30.7% 18.5% 6.1% 82.6% 13.3% 3.0% 0.8% 0.4% How much difficulty do you have in
seeing irregularities in the path when walking (e.g. potholes)?†
191 709 1,110 775 230 2,331 553 95 29 7
6.3% 23.5% 36.8% 25.7% 7.6% 77.3% 18.3% 3.2% 1.0% 0.2% How much difficulty do you have in
doing activities that require you to see well close up (e.g. sewing, using hand tools)?†
217 638 682 813 665 2,442 394 127 37 15
7.2% 21.2% 22.6% 27.0% 22.1% 81.0% 13.1% 4.2% 1.2% 0.5% Because of your eyesight, how much
difficulty do you have in carrying out your usual work?†
740 628 993 538 116 2,599 329 61 26 0
24.5% 20.8% 32.9% 17.8% 3.8% 86.2% 10.9% 2.0% 0.9% 0.0% Psychosocial impact
Because of your eyesight, how often have you been hesitant to participate in social functions?‡
762 604 930 509 210 2,452 403 111 37 12
25.3% 20.0% 30.8% 16.9% 7.0% 81.3% 13.4% 3.7% 1.2% 0.4% Because of your eyesight, how often
have you found that you are ashamed or embarrassed?‡
679 951 878 327 180 2,583 300 92 30 10
22.5% 31.5% 29.1% 10.8% 6.0% 85.7% 10.0% 3.1% 1.0% 0.3% Because of your eyesight, how often
have you felt that you are a burden on others?‡
913 901 723 337 141 2,567 327 96 19 6
30.3% 29.9% 24.0% 11.2% 4.7% 85.1% 10.8% 3.2% 0.6% 0.2% Because of your eyesight, how often do
you worry that you may lose your remaining eyesight?‡
351 594 901 757 412 2,323 374 206 84 28
Baseline (N=3,015) Follow-up (N=3,015)
Visual function
How much pain or discomfort do you have in your eyes (e.g. burning, itching, aching)?†
1,479 898 458 153 27 2,303 605 84 20 3
49.1% 29.8% 15.2% 5.1% 0.9% 76.4% 20.1% 2.8% 0.7% 0.1% How much difficulty do you have in
seeing because of glare from bright lights?†
57 587 1,153 911 307 1,683 929 307 88 8
1.9% 19.5% 38.2% 30.2% 10.2% 55.8% 30.8% 10.2% 2.9% 0.3% How much difficulty do you have in
seeing when coming inside after being in bright sunlight?†
58 542 1,107 815 493 1,747 990 227 39 12
1.9% 18.0% 36.7% 27.0% 16.4% 57.9% 32.8% 7.5% 1.3% 0.4% *Option 1: very good; option 2: good; option 3: moderate; option 4: bad; option 5: very bad; †Option 1: none; option 2: mild; option 3: moderate; option 4: severe; option 5: extreme; ‡ Option 1: never; option 2: rarely; option 3: sometimes; option 4: often; option 5: very often.
Table 4: Comparison of baseline and follow-up VRQoL scores and its effect sizes among adult patients in India.
WHO/PBD VF20 and its sub-scales
Baseline Follow-up Change from BL to
FU mean Effect size*
Mean SD Mean SD Mean SD
Overall activity score 56.6 15.5 26.4 8.8 30.2 17.8 1.9
General function score 34.6 10.9 15 5.5 19.6 12.3 1.8
Psychosocial impact score 10.5 3.7 5 2.2 5.4 4 1.5
Visual function score 8.4 2.2 4.4 1.6 4.0 2.7 1.8
SD – Standard deviation; BL – Baseline; FU – Follow-up; *Calculated as the mean change score from pre-surgery to post-surgery, divided by the standard deviation of the pre-surgery score.
Table 5: Multiple classification analysis for effect of socio-demographic and clinical characteristics on the level of net VFQoL scores in adult patients operated for cataract in India.
Variable Categories N=3,006
Adjusted predicted mean
Change score – general function
Change score – Psychosocial impact
Change score – Visual function
Mean Betaβ P value Mean Beta β P value Mean Beta β P value
Age
< 40 years 70 17
0.044 0.081 5.9
0.039 0.191 3.6
0.032 0.370
41 to 60 years 1,497 19.4 5.5 4
61 to 80 years 1,412 19.8 5.3 4.1
> 80 years 27 23 5.9 4.5
Sex Male 1,488 18.4 0.091 <0.001 5.4 0.012 0.562 3.8 0.076 <0.001
Female 1,518 20.7 5.5 4.2
Marital status*
Never married 50 20.7
0.036 0.113 5.9
0.016 0.673 4.1
0.010 0.852
Currently married 2,350 19.8 5.4 4
Previously married 606 18.7 5.5 4
Education
Illiterate 1,730 19.5
0.063 0.002 5.4
0.026 0.550 4
0.062 0.007
Primary schooling 681 20.1 5.5 4.1
Secondary schooling 565 19.6 5.4 4.1
College or more 30 12.3 4.4 2.5
Place of residence Urban 568 22.2 0.103 <0.001 4.7 0.040 <0.001 4.6 0.102 <0.001
Rural 2,438 18.9 5.6 3.9
Job other than working on own field
Yes 1,835 19.4
0.012 0.474 5.2
0.043 0.017 4
0.012 0.497
No 1,171 19.7 5.7 4
Baseline VA
Good 53 12.6
0.359 <0.001 3.7
0.280 <0.001 3.3
0.220 <0.001
Borderline 964 13.4 3.7 3.2
Poor 1,998 22.7 6.2 4.4
Complete post-operative review attended
Yes 2,811 21.4
0.078 <0.001 5
0.084 0.004 4.2
0.039 0.050
No 204 19.1 6 4
Spectacles prescribed post-surgery
Yes 722 16.5
0.137 <0.001 5
0.060 0.002 3.9
0.034 0.091
No 2,284 20.5 5.6 4.1
Full model 3,006 0.190 <0.001 0.096 <0.001 0.077 <0.001
Figure 2: Distribution of the overall QoL score by grades of visual activity among adults before (upper)
and after (lower) cataract surgery in India. QoL: Quality of Life; VA: Visual Acuity.
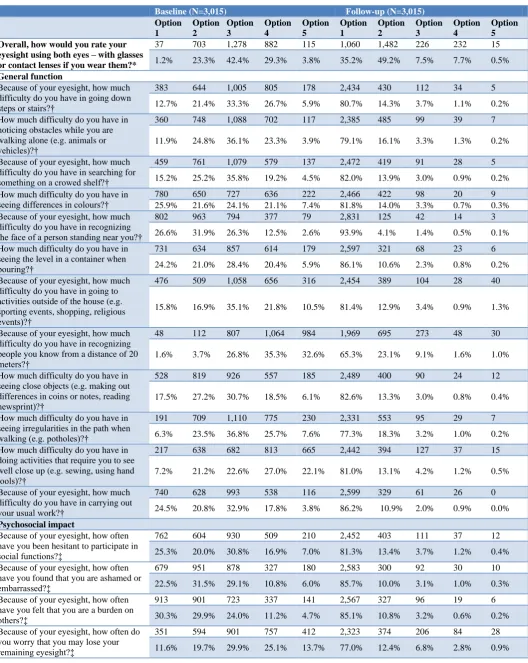
Table 3 shows distribution of items on the WHO/PBD VF20 scale for the study participants in the baseline and follow-up assessments. The overall eye sight as perceived by the participants was „moderate‟ (42.4%) as against „very good and good‟ (84.3%) during baseline and follow-up respectively. In the baseline scenario, the general function items that were reported by the majority were: difficulty in recognizing people you know from a distance of 20 meters (severe and extreme combined, 67.9%), difficulty seeing close objects (severe and extreme combined, 49%), difficulty seeing irregularities in the path when walking (severe and extreme combined, 33.3%) and difficulty going down steps or stairs (severe and extreme combined, 32.6%). However, the majority of the scores post-surgery for these items were (very good and good combined) 88.4%, 94.1%, 95.7% and 95% respectively, suggesting significant improvement. Similarly, the psychosocial impact scores in the baseline that were reported by majority was: how often do you worry that you may lose your remaining eyesight (often and very often combined, 38.8%) as against 77% who reported „never‟ six months‟ post-surgery. With regards to the visual function, the major item towards the score contribution in the baseline were: difficulty do you have
in seeing when coming inside after being in bright sunlight (severe and extreme combined, 43.3%) and difficulty do you have in seeing because of glare from bright lights (severe and extreme combined, 40.4%) as against 57.9% and 55.8% who reported „none‟ during the follow-up assessment (Table 3).
WHO/PBD VF20 scores showed improvements after surgery, indicating good overall VFQoL. The effect sizes are large (all exceed 1.00) across the three sub-scales suggestive of improved quality of life of patients‟ post-surgery (Table 4).
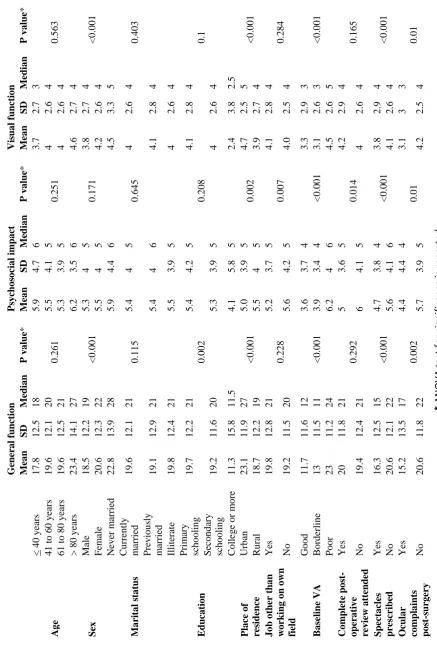
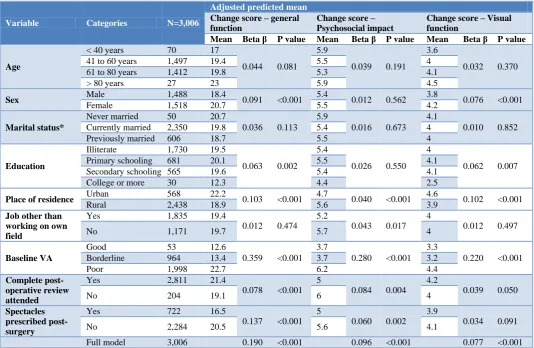
Table 5 shows the MCA for the adjusted predicted mean change scores for general function, psychosocial impact and visual function scores. As expected, a good baseline VA had the highest effect on the intensity of general function, psychosocial impact and visual function scores with a beta value of 0.359, 0.280 and 0.220 respectively. patients who were prescribed spectacles post-surgery (β 0.137) and those from rural backgrounds (β 0.137) had the most impact on general function. Regular and complete patient follow-up visits had a relatively higher effect on the psychosocial impact (β 0.084) whereas patients from rural background and men had the most impact on the visual function scores (β 0.102 and 0.076) respectively.
DISCUSSION
This multi-center study found that six months after cataract surgery there were large, significant improvements in visual outcomes, reduced difficulty undertaking everyday activities (general functioning), reduced frequency of negative psychosocial experiences associated with vision and reduced difficulty related to visual functions such as pain or discomfort in the eye or adaptations to varying light conditions. The improvements in VRQoL (measured through WHO/PBD VF20) observed in this study are consistent with a previous study in India and rest of the world which found similarly large effect sizes for VRQoL following cataract surgery.26,28-31
Program for Control of Blindness (NPCB) activity where they are transported to the base hospital for surgeries and a few given one-time free spectacles six weeks after cataract surgery. Though it is mandatory to prescribe and provide spectacles free of cost to post-surgery to poor patients,we found that just about a quarter of patients were prescribed and provided spectacles.33 The current practice with regard to spectacle provision at all of these private nor-for-profit hospitals include providing free spectacles only to those patients who have undergone bi-lateral cataract surgeries. In the light of the findings of this study, it is recommended that efforts should be made to prescribe and provide spectacles to all the patients requiring spectacles post-surgery even if they were unilateral first-eye cataract patients, as this would substantially enhance the overall quality of life.
The results also confirm that patients in the urban settings, those who had a complete sequence of regular follow-up visits to the hospital post-surgery and those who were prescribed spectacles had better psychosocial outcomes. Generally, patients are expected to have at least two visits to the hospital following cataract surgery – initially one to two weeks and later at thirty to forty days, to monitor the recovery and assess the visual outcomes post-surgery.33 Better medical advices and counseling during these follow-up visits might have had a direct psychological benefit on the patients. Importantly since these main hospitals were located in urban and semi-urban areas, those patients residing in the vicinity of these hospitals had better access to these hospitals than their rural counterparts. On the other hand, patients residing in the rural settings had the option to visit the nearest vision centers – a satellite primary eye care clinic established by the main hospital for the convenience of the patients living in far-off rural settings, to avail the post-operative care services. Despite these efforts to reach out to the patient to provide comprehensive eye care services, most of them did not visit the hospital to complete the full cycle of follow-up visits post-surgery. It is, therefore, recommended that appropriate steps and incentives should be taken in order to improve and encourage complete regular follow-up of patients to the hospital following surgery, especially those from the far-off rural areas as such follow-up visits could have beneficial psychological impacts as evident from these study findings.
The limitations of this study were that as most cataracts are bilateral, second eye surgery can be important in improving binocular vision and thereby greatly augmenting the VFQoL further. This study however, was confined to first-eye cataract surgery and its impact on VFQoL and the results must be interpreted keeping in mind this caveat. Secondly, this study employed the same field investigators to collect data during both the baseline and follow-up surveys. A tendency among patients to provide answers that would please the field investigator by overstating satisfaction with vision related quality of life therefore cannot be ruled out. There were also
strengths. The study reported findings from the largest sample size of patients availing services at multiple private not-for-profit hospitals pan India. This was a large multisite longitudinal study using validated tools and examining cases before and after cataract surgery. The high response rates in completion of questionnaires and the random selection of study subjects are also strengths of this study.
CONCLUSION
In conclusion, the findings from this study quantify the gains six-months following first-eye cataract surgery in three areas: general function, psychosocial impact and visual function. These results highlight that regular and complete patient follow-up visits and prescription and provision of spectacles post-surgery significantly improved vision related general functions and ensued better psychosocial outcomes amongst patient operated for cataract.
ACKNOWLEDGEMENTS
The authors wish to thank the participants of this study and the staff of the partner hospitals for facilitating recruiting of the participants. The views expressed in this paper are those of the authors and do not necessarily reflect the views of the organisations that facilitated this study, or the institutions employing the authors. The MFV QoL Study Team contributed to the planning of the study logistics, data collection and interpretation, and the members of this Team other than the named authors include (in alphabetical order): Alphones B, Gangadhara Rao B, Jahirkhan Pathan, Lalthlamuana Pautu, Malagapu Damodar, Mariappan S, Moksidul Rohaman, Pranjal Daimary, Sandeep Ahire, Sindhu S, Sivasankar Rao D, Sumit Awasthi, Tarram Taggu and Vibhuji Patel.
Funding: No funding sources Conflict of interest: None declared Ethical approval: Not required
REFERENCES
1. World Health Organization (WHO). The Constitution of the World Health Organization. Chron World Health Organ. 1947;1:29–43.
2. World Health Organization (WHO). Consultation on the Development of Standards for Characterization of Vision Loss and Visual Functioning. Geneva: WHO; 2003.
3. Tseng VL, Chlebowski RT, Yu F, Cauley JA, Li W, Thomas F, et al. Association of Cataract Surgery With Mortality in Older Women:Findings from the Women's Health Initiative. JAMA Ophthalmol, 2017.
systematic review and meta-analysis. The Lancet Global Health. 2017;5:e888-e897.
5. Pascolini D, Mariotti SP. Global estimates of visual impairment:2010. British J Ophthalmol 2012;96:614–8.
6. Murthy G, Gupta SK, John N, Vashist P. Current status of cataract blindness and Vision 2020:the right to sight initiative in India. Indian J Ophthalmol. 2008;56:489–94.
7. Finger RP. Cataracts in India: current situation, access, and barriers to services over time. Ophthalmic Epidemiol. 2007;14:112–8.
8. Polack S, Eusebio C, Fletcher A, Foster A, Kuper H. Visual impairment from cataract and health related quality of life:results from a case-control study in the Philippines. Ophthalmic Epidemiol. 2010;17:152–9.
9. Finger RP, Kupitz DG, Holz FG, Balasubramaniam B, Ramani RV, Lamoureux EL, et al. The impact of the severity of vision loss on vision-related quality of life in India: an evaluation of the IND-VFQ-33. Investigative Ophthalmol Visual Sci. 2011;52:6081–8.
10. Taylor HR, Katala S, Munoz B, Turner V. Increase in mortality associated with blindness in rural Africa. Bull World Health Organ. 1991;69:335–8. 11. Sengupta M, Agree EM. Gender and Disability
Among Older Adults in North and South India:Differences Associated with Coresidence and Marriage. J Cross-Cultural Gerontol. 2002;17:313– 36.
12. Foley D, Chowdhury J. Poverty, Social Exclusion and the Politics of Disability:Care as a Social Good and the Expenditure of Social Capital in Chuadanga, Bangladesh. Social Policy Admin. 2007;41:372–85. 13. Baltussen R, Sylla M, Mariotti SP. Cost-effectiveness analysis of cataract surgery:a global and regional analysis. Bull World Health Organ. 2004;82:338–45.
14. Murthy GVS, Jain BK, Shamanna BR, Subramanyam D. Improving cataract services in the Indian context. Community Eye Health. 2014;27(28):4-5.
15. Dandona L. Cataract surgery in very elderly patients. Outcome of cataract surgery is poor in developing countries. BMJ. 2001;323:455.
16. Dandona L, Dandona R, Anand R, Srinivas M, Rajashekar V. Outcome and number of cataract surgeries in India:policy issues for blindness control. Clin Exp Ophthalmol. 2003;31:23–31. 17. Steinberg EP, Tielsch JM, Schein OD, Javitt JC,
Sharkey P, Cassard SD, et al. The VF-14:an index of functional impairment in patients with cataract. Arch Ophthalmol. 1994;112:630–8.
18. Bellan L. Why are patients with no visual symptoms on cataract waiting lists? Can J Ophthalmol. 2005;40:433–8.
19. Acosta-Rojas ER, Comas M, Sala M, Castells X. Association between visual impairment and patient-reported visual disability at different stages of
cataract surgery. Ophthalmic Epidemiol. 2006;13:299–307.
20. Datta S, Foss AJ, Grainge MJ, Gregson RM, Zaman A, Masud T, et al. The importance of acuity, stereopsis, and contrast sensitivity for health-related quality of life in elderly women with cataracts. Invest Ophthalmol Vis Sci. 2008;49:1–6.
21. Mangione CM, Lee PP, Gutierrez PR, Spritzer K, Berry S, Hays RD. Development of the 25-item national eye institute visual function questionnaire. Arch Ophthalmol. 2001;119:1050–8.
22. Gupta SK, Viswanath K, Thulasiraj RD, Murthy GVS, Lamping DL, Smith SC, et al. The development of the Indian vision function questionnaire:field testing and psychometric evaluation. Br J Ophthalmol. 2005;89(5):621-7. 23. Kurian E. PRISM: Measuring the impact of cataract
surgery. International Agency for the Prevention of Blindness. 2017. Available at: https://www.iapb.org/ news/prism-measuring-impact-cataract-surgery/. Accessed on 3 August 2017.
24. World Health Organisation (WHO). International statistical classification of diseases and related health problems (ICD–10). 10th revision. WHO, Geneva; 2016. Available at: http://apps.who.int/ classifications/icd10/browse/2016/en#/H53-H54 Accessed on 6 December 2017.
25. WHO. Consultation on development of standards for characterization of vision loss and visual functioning. Geneva: World Health Organization, 2003.
26. Murthy GVS, Gupta SK, Thulasiraj RD, Viswanath K, Donoghue EM, et al. The development of the Indian vision function questionnaire:questionnaire content. Br J Ophthalmol. 2005;89:498–503. 27. Kazis LE, Anderson JJ, Meenan RF. Effect sizes for
interpreting changes in health status. Med Care 1989;27(3 Suppl):S178–89.
28. Polack S, Eusebio C, Mathenge W, Wadud Z, Mamunur AK, Fletcher A, et al. The impact of cataract surgery on health related quality of life in Kenya, the Philippines, and Bangladesh. Ophthalmic Epidemiol. 2010;17(6):387-99.
29. Lamoureux EL, Fenwick E, Pesudovs K, Tan D. The impact of cataract surgery on quality of life. Curr Opin Ophthalmol. 2011;22:19–27.
30. Groessl EJ, Liu L, Sklar M, Tally SR, Kaplan RM, Ganiats TG. Measuring the impact of cataract surgery on generic and vision-specific quality of life. Qual Life Res. 2013;22:1405–14.
31. Ivers RQ, Cumming R, Mitchell P. Visual impairment and falls in older adults:The Blue Mountains Eye Study. J Am Geriatr Soc. 1998;46:58–64.
33. National Programme for Control of Blindness. Guidelines for voluntary and government organisations. 12th Five-year plan report. Directorate General of Health Services. Ministry of Health and Family Welfare, Government of India; New Delhi, 2014.
Cite this article as: Kurian E, Vishwakarma P,