Analytical and computational study of three coptic icons in Saint Mercurius Monastery,
Egypt
Ahmed Refaat
1, Diaa Atta
1, Osama Osman
1, Abdel Aziz Mahmoud
1, Sherif El-Kohadary
2,
Wadeea Malek
3, Marco Ferretti
4, Hanan Elhaes
5, Medhat Ibrahim
1,*1Spectroscopy Department, National Research Center, 33 El-Bohouth Str., 12622 Dokki, Giza, Egypt
2Building Physics and Environment Institute, Housing& Building National Research Center (HBRC), 12311 Dokki, Giza, Egypt 3Scientific Group for Coptic Icons, Ministry of Antiquities, Cairo, Egypt
4Consiglio Nazionale delle Ricerche, Istituto di Scienze del Patrimonio Culturale, A.d.R. RM1, Via Salaria km 29.300, 00015 Montelibretti (Rome), Italy
5Physics Department, Faculty of Women for Arts, Science and Education, Ain Shams University, 11757, Cairo, Egypt
*corresponding author e-mail address: [email protected] | Scopus ID 8641587100
ABSTRACT
Three wooden Coptic icons located at Saint Mercurius Monastery in Tamooh, Giza, Egypt were comprehensively investigated in order to determine the possible causes of their deterioration. Samples from every paint used in each icon were collected spanning from the outermost varnish layer down to the ground layer. Investigation was carried out using Fourier-transform infrared spectroscopy (FTIR), scanning electron microscopy with energy dispersive spectroscopy (SEM-EDS), Energy-dispersive X-ray spectroscopy (EDX) and X-ray fluorescence (XRF). For interaction between the icon layers DFT calculations at B3LYP/6-31g(d,p) level were conducted in order to study the effect of humidity on the reactivity of the binder material and its possible role in the deterioration of the icons.
Keywords: Coptic icons, FTIR, SEM-EDS, XRF and B3LYP/6-31g(d,p).
1. INTRODUCTION
Coptic art refers to the art of Egypt produced by Egyptian Christians in late Roman, early Byzantine, early Arab and late Middle Ages. Icon is the word that describes a Coptic religious picture and is primarily associated with the paintings of the Orthodox Churches [1]. An icon is composed of five layers, support, usually a wooden panel, ground, binder, paint and varnish layer [2].
Although thousands of icons are found in churches and monasteries of Egypt, very limited information was available about them for a long time. Recently, studying Coptic icons has been an element of interest from different aspects including description, characterization and identification, dating, interpretation, conservation and restoration [1-5]. Like other historic structures, Coptic icons are deteriorating with aging especially when left without conservation and restoration. However, before trying to proceed with conservation and/or restoration of an icon, it is important to determine the possible sources and causes of deterioration [6].
The causes of deterioration of historic structures including Coptic icons can be biological, chemical and/or physical [6-10]. Spectroscopic and elemental analysis techniques have been extensively employed to study the causes of deterioration and effect of aging of different history and ancient structures in Egypt. The deteriorating black and red pastes used in decorating the wall of Qijmas El-Eshaqi Mosque in Cairo, Egypt were characterized and identified for the conservation process [11]. The dyes and organic stains used in silk textiles in Islamic Art museum in Cairo, Egypt were characterized as new approach for conservation treatment [12]. FTIR elucidated the changes in the chemical stability of archaeological bones as an effect of the burial
environment on crocodile bones from Hawara excavation in Fayoum, Egypt [13].
Molecular modeling approaches have also been recently applied to study cultural heritage materials [14]. Density functional theory (DFT) and wave function theory methods were employed to study the proto-isomerization mechanisms of indigo pigment and its derivatives [15]. Quantum mechanical calculations were used to study the molecular interaction between tannin dyes and protein-based historical textiles in order to identify the relative geometries and possible coordination modes [16]. Different time-depended DFT methods were used to study the electronic structures of indigo in aqueous solution in correlation with UV-Visible spectroscopy [17]. DFT quantum mechanical calculations were also implemented to study the interaction of carbonate stones with oxalates and oxamates [18].
Nowadays molecular modeling is a promising tool to elucidate the structure as well as chemical and physical parameters of many systems whereas experimental tools are limited and/or expensive [19-21].
The three Coptic icons under investigation are for Saint Abaskhiroun, Saint George, and Saints Maximus and Domatius. This work is conducted in order to investigate the possible reasons for deterioration of the three icons using FTIR to study the molecular structure of the icons, SEM-EDS and XRF to study the chemical elemental composition of the icons and their surface morphology. Molecular modeling calculations are also used to theoretically investigate the interaction between the metal oxides, supposedly present in the icons, and the binder material, and effect of this interaction on the reactivity of the icons to the surrounding environment.
Volume 9, Issue 6, 2019, 4685 - 4698
ISSN 2069-5837
Open Access Journal
Received: 22.10.2019 / Revised: 12.11.2019 / Accepted: 16.11.2019 / Published on-line: 21.11.2019Original Research Article
Biointerface Research in Applied Chemistry
www.BiointerfaceResearch.com
2. MATERIALS AND METHODS 2.1. Samples and Sample preparation.
Nine samples were collected from Saint Abaskhiroun Icon, seven samples were collected from Saint George Icon and eight samples were collected from Saints Maximus and Domatius icon. Samples were taken from the edges of the icons and/or from damaged areas using a scalpel. The collected samples were embedded in a transparent epoxy resin. The paint colors are as illustrated in table 1.
2.2. Instrumentation. 2.2.1. SEM-EDS.
SEM-EDS measurements were carried out by Philips (Inspect S, FEI Company, Holland) Scanning Electron Microscope (SEM) operated at 30 kV.
2.2.2. XRF.
Non-destructive X-ray Fluorescence analyses were performed by means of portable equipment in the CNR, Istituto per le Tecnologie Applicate ai Beni Culturali, Montelibretti, Rome, Italy.
2.2.3. Fourier-Transform Infrared Spectroscopy (FTIR).
Mid Infrared spectra are recorded using a portable ALPHA spectrometer (Bruker Optics, Germany) equipped with a ZnSe ATR crystal system. The spectra were acquired with 32 scans in the wavenumber range of 4000-400 cm-1 at room temperature and
with 4 cm-1 spectral resolution. 2.3. Computational details.
Molecular modelling simulations were carried out to investigate the possible reasons for the fragility of painting layers in Coptic icons. In particular, we simulated the interactions between the metal oxides, such as Al2O3, Fe2O3 and ZnO,
supposedly contained in the pigments, and aspartic amino acid, supposedly contained in the binder (egg yolk), in adsorbed and complex states, with and without hydration. The model, built according to previous studies, was calculated with the GAUSSIAN09 program [22], installed on a workstation at the Spectroscopy Department, National Research Centre of Egypt, and optimized by the Density Functional Theory method B3LYP/6-31g (d,P). [23-25].
Table 1. Designation of the samples obtained from the three icons
Saint Abaskhiroun Icon Saint George Icon Saints Maximus and Domatius Icon
Sample Colour Sample Colour Sample Colour
1 Green 1 Green 1 Green
2 Grey 2 Yellow 2 Blue
3 Red 3 Red 3 Green with varnish
4 Blue 4 White 4 Blue with varnish
5 Red 5 Golden 5 Frame without varnish
6 White 6 Blue 6 Varnish from the face
7 Brown 7 Golden 7 Golden background
8 Green 8 Varnish over gold
9 Golden
3. RESULTS 3.1. SEM-EDS.
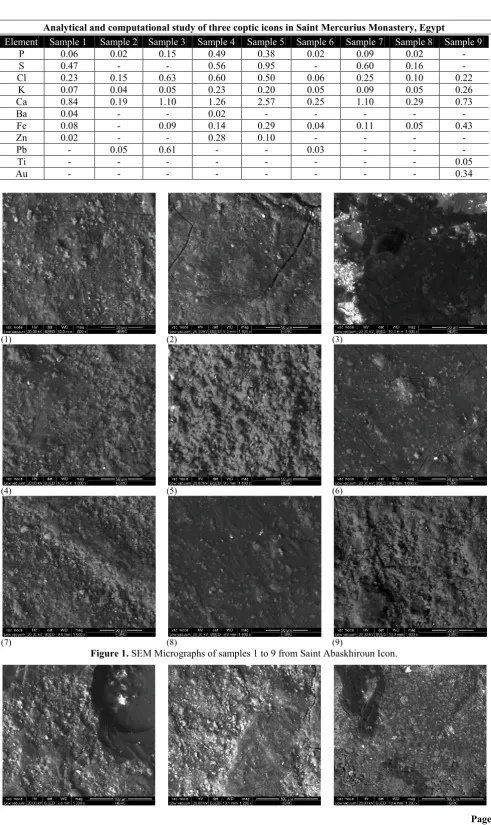
The SEM micrographs of the samples obtained from Saint Abaskhiroun Icon, Saint George Icon, and Saints Maximus and Domatius Icon are shown in Fig. 1, 2 and 3 respectively. All samples showed coarse surfaces with the presence of microcracks reflecting the effect of humidity and suggesting the cement-like nature of the ground material which was confirmed by EDS, XRF and FTIR to be composed of gypsum and lead white. The presence of Na, K and Cl in the great majority of the samples reflects the
effect of environmental salinity on the icons which was found to be present on the outer layer of the icons, not reaching the ground layer.
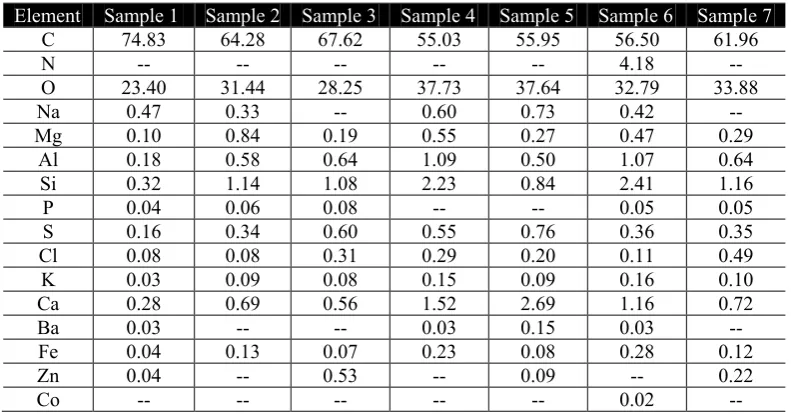
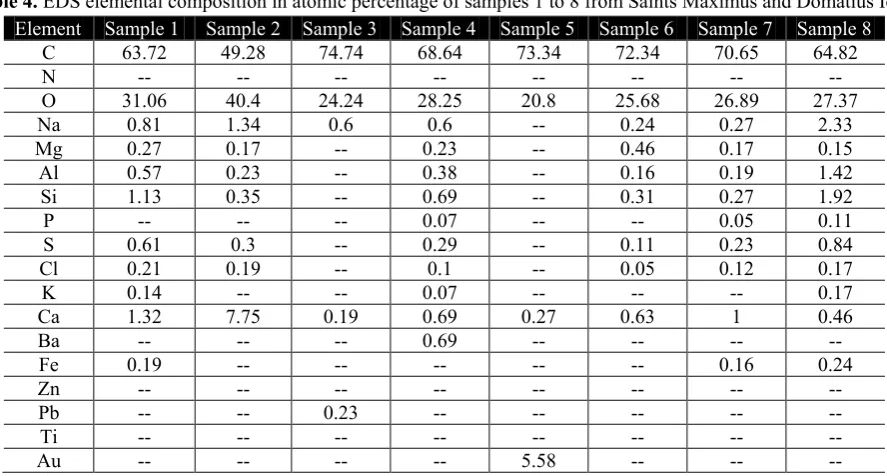
The elemental compositions in terms of atomic percentage of samples from Saint Abaskhiroun icon, Saint George icon and Saints Maximus and Domatius icon are shown in Tables 2, 3 and 4 respectively. EDS results reflected the presence of C, O and Ca in all samples. Additionally, Mg, Al, Si, Cl, and K were found in all samples from Saint Abaskhiroun and Saint George icons.
Table 2. EDS elemental composition in atomic percentage of sample 1 to 9 from Saint Abaskhiroun Icon.
Element Sample 1 Sample 2 Sample 3 Sample 4 Sample 5 Sample 6 Sample 7 Sample 8 Sample 9
C 61.24 84.91 65.40 57.58 49.27 78.72 58.49 72.48 50.01
N 1.92 - - - -
O 32.62 13.86 30.07 36.51 40.67 19.91 36.52 25.69 38.85
Na 0.66 0.25 0.43 - 0.84 0.29 0.64 0.42 0.74
Mg 0.29 0.07 0.34 0.39 0.65 0.11 0.36 0.15 0.50
Al 0.51 0.17 0.37 0.67 1.16 0.18 0.62 0.22 3.13
Analytical and computational study of three coptic icons in Saint Mercurius Monastery, Egypt
Element Sample 1 Sample 2 Sample 3 Sample 4 Sample 5 Sample 6 Sample 7 Sample 8 Sample 9
P 0.06 0.02 0.15 0.49 0.38 0.02 0.09 0.02 -
S 0.47 - - 0.56 0.95 - 0.60 0.16 -
Cl 0.23 0.15 0.63 0.60 0.50 0.06 0.25 0.10 0.22
K 0.07 0.04 0.05 0.23 0.20 0.05 0.09 0.05 0.26
Ca 0.84 0.19 1.10 1.26 2.57 0.25 1.10 0.29 0.73
Ba 0.04 - - 0.02 - - - - -
Fe 0.08 - 0.09 0.14 0.29 0.04 0.11 0.05 0.43
Zn 0.02 - - 0.28 0.10 - - - -
Pb - 0.05 0.61 - - 0.03 - - -
Ti - - - 0.05
Au - - - 0.34
(1) (2) (3)
(4) (5) (6)
(7) (8) (9)
(1) (2) (3)
(4) (5) (6)
(7)
Figure 2. SEM Micrographs of samples 1 to 7 from Saint George Icon.
Table 3. EDS elemental composition in atomic percentage of samples 1 to 7 from Saint George Icon.
Element Sample 1 Sample 2 Sample 3 Sample 4 Sample 5 Sample 6 Sample 7
C 74.83 64.28 67.62 55.03 55.95 56.50 61.96
N -- -- -- -- -- 4.18 --
O 23.40 31.44 28.25 37.73 37.64 32.79 33.88
Na 0.47 0.33 -- 0.60 0.73 0.42 --
Mg 0.10 0.84 0.19 0.55 0.27 0.47 0.29
Al 0.18 0.58 0.64 1.09 0.50 1.07 0.64
Si 0.32 1.14 1.08 2.23 0.84 2.41 1.16
P 0.04 0.06 0.08 -- -- 0.05 0.05
S 0.16 0.34 0.60 0.55 0.76 0.36 0.35
Cl 0.08 0.08 0.31 0.29 0.20 0.11 0.49
K 0.03 0.09 0.08 0.15 0.09 0.16 0.10
Ca 0.28 0.69 0.56 1.52 2.69 1.16 0.72
Ba 0.03 -- -- 0.03 0.15 0.03 --
Fe 0.04 0.13 0.07 0.23 0.08 0.28 0.12
Zn 0.04 -- 0.53 -- 0.09 -- 0.22
Co -- -- -- -- -- 0.02 --
Analytical and computational study of three coptic icons in Saint Mercurius Monastery, Egypt
Figure 3.SEM micrographs of samples 1 to 8 from Saints Maximus and Domatius Icon.
Table 4. EDS elemental composition in atomic percentage of samples 1 to 8 from Saints Maximus and Domatius Icon.
Element Sample 1 Sample 2 Sample 3 Sample 4 Sample 5 Sample 6 Sample 7 Sample 8
C 63.72 49.28 74.74 68.64 73.34 72.34 70.65 64.82
N -- -- -- -- -- -- -- --
O 31.06 40.4 24.24 28.25 20.8 25.68 26.89 27.37
Na 0.81 1.34 0.6 0.6 -- 0.24 0.27 2.33
Mg 0.27 0.17 -- 0.23 -- 0.46 0.17 0.15
Al 0.57 0.23 -- 0.38 -- 0.16 0.19 1.42
Si 1.13 0.35 -- 0.69 -- 0.31 0.27 1.92
P -- -- -- 0.07 -- -- 0.05 0.11
S 0.61 0.3 -- 0.29 -- 0.11 0.23 0.84
Cl 0.21 0.19 -- 0.1 -- 0.05 0.12 0.17
K 0.14 -- -- 0.07 -- -- -- 0.17
Ca 1.32 7.75 0.19 0.69 0.27 0.63 1 0.46
Ba -- -- -- 0.69 -- -- -- --
Fe 0.19 -- -- -- -- -- 0.16 0.24
Zn -- -- -- -- -- -- -- --
Pb -- -- 0.23 -- -- -- -- --
Ti -- -- -- -- -- -- -- --
Au -- -- -- -- 5.58 -- -- --
3.2 XRF.
It is well known that XRF has a higher penetrating power than EDS with a high spatial resolution, and is thus very useful for elemental analysis inside the sample [26].
XRF results indicated the presence of Si, Ca, Rb, Sr, Ba, Ti, Al in the ground layer and were detected in all samples, except for Sr, which was not found in the ground layer of Saint Maximus and Domatius icon. Fe was also present in all samples both in the ground and paint layers, probably in the form of Fe oxide. Pb and
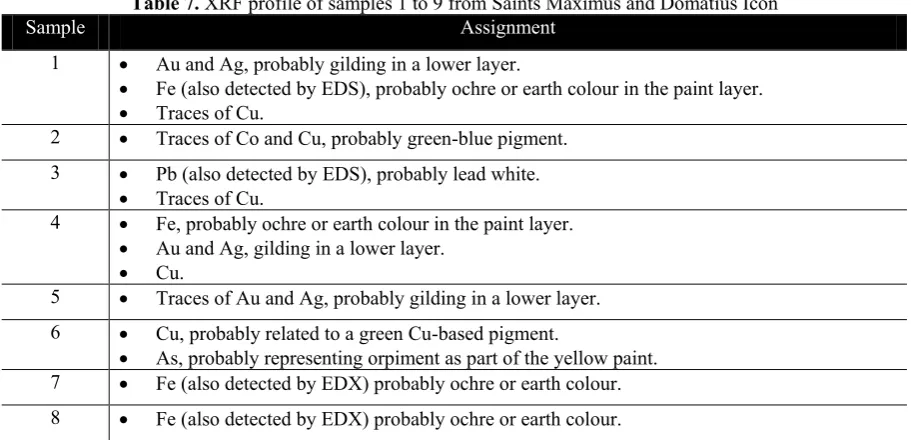
Zn were present in all samples both in the ground and the paint layers, probably in the form of mixtures between lead white and zinc white. Six samples from Saints Maximus and Domatius icon, where the visible colour is neither green nor blue, showed traces of Cu. The obtained XRF profiles of samples from Saint Abaskhiroun icon, Saint George icon, and Saints Maximus and Domatius icon are illustrated in Tables 5, 6 and 7 respectively, displaying the elements most relevant to each colour.
Table 5. XRF profile of samples 1 to 9 from Saint Abaskhiroun Icon
Sample Assignment
1 Traces of Co, probably cobalt blue.
As and traces of Sb in a lower layer, probably from previous repainting trial. 2 Pb (also detected by EDS) probably representing lead white.
3 Hg, probably cinnabar.
(4) (5) (6)
Sample Assignment Fe (also detected by EDS) probably ochre or earth colour.
Pb (also detected by EDS) probably representing lead white.
4 Fe (also detected by EDS) and traces of Co, probably reflecting a mixture of Prussian blue and cobalt blue.
Zn (also detected by EDS).
5 Fe (also detected by EDS) and traces of Hg, probably representing a mixture of red ochre and cinnabar.
6 Fe (also detected by EDS) probably ochre or earth colour.
Pb (also detected by EDS) probably representing lead white. 7 Fe (also detected by EDS) probably ochre or earth colour. 8 Fe (also detected by EDS) probably ochre or earth colour.
Traces of As, probably orpiment.
Au and Ag, gilding in a lower layer.
9 Fe (also detected by EDS) probably ochre or earth colour.
Au and Ag, gilding in a lower layer.
Ti.
Table 6. XRF profile of samples 1 to 7 from Saint George Icon
Sample Assignment
1 As, probably orpiment.
2 Fe (also detected by EDS) probably ochre or earth colour.
Au and Ag, gilding in a lower layer.
3 Traces of As, probably orpiment.
Fe probably ochre or earth colour, and Pb that may be attributed to lead white from the ground layer or red lead (Pb₃O₄).
4 Pb, lead white.
5 As, probably orpiment.
6 Co (also detected by EDS), probably reflecting cobalt blue.
7 Traces of Au and Ag, gilding layer.
Fe (also detected by EDS), probably ochre or earth colour.
Table 7. XRF profile of samples 1 to 9 from Saints Maximus and Domatius Icon
Sample Assignment
1 Au and Ag, probably gilding in a lower layer.
Fe (also detected by EDS), probably ochre or earth colour in the paint layer.
Traces of Cu.
2 Traces of Co and Cu, probably green-blue pigment.
3 Pb (also detected by EDS), probably lead white.
Traces of Cu.
4 Fe, probably ochre or earth colour in the paint layer. Au and Ag, gilding in a lower layer.
Cu.
5 Traces of Au and Ag, probably gilding in a lower layer.
6 Cu, probably related to a green Cu-based pigment.
As, probably representing orpiment as part of the yellow paint.
7 Fe (also detected by EDX) probably ochre or earth colour.
8 Fe (also detected by EDX) probably ochre or earth colour.
3.3. FTIR.
FTIR analysis was conducted in order to confirm the results obtained by EDS and XRF, particularly concerning the presence of a proteinaceous material, mostly egg yolk, in the binder layer as well as the presence of metal species, mostly metal oxides that are essentially present in paint materials.
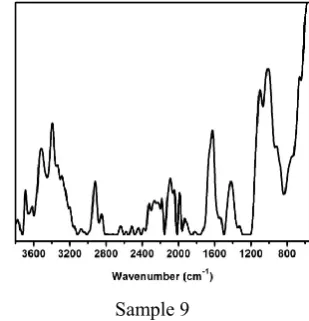
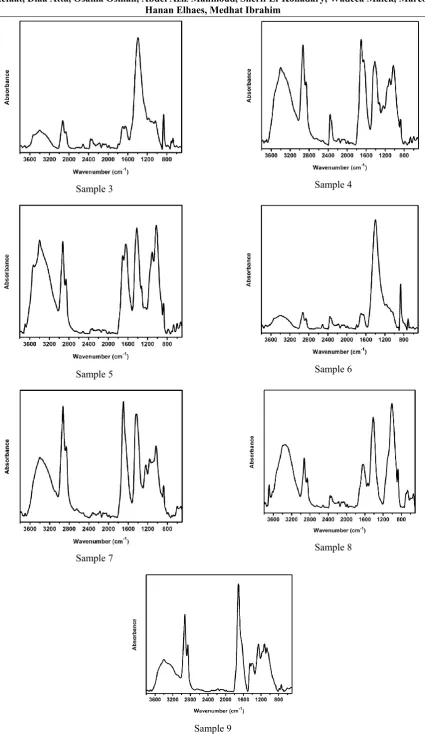
FTIR absorbance spectra of samples from Saint Abaskhiroun icon, Saint George icon, and Saints Maximus and
Domatius icon are shown in Fig. 4, 5 and 6 respectively. FTIR spectra of all samples indicated the presence of bands of N-H stretching in the range of 3300-3400 cm-1, amide C=O stretching
(amide I) in the range of 1700-1600 cm-1 and amide N-H bending
(amide II) in the range of 1600-1500 cm-1, indicating the presence
Analytical and computational study of three coptic icons in Saint Mercurius Monastery, Egypt
reflected by the bands arising in the range of 1200-400 cm-1 [27]
thus confirming the results obtained by EDS and XRF.
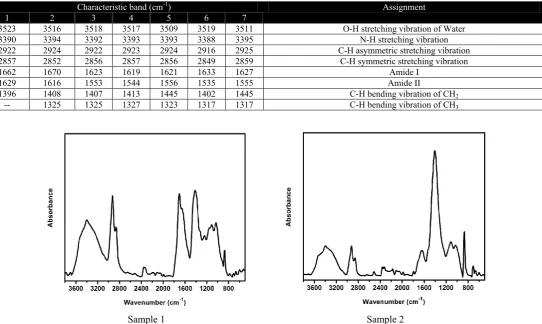
The obtained FTIR bands for samples from Saint Abaskhiroun icon, Saint George icon and Saints Maximus and Domatius icon are illustrated in Tables 8, 9 and 10 respectively.
Sample 1 Sample 2
Sample 3 Sample 4
Sample 5 Sample 6
Sample 9
Figure 4. FTIR absorbance spectra of sample 1 to 9 from Saint Abaskhiroun icon.
Table 8. FTIR band assignment of samples 1 to 9 from Saint Abaskhiroun icon
Characteristic band (cm-1) Assignment
1 2 3 4 5 6 7 8 9
3526 3531 3523 3525 3513 3521 3522 3531 3515 O-H stretching vibration of Water 3395 3391 3394 3397 3395 3386 3392 3394 3393 N-H stretching vibration 2926 2923 2919 2924 2924 2924 2923 2925 2921 C-H asymmetric stretching vibration 2862 2859 2855 2859 2861 2860 2860 2856 2851 C-H symmetric stretching vibration
1633 1641 1627 1631 1702 1633 1627 1639 1623 Amide I
1557 1553 1551 1559 1621 1545 1561 1557 1545 Amide II
1439 1412 1404 1417 1408 1413 1419 1419 1419 C-H bending vibration of CH2
1325 1315 1321 1325 1321 1325 1327 1325 1325 C-H bending vibration of CH3
Sample 1
Sample 2
Analytical and computational study of three coptic icons in Saint Mercurius Monastery, Egypt
Sample 5 Sample 6
Sample 7
Figure 5. FTIR absorbance spectra of sample 1 to 7 from Saint George icon.
Table 9. FTIR band assignment of samples 1 to 7 from Saint George icon
Characteristic band (cm-1) Assignment
1 2 3 4 5 6 7
3523 3516 3518 3517 3509 3519 3511 O-H stretching vibration of Water 3390 3394 3392 3393 3393 3388 3395 N-H stretching vibration 2922 2924 2922 2923 2924 2916 2925 C-H asymmetric stretching vibration 2857 2852 2856 2857 2856 2849 2859 C-H symmetric stretching vibration
1662 1670 1623 1619 1621 1633 1627 Amide I
1629 1616 1553 1544 1556 1535 1555 Amide II
1396 1408 1407 1413 1445 1402 1445 C-H bending vibration of CH2
-- 1325 1325 1327 1323 1317 1317 C-H bending vibration of CH3
Sample 3 Sample 4
Sample 5 Sample 6
Sample 7 Sample 8
Sample 9
Analytical and computational study of three coptic icons in Saint Mercurius Monastery, Egypt Table 10. FTIR band assignment of samples 1 to 8 from Saints Maximus and Domatius icon
Characteristic band (cm-1) Assignment
1 2 3 4 5 6 7 8 9
3366 3500 3500 3362 3366 3366 3500 3500 3364 3370 3362 3588 3309 3364 O-H stretching vibration of Water N-H stretching vibration 2927 2923 2926 2928 2925 2927 2928 2923 2924 C-H asymmetric stretching vibration 2862 2858 2863 2864 2860 2862 2861 2857 2864 C-H symmetric stretching vibration
1574 1667 1572 1574 1572 1570 1565 1667 1580 Amide I
1523 1515 1517 1519 1510 1525 -- 1502 -- Amide II
-- -- -- -- -- -- -- 1394 -- C-H bending vibration of CH2
-- -- -- -- -- -- -- -- 1307 C-H bending vibration of CH3
3.3.1. Deconvolution of FTIR spectra.
In order to further confirm the results obtained through FTIR, EDS and XRF analyses, self-deconvolution method was applied. Fourier self-deconvolution is a numerical method that is often applied in order to increase the resolution of the obtained spectra in which the intrinsic bandwidths are much greater than the instrumental resolution [28]. It was applied for two bands in each spectrum, namely the band corresponding to O-H stretching vibration (~3400-3600 cm-1) and the band corresponding to amide
I (~1600-1790 cm-1).
The O-H stretching band was selected in order to evaluate the effect of aging manifested by the presence of free OH− ions
which appear at higher wavenumber than that of intermolecular and intramolecular OH groups. The excessive formation of free OH− ions with aging makes them immediately available for
interacting with different chemical species within the icons and in the surrounding environment [29].
The amide I band was also selected as it is conformationally sensitive, thus commonly used to characterize the variation of the secondary structure in proteins and polypeptides [30], and so in this study a special attention was given to this band in order to study the interaction occurring through it between the metal oxides, supposedly present in the paint materials, and the binder which would results in a new band at a slightly higher wavenumber than that of amide I band. The selected bands both before and after deconvolution are shown in tables 11, 12 and 13.
As seen in table 11, the O-H stretching vibration band of samples 2, 7, 8 and 9 of Saint Abaskhiroun icon did not require
undergoing deconvolution because in each sample there are already two distinct bands at 3519 cm-1 and 3596 cm-1
corresponding to O-H stretching vibration of water molecule and O-H stretching vibration of free OH. Similarly, the amide I vibration band of samples 1, 2, 3, 4, 5 and 8 did not also require to undergo deconvolution due to the presence of two distinct bands in this region for each of those samples.
As shown in table 12, the O-H stretching vibration band of sample 6 of Saint George icon did not require undergoing deconvolution because there are already two distinct bands in this region at 3519 cm-1 and 3596 cm-1 corresponding to O-H stretching vibration of water molecule and O-H stretching vibration of free OH respectively. Also, as seen in the same table, the amide I band of samples 4, 5 and 7 did not require undergoing deconvolution because the amide I band of each sample clearly consisted of bands at 1663 cm-1 and 1619 cm-1 for sample 4, 1682
cm-1 and 1621 cm-1 for sample 5, and 1696 cm-1 and 1627 cm-1 for
sample 7.
As shown in Table 13, the O-H stretching vibration band of sample 5 of Saints Maximus and Domatius Icon did not need deconvolution as there are already two discrete bands at 3676 cm-1
and 3499 cm-1 corresponding to O-H stretching vibration of free
OH and O-H stretching vibration of water molecule respectively. The amide I vibration band of samples 3 and sample 6 also did not need deconvolution as there are two distinct bands in this region for each sample, being at 1663 cm-1 and 1572 cm-1 for sample 3,
and at 1667 cm-1 and 1570 cm-1 for sample 6.
Table 11. FTIR band positions before and after deconvolution of samples from Saint Abaskhiron Icon
Sample
Band position (cm−1)
O-H stretching vibration Amide I
Before After Before After
Sample 1 3526 3600 3535 -- -- --
Sample 2 -- -- -- -- -- --
Sample 3 3523 3588 3533 -- -- --
Sample 4 3525 3609 3535 -- -- --
Sample 5 3513 3615 3525 -- -- --
Sample 6 3521 3613 3529 1633 1716 1623
Sample 7 -- -- -- 1627 1714 1621
Sample 8 -- -- -- -- -- --
Sample 9 -- -- -- 1623 1667 1619
Table 12. FTIR band positions before and after deconvolution of samples from Saint George Icon
Sample
Band position (cm−1)
O-H stretching vibration Amide I
Before After Before After
Sample 1 3523 3605 3527 1662 1725 1672
Sample Band position (cm
−1)
O-H stretching vibration Amide I
Before After Before After
Sample 3 3518 3598 3531 1621 1669 1619
Sample 4 3517 3598 3525 -- -- --
Sample 5 3509 3637 3521 -- -- --
Sample 6 -- -- -- 1633 1657 1621
Sample 7 3511 3592 3515 -- -- --
Table 13: Saints Maximus and Domatius Icon FTIR band positions before and after deconvolution
Sample Band position (cm
−1)
O-H stretching vibration Amide I
Before After Before After
Sample 1 3366 3507 3433 1704 1649 1578
Sample 2 3500 3505 3441 1667 1723 1668
Sample 3 3500 3566 3509 -- -- --
Sample 4 3366 3507 3437 1574 1649 1578
Sample 5 -- -- -- 1572 1651 1582
Sample 6 3500 3566 3511 -- -- --
Sample 7 3362 3509 3427 1565 1651 1568
Sample 8 3588 3596 3501 1667 1667 1586
Sample 9 3364 3590 3501 1580 1655 1582
3.4. Molecular Modeling Study.
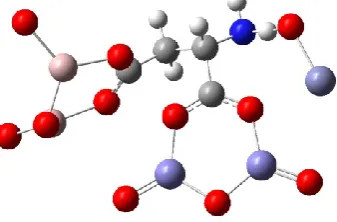
Molecular modelling simulations were used to describe the interaction between aspartic amino acid, contained in the binder, and aluminum, iron and zinc oxides, supposedly contained in the paint layer. Fig. 7 and 8 show three metal oxides, namely Fe2O3, Al2O3 and ZnO, interacting with aspartic amino acid
without and with hydration, respectively.
The interaction takes place through the hydrogen bonding of COOH and NH2. The first carboxyl group is bridging onto
Al2O3 while the second is bridging onto Fe2O3. ZnO is supposed to
interact with aspartic acid through one hydrogen of NH2 group.
When hydration takes place, 7 water molecules form a weak interaction as shown in Fig. 8.
Figure 7. Results of molecular modeling simulations: iron, aluminum and zinc oxides interacting with aspartic amino acid without water molecules.
Technical details are given elsewhere [31]; here we want to remark that the structure remains reactive even after hydration with 7 water molecules and is potentially capable of causing severe deterioration of the painting layer. While the findings of [31], need more verification in case of the interaction between amino acid and more than one metal oxide as indicated in the last research. As shown in table 14, the interaction between three metal oxides and amino acid show optimized structure at B3LYP/6-31g(d,p) the total dipole moment was 13.3374 Debye while the HOMO/LUMO band gap is 0.4065 eV. As far as water
molecules interact with this configuration these values became 12.7158 Debye and 0.3967 eV respectively.
Figure 8. Results of molecular modeling simulations: iron, aluminum and zinc oxides interacting with aspartic amino acid with water molecules
The correlation between physical parameters such as total dipole moment and HOMO/LUMO band gap energies is discussed in detail earlier [32]. It is stated that higher values of total dipole moment with lower values of HMO/LUMO indicated that such molecular systems could further interact with its surrounding molecules. According to the calculations, the total dipole moment of the resulting coordination compound is high, while HOMO/LUMO band gap energy is decreased as water interacted with metal oxides/amino acid, thus increasing its reactivity to interact with the environment, in particular with water molecules from environmental humidity. This interaction may cause severe deterioration of the painting.
Analytical and computational study of three coptic icons in Saint Mercurius Monastery, Egypt
Table 14. B3LYP/6-31g(d,p) total dipole moment (TDM) as Debye and Band gap energy (E) as eV for the studied structure.
Studied structures TDM E
Iron, aluminium and zinc oxides/aspartic acid 13.3374 0.4065 Iron, aluminum and zinc oxides/aspartic acid/water 12.7158 0.3967
4. CONCLUSIONS
Studying and tracking the effect of aging on Coptic icons is very crucial for conservation/restoration processes and to avoid future deterioration of the icons for the same reasons. SEM micrographs of the samples obtained the three icons demonstrated the effect of aging reflected by the presence of microcracks owing to the cement-like nature of the ground layers of the icons. EDS and XRF analyses confirmed that the ground layer of the icons is made of gypsum and lead white. The binder was found to be egg yolk which was confirmed by EDS analysis that indicated the presence of an organic component and further confirmed by FTIR which showed the characteristic bands of a protein. XRF and EDS analysis indicated the presence of several metals, mostly metal oxides, in the paint layer. FTIR confirmed the presence of metal oxides reflected by their characteristic bands in the obtained spectra. DFT molecular modeling calculations of the interaction of aluminium, iron and zinc oxides with aspartic amino acid both in adsorbed and complex states, with and without hydration indicated that the reactivity of the resultant coordinated compounds under the effect of hydration from humidity is significantly increased
due to conversion of metal oxides into metal hydroxides. Deconvolution of O-H stretching vibration band and amide I band in the FTIR spectra of most of the samples confirmed the computational resulting through indicating the presence of bands characteristic for free OH ions as well as the presence of bands characteristic for conformationally altered amide I band suggesting the interaction with the metal oxides of the paint layer. Molecular modeling was used to describe the interaction between aspartic acid which is contained in the binder of a painting layer, and aluminum, iron and zinc oxides which are contained in the pigments. Calculated total dipole moment of the resulting coordinated compound increases, accordingly the capability of interaction increased with the surrounding environment. Particular with water from environmental humidity, this interaction may cause severe deterioration of the painting. So, this proposed mechanism of the effect of hydration from humidity on the resultant coordinated compounds in the paint layer is suggested to be a major cause of the severe deterioration of the icons with time.
5. REFERENCES
1. Abdel-Ghani, M.; Edwards, H.G.M.; Janaway, R.; Stern, B. A Raman microscopic and gas chromatographic–mass spectrometric study of two 19th century overlapping Coptic icons of Anastasy Al-Romi. Vib. Spectrosc. 2008, 48, 69–75,
https://doi.org/10.1016/j.vibspec.2008.02.013.
2. Sakr, A.A.; Ghaly, M.F.; Geight, E.F.; Abdel-Haliem, M.E.F. Characterization of grounds, pigments, binding media, and varnish coating of the Angel Michael' icon, 18th century, Egypt.
Journal of Archaeological Science: Reports 2016, 9, 347–357,
http://dx.doi.org/10.1016/j.jasrep.2016.08.039.
3. Issa, Y.M.; Abdel-Maksoud, G.; Magdy, M. Analytical study
of Saint Gregory Nazianzen Icon, Old Cairo, Egypt.
J. Mol. Struct. 2015, 1100, 70-79,
http://dx.doi.org/10.1016/j.molstruc.2015.07.004.
4. Abdel-Ghani, M.; Stern, B.; Edwards, H.G.M.; Janaway, R. A study of 18th century Coptic icons of Ibrahim Al-Nasekh using Raman microscopy and gas chromatography–mass spectrometry: Indigo as an organic pigment in Egyptian panel
paintings. Vib. Spectrosc. 2012, 62, 98–109,
http://dx.doi.org/10.1016/j.vibspec.2012.05.003.
5. Abdel-Ghani, M.; Edwards, H.G.M.; Stern, B.; Janaway, R. Characterization of paint and varnish on a medieval
Coptic-Byzantine icon: Novel usage of dammar resin.
Spectrochim. Acta A 2009, 73, 566–575,
https://doi.org/10.1016/j.saa.2008.10.050.
6. Gulzar, S.; Burg, J.P. Preliminary investigation of late Mughal period wall paintings from historic monuments of Begumpura, Lahore. Frontiers of Architectural Research2018,
7, 465-472, https://doi.org/10.1016/j.foar.2018.08.001.
7. Mikayama, A.; Hokoi, S.; Ogura, D.; Okada, K.; Su, B. Effects of Drifting Sand Particles on Deterioration of Mural Paintings on the East Wall of Cave 285 in Mogao Caves,
Dunhuang. Enrgy Proced. 2015, 78, 1311-1316,
https://doi.org/10.1016/j.egypro.2015.11.146.
8. Sterflinger, K.; Piñar, G. Microbial deterioration of cultural heritage and works of art — tilting at windmills? Appl.
Microbiol. Biotechnol. 2013, 97, 9637–9646,
https://doi.org/10.1007/s00253-013-5283-1.
9. Sterflinger, K. Fungi: Their role in deterioration of cultural
heritage. Fungal Biol. Rev. 2010, 24, 47-55,
https://doi.org/10.1016/j.fbr.2010.03.003.
10.Petronela, S.; Sandu, I.; Stratulat, L. The conscious deterioration and degradation of the cultural heritage.
International Journal of Conservation Science2017, 8, 81-88. 11.Bakr, A-M.; Kawiak, T.; Pawlikowski, M.; Sawlowicz, Z. Characterisation of 15th century red and black pastes used for
wall decoration in the Qijmas El-Eshaqi mosque (Cairo, Egypt).
J. Cult. Herit. 2005, 6, 351-356,
https://doi.org/10.1016/j.culher.2004.12.002.
12.Ahmed, H.E.; Ziddan, Y.E. A new approach for conservation treatment of a silk textile in Islamic Art Museum, Cairo.
J. Cult. Herit. 2011, 12, 412-419,
https://doi.org/10.1016/j.culher.2011.02.004.
13.Abdel-Maksoud, G.; Abdel-Hady, M. Effect of burial environment on crocodile bones from Hawara excavation,
Fayoum, Egypt. J. Cult. Herit. 2011, 12, 180-189,
https://doi.org/10.1016/j.culher.2010.12.002.
14.Fantacci, S.; Amat, A.; Sgamellotti, A. Computational Chemistry Meets Cultural Heritage: Challenges and
Perspectives. Acc. Chem. Res. 2010, 43, 802–813,
https://doi.org/10.1021/ar100012b.
15.Hajjar, L.; Hicks, R.G.; Zeng, T. A Computational Study of the Protoisomerization of Indigo and Its Imine Derivatives. J. Phys. Chem. A 2016, 120, 7569–7576,
https://doi.org/10.1021/acs.jpca.6b07838.
16.Jurinovich, S.; Degano, I.; Mennucci, B. A Strategy for the Study of the Interactions between Metal–Dyes and Proteins with QM/MM Approaches: the Case of Iron–Gall Dye. J. Phys. Chem. B 2012, 116, 13344–13352,
https://doi.org/10.1021/jp3083002.
17.Jiwalak, N.; Daengngern, R.; Rungrotmongkol, T.;
Dokmaisrijan, S. A spectroscopic study of indigo dye in aqueous
solution: A combined experimental and TD-DFT study.
J. Lumin. 2018, 204, 568-572,
https://doi.org/10.1016/j.jlumin.2018.08.060.
18.Pintus, A.; Aragoni, M.C.; Carcangiu, G.; Giacopetti, L.; Isaia, F.; Lippolis, V.; Maiore, L.; Melonid, P.; Arca, M. Density functional theory modelling of protective agents for carbonate stones: a case study of oxalate and oxamate inorganic salts. New J. Chem. 2018, 42, 11593-11600,
https://doi.org/10.1039/C8NJ01714J.
19.Galal, A.M.F.; Atta, D.; Abouelsayed, A.; Ibrahim, M.A.; Hanna, A.G. Configuration and Molecular Structure of
5-Chloro-N-(4-sulfamoylbenzyl) Salicylamide Derivatives.
Spectrochim. Acta A 2019, 214, 476–486,
https://doi.org/10.1016/j.saa.2019.02.070.
20.Abdelsalam, H.; Teleb, N.H.; Yahia, I.S.; Zahran, H.Y.; Elhaes, H.; Ibrahim, M.A. First principles study of the adsorption of hydrated heavy metals on graphene quantum dots.
J. Phys. Chem. Solids 2019, 130, 32-40,
https://doi.org/10.1016/j.jpcs.2019.02.014.
21.Abdelsalam, H.; Saroka, V.A.; Ali, M.; Teleb, N.H.; Elhaes, H.; Ibrahim, M.A. Stability and electronic properties of edge functionalized silicene quantum dots: A first principles study.
Physica E 2019, 108, 339–346,
https://doi.org/10.1016/j.physe.2018.07.022.
22.Frisch, M.; Trucks, G.; Schlegel, H.; Scuseria, G.; Robb, M.; Cheeseman, J.; Scalmani, G.; Barone, V.; Mennucci, B.; Petersson, G.; Nakatsuji, H.; Caricato, M.; Li, X.; Hratchian, H.; Izmaylov, A.; Bloino, J.; Zheng, G.; Sonnenberg, J.; Hada, M.; Ehara, M.; Toyota, K.; Fukuda, R.; Hasegawa, J.; Ishida, M.; Nakajim, T.; Honda, Y.; Kitao, O.; Nakai, H.; Vreven, T.; Montgomery Jr, J.; Peralta, J.; Ogliaro, F.; Bearpark, M.; Heyd, J.; Brothers, E.; Kudin, K.; Staroverov, V.; Keith, T.; Kobayashi, R.; Normand, J.; Raghavachari, K.; Rendell, A.; Burant, J.; Iyengar, S.; Tomasi, J.; Cossi, M.; Rega, N.; Millam, J.; Klene, M.; Knox, J.; Cross, J.; Bakken, V.; Adamo, C.; Jaramillo, J.; Gomperts, R.; Stratmann, R.; Yazyev, O.; Austin, A.; Cammi, R.; Pomelli, C.; Ochterski, J.; Martin, R.; Morokuma, K.; Zakrzewski, V.; Voth, G.; Salvador, P.; Dannenberg, J.; Dapprich, S.; Daniels, A.; Farkas, O.; Foresman, J.; Ortiz, J.; Cioslowski, J.; Fox, D. Gaussian 09 Revision C.01, Gaussian Inc. 2010, Wallingford CT.
23.Becke, A.D. A new mixing of Hartree–Fock and local density functional theories. J. Chem. Phys.1993, 98, 1372-1377,
https://doi.org/10.1063/1.464304.
24.Lee, C.; Yang, W.; Parr, R.G. Development of the Colle-Salvetti correlation-energy formula into a functional of the
electron density. Phys. Rev. B 1988, 37, 785-789,
https://doi.org/10.1103/PhysRevB.37.785.
25.Miehlich, B.; Savin, A.; Stoll, H.; Preuss, H. Results obtained with the correlation energy density functionals of becke and Lee, Yang and Parr. Chem. Phys. Lett. 1989, 157, 200-206,
https://doi.org/10.1016/0009-2614(89)87234-3.
26.Ferretti, M.;The investigation of ancient metal artefacts by portable X-ray fluorescence devices. J. Anal. At.
Spectrom.2014,
29,1753-1766. https://doi.org/10.1039/c4ja00107a.
27.Gendreau, R.M.; Jakobsen, R.J.; Henry, W.M.; Knapp, K.T. Fourier transform infrared spectroscopy for inorganic compound speciation. Environ. Sci. Technol. 1980, 14, 990–995,
https://doi.org/10.1021/es60168a008.
28.Friesen, W.I.; Michaelian, K.H. Fourier deconvolution of photoacoustic FTIR spectra. Infrared Phys. 1986, 26, 235-242,
https://doi.org/10.1016/0020-0891(86)90075-8.
29.Baglioni, P.; Chelazzi, D.; Giorgi, R. Nanotechnologies in the Conservation of Cultural Heritage: A compendium of materials and techniques. Springer, Netherlands, 2014.
30.Wu, Y.; Xu, Y.; Wang, D.; Zhao, Y.; Weng, S.; Xu, D.; Wu, J. FT-IR spectroscopic investigation on the interaction between nylon 66 and lithium salts. J. Appl. Polym. Sci.2004, 91, 2869– 2875, https://doi.org/10.1002/app.13495.
31.Mahmoud, A.A.; Osman, O.; Elhaes, H.; Ferretti, M.; Fakhry, A.; Ibrahim, M.A. Computational Analyses for the
Interaction Between Aspartic Acid and Iron.
J. Comput. Theor. Nanosci. 2018, 15, 470-473,
https://doi.org/10.1166/jctn.2018.7113.
32.Ibrahim, M.A.; Mahmoud, A-A. Computational Notes on the Reactivity of some Functional Groups. J. Comput. Theor. Nanosci. 2009, 6, 1523–1526,
https://doi.org/10.1166/jctn.2009.1205.
33. Badry, R.; El-Khodary, S.; Elhaes, H.; Nada, N.; Ibrahim, M. The Influence of Moisture on the Electronic Properties of Monomer, Dimer, Trimer and Emeraldine Base Sodium Carboxymethyl Cellulose. Egyptian Journal of Chemistry
2019, 62, 39-56, https://doi.org/10.33263/LIANBS82.553557. 34. Grenni, P.; Caracciolo, A.B.; Mariani, L.; Cardoni, M.; Riccucci, C.; Elhaes, H.; Ibrahim, M.A. Effectiveness of a new green technology for metal removal from contaminated water.
Microchemical Journal 2019, 147, 1010-1020,
https://doi.org/10.1016/j.microc.2019.04.026.
35. Afzal, M.A.F.; Hachmann, J. Benchmarking DFT
approaches for the calculation of polarizability inputs for refractive index predictions in organic polymers. Phys. Chem. Chem. Phys. 2019, 21, 4452-4460, https://doi.org/10.1039/C8CP05492D.
36. Fahim, A.M.; Shalaby M.A.; Ibrahim, M. Microwave-assisted synthesis of novel 5-aminouracil-based compound with DFT calculations. J. Mol. Struct. 2019, 1194, 211-226,
https://doi.org/10.1016/j.molstruc.2019.04.078.
37. Arı, H.; Büyükmumcu, Z. Comparison of DFT
functionals for prediction of band gap of conjugated polymers and effect of HF exchange term percentage and basis set on the performance. Computational Materials Science 2017, 138, 70-76, https://doi.org/10.1016/j.commatsci.2017.06.012.
38. Youness, RA.; Taha, MA.; Ibrahim, M. In vitro bioactivity, molecular structure and mechanical properties of
zirconia-carbonated hydroxyapatite nanobiocomposites
sintered at different temperatures, Materials Chemistry and Physics, 2020, 239,122011.
https://doi.org/10.1016/j.matchemphys.2019.122011
6. ACKNOWLEDGEMENTS
This work is funded in the frameworks of: a) the Academy of Scientific Research and Technology, Egypt, ASRT Initiative, grant number 1394 and b) the CNR-NRC 2016-2017 Bilateral Project "Joint instrumental investigation of museum collections as a means of enhancing Cultural Heritage and strengthening interdisciplinary collaboration".