BIOSCIENCES BIOTECHNOLOGY RESEARCH ASIA,April 2015. Vol. 12(1), 269-279
* To whom all correspondence should be addressed.
Evaluation of Physical Activity and Dietary Habits of Women in
Anzali Port and its Relationship to Public Health and Obesity
Monireh Alsadat Basirat1, Bahman Mirzaei2 and Hasan Alikhani3
1Guilan Science and Research Branch, Islamic Azad University, Guilan, Iran. 2Department of Sports Science, University of Guilan, Rasht, Iran. 3Department of Physical Education and Sport Science, Lahijan Branch,
Islamic Azad University, Lahijan, Iran. DOI: http://dx.doi.org/10.13005/bbra/1662
(Received: 30 November 2014; accepted: 20 January 2015)
The purpose of this study is to assess the level of physical activity and dietary habits among women in Bandar Anzali and examine their relationship to public health and the prevalence of obesity. In this study, 400 women (20 to 70 years old) were examined in Bandar Anzali. Demographic data was collected through questionnaires and interviews. To assess physical activity, the Beck physical activity questionnaire was used. To determine dietary habits, the nutrition questionnaire of Adami and Cordera was used. In addition, 12-item General Health Questionnaire (GHQ) was used to assess general health. To determine the prevalence of obesity, body mass index (BMI) was calculated. To examine the relationships between variables, the Kruskal-Wallis test, chi-square, Mann Whitney and Spearman correlation coefficient were used in 95% confidence. Results showed that the 51-70 year-old group had the least amount of physical activity, the lowest rated general health, eating habits, and the highest mean BMI compared to other groups. Prevalence of overweight and obesity was 42 and 22.5% and increased by aging and decreasing physical activity (Pd”0.05). Obese group had the lowest level of physical activity. There was no significant relationship between dietary habits in different categories of BMI. There was a positive significant relationship between obesity and marital status and housing (Pd”0.05); however, there was no significant relationship between obesity and education, income, smoking and history of heart diseases (individual and family). The results of this study showed that low educational level, unhealthy dietary habits and low physical activity led to weight gain, obesity and reduced overall health of women. Therefore, increased knowledge and awareness of nutrition and modified lifestyle and physical activity are essential as the best way to prevent obesity and obesity-related diseases.
Key words: Physical activity, Dietary habits, Obesity and public health.
Obesity is a multiple-cause chronic disease arising from interaction between heredity and environment2. Not only developed countries56, 37, but also developing countries are faced with an
epidemic obesity in children and adults57, 43.
Although most researchers agree on the effects of obesity on health, there is little agreement among researchers on how to manage and treat obesity.
Information regarding how and why obesity occurs is incomplete, but it is believed that a combination of social, behavioral, cultural, physiological, metabolic and genetic factors are involved2.
Some scientific evidence suggests that the lack or low level of physical activity is an important factor in prevalence of overweight and obesity. Nevertheless, researchers are faced with the question that the role of physical activity and exercise to reduce fat and weight control is to what extent and in what form30.
obesity such as insulin resistance, diabetes, hypertension, hyperlipidemia, and hyperandrogenism experienced by women are mainly associated with intra-abdominal fat or upper part rather than accumulation of fat36, 47.
Recent epidemiological studies indicate a prevalence of overweight and obesity and the metabolic syndrome in Iran, equal to or greater than Europe and the United States50. Medical
reports suggest that obesity is associated with many physical illnesses and deaths in 75% obese people is 25% more than in normal individuals. Obesity is clearly associated with the risk of cardiovascular disease. On the other hand, 60% of too fat people suffer from hypertension and when they reduced the amount of weight, their blood pressure is reduced. Shortness of breath under reduced vital capacity of the lungs due to an accumulation of fats in the abdominal wall and chest is listed as the other complication of obesity. Interrupted breathing during sleep and low ventilatory syndrome is also associated with obesity. Orthopedically, the flat foot, knee and spine arthritis and gout is increased in obese subjects. Other diseases which can be linked to obesity include diabetes, gastrointestinal and liver problems and types of cancer. In fact, weight control will increase the life span14. Poor diet and
low physical activity are causes of overweight and obesity65. Therefore, physical activity, nutrition
care, control of obesity and information in the field of obesity are essential for health planning and public health.
MATERIALS AND METHODS
The methodology used for this study is descriptive correlation. The studied group included all 20-70 year-old women living in Bandar Anzali. As samples, 400 subjects were selected by random cluster sampling.
Using a tape measure and s scale, information on the subjects’ height and weight were recorded. The used questionnaire is as follows.
Demographic information questionnaire
Demographic data included income, education, marital status, history of cardiovascular diseases in first-degree relatives of the subjects, smoking status and housing. The subjects were divided into three groups according to age, young,
middle-aged and adult26.
Beck physical activity questionnaire
This questionnaire is highly correlated to physical activity (r = 0.69) and it is recognized appropriate for epidemiological studies. The questionnaire included questions on three parts, jobs, sports and leisure time29.
12-item General Health Questionnaire (GHQ)
This questionnaire used to assess the general health of subjects is a screening method based on self-reporting which is formed from the lowest levels of morbidity existing in important psychological disorders12. General Health
Questionnaire contains four subscales including somatic symptoms, anxiety and insomnia, social dysfunction and depression9.
Dietary Habits Questionnaire
This author-developed questionnaire is derived from the nutritional status questionnaire for Mediterranean people (Adami and Cordera). Dietary habits include overeating or anorexia, consuming vegetables, yogurt and dairy products, the use of salt, the amount of fruit and so on.
Measurement of physical activity
Beck physical activity questionnaire29 was
used to assess the physical activity. Questionnaire has five items which are scored according to the intensity of physical activity, from one to five. Accordingly, 1 represents the lowest level of physical activity. Finally, an overall score of physical activity was calculated from the achieved average.
Assessment of general health among subjects
Information on general health of subjects was obtained from a 12-item general health questionnaire (GHQ). The questionnaire consists of 12 items which are evaluated based on Likert scoring system. Each item has four choices; therefore, the overall score will vary from 0 to 36. The lower scores indicate better mental health.
Evaluation of dietary habits
The questionnaire is used to assess information on dietary habits of subjects. Based on the responses to the questionnaire, subjects were evaluated for eating habits.
BMI
to or greater than 30 was used to determine obesity: BMI = weight (kg) / Height (m2)
Obesity
Body mass index was used to determine obesity. Subjects who have a body mass index equal to or greater than 30 were considered obese. BMI was used as a measure of obesity and non-obesity of subjects and non-obese and obese subjects were divided into two groups.
Methods
Descriptive statistics were used for describing data. For analytic statistics, Kolmogorov-Smirnov test was used for normality of data distribution. The Kruskal-Wallis test, chi-square and Mann–Whitney were used to determine differences between groups and the Spearman correlation coefficient to determine the relationships between variables in 95% confidence. In all the statistical steps, the software package SPSS (version 19) was used.
RESULTS
Table 2 shows the prevalence of overweight (42%) and obesity (22.5%) in women living in Bandar Anzali.
Table 3 presents distribution of different age groups and mean and standard deviation of physical activity, public health, dietary habits and body mass index (BMI). The results show that the level of physical activity, public health and dietary habits reduced by aging; accordingly, the age group of 51 to 70 years had the minimum amount of physical activity, the lowest rated general health,
dietary habits, and the highest average body mass index (BMI).
As Table 4 shows distribution and mean of different variables including single, married and divorced women, the highest distribution of physical activity and mental health belongs to married women, while the lowest BMI belongs to single women.
According to Table 5, there is a significant difference between the level of physical activity in different groups of body mass index (acceptable weight, overweight and obesity) among women living in Bandar Anzali. Based on the average
Table 2. Prevalence of overweight (42%) and obesity (22.5%)
BMI Number %
Acceptable 142 35.5
Overweight 168 42
Obese 90 22.5
Table 3. Distribution of different age groups
Age group Variables Number % Mean and standard deviation
20-35 Physical Activity 207 51.8 38.87±8.01
Public Health 207 51.8 25.29±4.60
Dietary habits 207 51.8 9.84±1.23
BMI 207 51.8 25.67±4.16
36-50 Physical Activity 178 44.5 37.25±7.62
Public Health 178 44.5 25.42±4.23
Dietary habits 178 44.5 9.73±1.16
BMI 178 44.5 28.18±4.62
51-70 Physical Activity 15 3.8 36.92±6.74
Public Health 15 3.8 25.40±5.26
Dietary habits 15 3.8 9.66±1.34
BMI 15 3.8 28.90±4.92
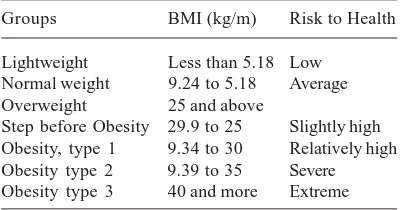
Table 1. Classification of obesity by WHO [219]
Groups BMI (kg/m) Risk to Health
Lightweight Less than 5.18 Low Normal weight 9.24 to 5.18 Average Overweight 25 and above
Table 4. Distribution and mean of different variables
Age group Variables Number % Mean and standard deviation
2Single Physical Activity 46 11.5 37.40±7.96
Public Health 46 11.5 24.60±4.37
Dietary habits 46 11.5 10.58±1.25
BMI 46 11.5 23.14±4.01
Married Physical Activity 348 87 38.20±7.85
Public Health 348 87 29.41±4.45
Dietary habits 348 87 9.68±1.16
BMI 348 87 27.41±4.43
Divorced Physical Activity 6 1.5 36.12±4.72
Public Health 6 1.5 27.33±5.46
Dietary habits 6 1.5 9.66±1.21
BMI 6 1.5 26.80±3.87
Table 5. Level of physical activity in different groups of body mass index
BMI Number % Mean score Chi-square Degree of freedom Sig.
Physical activity Acceptable 142 35.5 217.65 6.857 2 0.032* Overweight 168 42 192.26
Obese 90 22.5 181.47
Table 6. Level of physical activity and housing status of women
Housing status Number % Mean score Chi-square Degree of freedom Sig.
Physical Private 281 70.2 187.77 7.312 2 0.010
activity Rental 99 24.8 224.05 Organizational 20 5 262.75
Table 7. Levels of BMI in different age groups
Age Acceptable Overweight Obesity Mean score Chi-square Sig.
groups Number % Number % Number %
20-35 91 44 89 43 27 13 213.45 26.795 0.000*
36-50 47 26.4 75 42.1 56 31.5 186.69
51-70 4 26.7 4 26.7 7 46.7 185.73
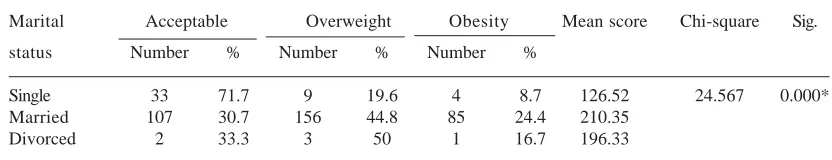
Table 8. Levels of BMI and marital status
Marital Acceptable Overweight Obesity Mean score Chi-square Sig.
status Number % Number % Number %
Single 33 71.7 9 19.6 4 8.7 126.52 24.567 0.000*
Married 107 30.7 156 44.8 85 24.4 210.35
scores, the greatest amount of physical activity was related to acceptable group and the lowest was related to the obese group.
According to Table 6, there is a significant relationship between the level of physical activity and housing status of women living in Bandar Anzali.
According to Table 7, there is a significant relationship between levels of BMI in different age groups.
According to Table 8, there is a significant relationship between levels of BMI and marital status.
DISCUSSION
There is a significant difference in physical activity level of the normal weight group and obese women in Bandar Anzali, while there is no significant difference in physical activity of normal group and the overweight group as well as overweight group and obese group. There is no significant relationship between dietary habits and physical activity among women in Bandar Anzali. There is no significant relationship between public health and level of physical activity among women in Bandar Anzali. There is no significant relationship between demographic characteristics (age, education, history of heart diseases (individual and family), smoking, marital status, and income) and the amount of physical activity among women in Bandar Anzali, while there is a significant difference between physical activity and housing. There is no significant relationship between dietary habits of different groups of BMI among women in Bandar Anzali. There is a significant difference in general health of various groups of BMI (normal weight, overweight and obese) among women living in Bandar Anzali. There is a significant relationship between different groups of BMI, age groups and marital status of women in Bandar Anzali, while there is no significant relationship between different groups of BMI, education, housing status, history of heart diseases (individual and family), smoking and income.
In this cross-sectional study, the prevalence of overweight and obesity was 22.5 and 42% among 20 to 70 year-old women, respectively. Azizi et al (2005) reported the prevalence of obesity in women aged 80-20 in
Tehran as 40.3%29. In a study by Azadbakht et al
(2004) in Tehran, the prevalence of overweight and obesity was reported 41.6 and 14.2% in men and 37 and 29.1% in women5.
Akhavantabib et al (2004) studied people over 19 years in Esfahan, Najafabad and Arak for prevalence of overweight in men and women (30.3 and 33.3%) and the prevalence of obesity in men and women (9.3 and 23.4%), respectively2.
Najafi et al (2009) reported the prevalence of obesity (14.9%) and overweight (36.1%) in women aged 25-64 years living in Khorramabad23.
Sadr Bafghi et al (2009) reported the prevalence of overweight (52.7%) and obesity (24.2%) in women living in Yazd16.
Ayatollahi al (2010) conducted a study in Shiraz on the prevalence of obesity (22.5%) and overweight (63.9%) in women, which indicates 17.4% increase in women over 14 years27.
Amiriparsa et al (2013) reported the prevalence of overweight (42.4%) and obesity (31.6%) in women living in Sabzevar4. Aqa’alinejad
et al (2013) reported the prevalence of overweight (53%) and obesity (18.6%) in women aged 15-64 years who live in Ardabil, Isfahan, Ahvaz, Tehran, Rasht, Kerman and Mashhad7. The prevalence of
obesity among women in Bandar Anzali is largely similar to prevalence of obesity in Isfahan, Najaf Abad, Arak, Yazd and Shiraz. The prevalence of overweight is similar to Sabzevar. Differences in the prevalence of overweight and obesity in Bandar Anzali and some cities may be due to the differences in levels of physical activity, socioeconomic and nutritional differences among the studied populations.
In the present study, there is a significant difference in physical activity of normal group than the obese women. The physical activity of normal group was more than the obese and overweight groups; however, this difference is not statistically significant between normal group and the overweight group. Generally, the maximum amount of physical activity was observed in women with normal weight and the lowest amount was among obese women.
relationship between physical activity and obesity. Active people experienced lower weight gain than those who were inactive. In addition, inactive people had higher BMI than those who were active45.
Evaluating the national health in Spain among adults aged from 20 to 60 years, Gutierrez et al (2002) found that BMI of people who had no physical activity in leisure time was higher than that of people with physical activity. Moreover, the odds ratio of obesity reduced by increasing physical activity levels in men and women38.
Abdul-Rahim et al (2003) found a negative relationship between physical activity and BMI in men and women in rural and urban Palestine25.
Sternfeld et al (2004) showed that any reduction in daily physical activity is associated with weight gain62.
Kaphingst et al (2007) found a significant difference in physical activity of the normal group and overweight and obese groups40. Studying 28
provinces in Iran, Kelishadi et al (2007) found that the physical activity in overweight and obese men and women was considerably less than normal-weight men and women41.
Hajian et al (2009) reported a negative relationship between physical activity and obesity; they believed that low level of physical activity is one of the most important causes of general and abdominal obesity in men and women in northern Iran35.
Studying 1500 men and women living in Yazd Province, Motefaker et al (2008) found that the level of physical activity is generally low. They observed a negative relationship between physical activity and obesity, but no significant difference in level of physical activity of obese and overweight groups and normal group19.
Schroder et al (2004) found that people following the Mediterranean (healthy) dietary had more physical activity and were more active61.
Comparing the dietary patterns of active and inactive people, Deshmukh-Taskar et al (2007) found that active people had healthier dietary pattern than inactive people. Active people tended to eat more fruit, fruit juice, fish, vegetable oils, low-fat foods and vegetables than inactive individuals49.
The difference between findings of this study and the current study can be due to the fact
that percentage of sedentary people is more than those with moderate and high physical activity in Bandar Anzali; this is why the relationship between physical activity and dietary habits is not significant.
In the present study, there was no significant relationship between physical activity and public health score. Studying emotional and mental health of elderly women in Australia, Lee (2002) examined the effect of physical activity on mental health and the relevant variables in three groups of young (18-23 years), middle-aged (45-50 years) and elderly (70-75 years). The results show that women of all three groups had higher levels of mental health and there was a direct relationship between physical activity and mental health46.
McDowell (2003) examined the relationship between physical activity and its effect on mental health. The subjects were divided into two groups: active and inactive. The study reported an inverse relationship between depression and physical activity. However, no relationship was found between sports and other psychologically healthy subscales31. Aarnio et al
(2002) concluded that physically active subjects had better general health and social relations than inactive subjects24.
Examining the relationship between physical activity and general health of elderlies in Tehran, Aslankhani et al (2005) found a positive significant relationship between the level of mental health and the physical activity3. Ebrahimi et al
(2013) found a significant relationship between mental health of athlete students and during of exercise. Mental health status (total indexes) of the students who had regular physical activity was better than students without regular physical activity1. The difference could be due to
differences in population and socioeconomic conditions or methods of assessing physical activity and low levels of active people in the study.
relationship between level of physical activity and marital status, smoking, history of heart diseases (individual-family), dietary habits. The maximum amount of physical activity was related to people with an income of less than 150 thousand Tomans. However, the relationship between physical activity and housing conditions was significant.
Gutierrez et al (1995) showed that physical activity reduced by aging, although this difference was not significant between different age groups38.
Norman et al (2002) showed that physical activity decreased with age. Younger people were more physically active than older people. One reason for the decline in physical activity in older people was reduced energy costs of their physical activity during leisure time. Physical activity also decreased by increasing levels of education. Decline in physical activity by higher levels of education was associated with reduced physical activity of the workplace55.
Aqa’alinejad et al (2006) reported no significant relationship between socioeconomic status and the level of physical activity, but a negative significant relationship between physical activity and economic capital. That is, the level of physical activity reduced by higher economic capital6.
Motefaker et al (2008) reported a negative relationship between the level of physical activity and aging; by aging, the level of physical activity gradually reduced. However, there was no relationship between physical activity and marital status. As they reported, increase in level of education significantly reduced physical activity and people with higher socioeconomic level had lower physical activity. It seems, the lack of sport-welfare facilities is not a factor for the low level of physical activity and the lack of motivation can play a more important role19.
Dias-da-Costa et al (2005) in Brazil showed that levels of physical activity was lower in people with higher socioeconomic level than those with lower socioeconomic level; this can be related to lack of time for physical activity and less access to sports facilities33. The difference can be
due to differences in socioeconomic conditions of the studied groups.
In the present study, the score of dietary habits was better in those with normal weight than
people with overweight and obesity, but this relationship was not significant. Janssen et al (2004) reported no significant relationship between overweight and obesity and dietary habits. Increased BMI was negatively related to consumption of fruits, vegetables and healthy drinks and positively related to consumption of fast foods, chips and sweets44. Togo et al (2001)
reported a negative relationship between obesity and a regime including vegetables, fruit and low-fat foods, and a positive relationship between a regime including meat, sweets, foods high in fat and calories63.
Schroder et al (2004) observed a negative relationship between obesity and Mediterranean diet. People who followed a Mediterranean diet consumed more fruits, vegetables, vegetable oils and fish and tended to use less low-fat foods, processed foods, processed red meat, and sweets. The prevalence of obesity was low in this population61.
Damirchi and Mehrabani (2010) showed a negative significant relationship between obesity and score of dietary habits. Obesity was positively related to high-fat foods, sweets, salt, snack, dessert after a meal. There was also a negative correlation between obesity and nutritional care13.
The difference may be due to differences socio-economic conditions of the studied populations.
monthly income of less than 150 Tomans. Sarshar and Khajavi (2008) reported a significant relationship between the prevalence of obesity and education and marital status. Obesity is more prevalent in illiterate women. The overweight and obesity was higher in married women than in single people and severe obesity was observed only in married women15.
Gutierrez et al (1995) investigated the relationship between demographic and socioeconomic factors and obesity; they found a significant relationship between age and obesity. This means that obesity increased by aging. One reason cited for this is reduced amount of physical activity associated with aging38.
Ma et al (2003) found a significant relationship between the risk of obesity and higher education. In contrast, no significant relationship was observed between incidence of obesity and age, sex, smoking, race and culture48.
Erem et al (2004) studying 5016 Turkish men and women aged 20 years observed that obesity is positively correlated with age in both sexes. Increase in obesity can be due to reduced physical activity in men and women. There was a positive relationship between obesity and marital status and smoking cessation and a negative relationship between physical activity, smoking, level of education and family income. By rising incomes, the ability of people to purchase high-calorie foods will increase; this cause energy imbalance resulting in increased obesity. Moreover, those with a family history of obesity, diabetes and hypertension had higher prevalence of obesity than those without a history34.
Kilicarslan et al (2006) reported that the prevalence of obesity was higher in married people than in singles; they also reported a significant negative relationship between obesity and education. The prevalence of obesity was higher in people with a family history of obesity than in those without history42.
Panagiotakos et al (2006) observed that obese and overweight people had lower education and physical activity than those with normal weight and they were older. They also found no relationship between smoking and income and obesity and overweight in both sexes9.
Mazloomzade et al (2007) reported a significant relationship between obesity and
gender, age, education and marital status. So that, the prevalence of obesity was three times higher in women than in men and it increased by aging in both sexes. The prevalence of obesity was higher in people with lower education and married people20.
Studying the prevalence of obesity in women aged 18-25 in Tehran, Barzin et al (2010) observed a significant negative correlation between BMI and education8.
Assessing overweight and obesity in men and women aged 25-64 years in Khorramabad, Najafi et al (2009) found a direct relationship between prevalence of obesity and aging and marital status and an inverse relationship between prevalence of obesity and education23. Damirchi
and Mehrabani (2010) reported the prevalence of obesity increased with age, decreased physical activity, low level of education, increased revenues, history of cardiovascular diseases and higher number of family members13.
In a study by Vaghari et al (2012) in Golestan province, a negative significant relationship was found between overweight and obesity and the level of education. So that, illiterate people were exposed to double risk of obesity that those with a college education. The urbanization along with economic recovery can lead to weight gain because of sedentary4.
REFERENCES
1. Aarnio M.W, Winter T, Kujala U and J Kaprio, Associations of health related behavior, social relationship and health status with persistent physical activity and inactivity. British J Sport Med, 2002; 36: 360-364.
2. Abdul-Rahim HF, Holmboe-Ottesen G, Stene LCM, Husseini A, Giacaman R, Jervell J and Bjertness E, obesity in a rural and an urban Palestinian West Bank Population, International Journal of Obesity, 2003; 27: 140-146. 3. Adami GF and Cordera R, Association of body
mass index, physical activity and eating pattern in adult men, Nutr Res, 2003; 23: 579-583. 4. Ayatollahi S.M.T and Ghoreshizadeh Z,
Prevalence of obesity and overweight among adults in Iran, Obesity reviews, 2010; 11: 335-337.
2001-2002: Tehran lipid and glucose study, Ann Nutr Metab, 2005; 49: 3-8.
6. Baecke j, Burema j, Ashort questionnaire for the measurement of habitual physical activity in epidemiological studies, Am j clin nutr, 1982;
36: 936-942.
7. Bouchard C, Physical activity and obesity, Human Kenetics, 2000.
8. Mc Dowell K, Kerick S.E, Sanata Maria D.L,Aging, physical activity, and cognitive processing: An Examination of P300, 2003; 597-606.
9. Desperes J.P, Lemieux I, Dagenas G.R, Cantin B, HDL-Cholesterols a mark of coronary heart disease risk, the Quebec cardiovascular study, J Atherosclerosis, 2000; 153: 263-272.
10. Dias-da-Costa J.S, Curi Hallal P, Kingdom Wells J.C, Daltoe T, Costa Fuchs S, Menezes A M.B, Anselmo Olinto M.T, Epidemiology of leisure-time physical activity: a population-based study in southern Brazil, Cad Saude Publica, 2005;
21(1): 275-282.
11. Erem C, Arsalan C, Hacihasanoglu A, Deger O, Topbas M, Ukinc K, Ersçz Ho, and Telatar, Prevalence of obesity and associated risk factors in a Turkish population (Trabzon city, turkey), Obesity Research, 2004; 12: 1117-1127. 12. Hajian-Tilaki K.O, Heidari B, Prevalence of
obesity, central obesity and the associated factors in urban population aged 20-70 years, in the north of Iran: a population-based study and regression approach, International Association for the Study of Obesity. Obesity reviews, 2006;
8: 3-10.
13. Harrison T, Harrison’s principles of internal medicine endocrine. Metabolism and Nutrition. 13th ed. USA: McGraw Hill, 2001.
14. Hedley AA, Ogden CL, Johnson CL, Carroll MD, Curtin LR, Flegal KM, Prevalence of overweight and obesity among US children, adolescents, and adults, 1999-2002. JAMA~ 2004; 291(23): 2847-50.
15. Gutierrez-Fisac J.L, Guallar-Castillon P, Diez-Ganan L, Lopez Garcia E, Banegas Banegas J.R, Rodriguez Artalejo F, Work-related physical activity is not associated with body mass index and obesity, Obes Res, 2002; 10: 270-276. 16. Deepi B. Waist to hip ratio calculator; Nov 13.
Available From: www.healthstatus.com/ calculate/whr, 2003
17. Kaphingst A.K, Bennett G.G, Sorensen G, Kaphingst M.K, O¹Neil E.A and Mclnnis K, Body mass index, physical activity, and dietary behaviors among members of an urban community fitness center: a questionnaire survey, BMC Public Health, 2007; 7: 181-190.
18. Kelishadi R, Alikhani S, Delavari A, Alaedini F, Safaie A and Hojatzadeh E, Obesity and associated lifestyle behaviours in Iran: findings from the First National Non-Communicable Disease Risk Factor Surveillance Survey, Public Health Nutrition, 2007; 11: 246-251.
19. Kilicarslan A, Isildak M, Guven G.S, Gul O.S, Tannover M.D, Duman A.E, Saracbasi O and Sozen Tumay, Demographic, Socioeconomic and Educational Aspects of Obesity in an Adult Population, Journal of the National Medical Association, 2006; 98: 1313-1317.
20. Kelishadi R, Childhood overweight, obesity, and the metabolic syndrome in developing countries. Epidemiol Rev~ 2007; 29: 62-76.
21. Janssen I, Katzmarzyk P.T, Boyce W.F, King M.A and Pickett W, Overweight and Obesity in Canadian Adolescents and their Associations with Dietary Habits and Physical Activity Patterns, Journal of Adolescent Health, 2004;
35: 360-367.
22. Lahti- Koski M, Pietinen P, Heliçvaara M and Vartiainen E, Associations of body mass index and obesity with physical activity, food choices, alcohol intake, and smoking in the 1982-1997 FINRISK Studies, Am J Clin Nutr, 2002; 75: 809-817.
23. Lee C, Russel A, Effects of physical activity on emotional well-being among older Astralian women: cross- sectional and longitudinal analyses, J Psychoosom Res, 2003; 34: 629-636. 24. Levy MN, Stanton BA, Berne and Levy principles of physiology. 4th ed. St.Louis: Mosby, 2006.
25. Ma Y, Bertone ER, Stanek EJ, Reed GW, Hebert JR, Cohen NL, Association between eating patterns and obesity in a free-living US adult population, Am J Epidemiol, 2003; 158: 85-92. 26. Deshmukh-Taskar P, Nicklas T.A, Yang S.J and Berenson G.S, Does food group consumption vary by differences in socioeconomic, demographic, and lifestyle factors in young adults? The Bogalusa Heart Study, Journal of American Dietetic Association, 2007; 107(2): 223-234.
27. Malekzadeh R, Mohamadnejad M, Merat SH, Pourshams A, Etemadi A, Obesity pandemic: an Iranian perspective. Arch Iran Med,2005; 8 :1-7.
28. Montazeri A, Harirchi AM, Shariati M, et al, the 12-item general health questionnaire (GHQ-12): translation and validation study of the Iranian version. Health and Quality of Life Outcomes, 2003; 1: 66-73.
the identification, evaluation, and treatment of overweight and obesity in adults, NIH Publication, 2011.
30. Nurcan A, Ercan G, Isil G, Selim S, Kilic S, Prevalence of obesity, abdominal obesity and the associated factors among a group of Turkish adults, Pak J Med Sci, 2010; 26: 21-25. 31. Esmaillzadeh A, Mirmiran P, Azizi F, Evaluation
of waist circumference to predict cardiovascular risk factors in an overweight Tehranian population: findings from Tehran Lipid and Glucose Study. Int J Vitam Nutr Res; 2005; 75: 347-56.
32. Norman A, Bellocco R, Vaida F and Wolk A, Total physical activity in relation to age, body mass, health and other factors in a cohort of Swedish men, International Journal of Obesity, 2002; 26: 670-675.
33. Ogden CL, Carroll MD, Curtin LR, Mc Dowell MA, Tabak CJ, Flegal KM, Prevalence of overweight and obesity in the United States, 1999-2004. JAMA 2006; 295(13): 1549-55. 34. Popkin BM, The nutrition transition and obesity
in the developing world. J Nutr~ 2001; 131(3): 871S-3S.
35. Popkin BM, Gordon-Larsen P, The nutrition transition: worldwide obesity dynamics and their determinants. Int J Obes Relat Metab Disord~ 2004; 28(3): S2-S9.
36. Park S.Y, Murphy S.P, Wilkens L.R, Yamamoto J.F, Sharma S, Hankin J.H, Henderson B.E And Kolonel L.N, Dietary patterns using the food guide pyramid groups are associated with sociodemographic and lifestyle factors: The Multiethnic Cohort Study, J Nutr 2005; 135: 843-849.
37. Okosun I.S, Choi S, Matamoros T and Dever A, Obesity Is Associated with Reduced Self-Rated General Health Status: Evidence from a Representative Sample of White, Black, and Hispanic Americans, Preventive Medicine, 2001;
32: 429-436.
38. Schroder H, Marrugat J, Vila J, Covas M.I And Elosua R, Adherence to the Traditional Mediterranean Diet Is Inversely Associated with Body Mass Index and Obesity in a Spanish Population, American Society for Nutritional Sciences, 2004; 133: 3355-3361.
39. Sternfeld B, Wang H, Quesenberry P.C, Abrams B, Everson-Rose S.A, Greendale G.A, Matthews K.A, Torrens J.A and Sowers M.F, Physical Activity and Changes in Weight and Waist Circumference in Midlife Women: Findings from the Study of Women –s Health Across the Nation, Am J Epidemiol, 2004; 160: 912-922. 40. Togo P, Osler M, Sorensen T.I.A, Heitmann B.L,
Food intake patterns and body mass index in observational studies, International Journal of Obesity, 2001; 25: 1741-1751.
41. Veghari G.R, Sedaghat M, Joshaghani H.R, Hoseini A, Niknezhad F, Angizeh A.H, Tazike, Moharloei P, The prevalence of obesity and its related risk factor in the North of Iran in 2006, Journal of Research in Health Sciences 2010;
10(2): 112-116.
42. World Health Organization. Obesity: Preventing and managing the global epidemic, Report of a WHO consultation. World Health Organ Tech Rep Ser, 2000; 894:1-253.
43. Abdollahi, A., Behnampour, N., Vaghari, G. & Bazrafshan, H., The relationship between obesity and age, gender and education in urban population of Golestan Province. Endocrinology, 2011; 12: 276-282.
44. Akhavantabib , A. et al., Prevalence of obesity in central parts of Iran. journal of Qazvin University of Medical Sciences, 2004; 26: 27-35.
45. Amiriparsa , T., Khademolshariat, M., Hamedinia, M. & Azarniveh, M., The factors effective on obesity and overweight in women aged 30-50 living in Sabzevar. Iran’s Epidemology, 2014; 9: 75-83.
46. Aqa’alinejad , H., Qarakhanloo, R., Farzad, B. & Bayani, M., Norms of body size, body composition and prevalence of overweight and obesity in urban populations of Iran. journal of Shahrekord University of medical sciences, 2013;
15: 18-27.
47. Aqa’alinejad , H., Rajabi, H., Sadiq-sarvestani, R. & Amirzade, F., The relationship between physical activity, fitness and Body Composition and socioeconomic status of female students aged 15-17 in Tehran. Science of Movement, 2006;
6: 1-14.
48. Aslankhani , M., Ebrahim, K. & Heydari, M., The relationship between physical activity and mental health of elderlies in Tehran. Vitality and sport, 2000; 31: 2-13.
49. Azadbakht , L., Mirmiran, P. & Azizi, F., prevalence and factors of obesity in adults living in Tehran. journal of Endocrinology, 2004; 4(5): 379-387.
50. Barzin , M., Mirmiran, P., Afghan, M. & Azizi, F., Prevalence of obesity, abdominal obesity, diet and physical activity in female clients aged 18-25 to pre-marriage consulting centers. journal of shahid beheshti university of medical sciences, 2010; 68: 59-65.
factors in adult men. Olympics, 2010; 47: 87-103.
53. Ebrahimi, H. et al., Subscales of mental health and its relationship with athletic histories of Adolescents. s.l., Tabriz University of Medical Sciences, 2013.
54. Hamedinia, M. & Rezaei, S., The relationship between physical activity and body fat with some cardiovascular risk factors in Sabzevar Tarbiat Moallem University faculty. Asrar, Issue 2005; 11: 34-40.
55. Heydari, B. & Hajian, K., The weight and age at risk for knee osteoarthritis. Qazvin univeristy of medical sciences, 2004; 4(29): 10-15. 56. Mazloomzade , S., Mosavi, A. & Dinmohamadi,
H., Epidemology of overweight and obesity in Zanjan. zanjan university of medical sciences, 2007; 57: 56-64.
57. Mirmiran, P. & Azizi, F., The relationship between eduation and marital status and food intakes, obesity and other cardiovascular risk
factors. 2003; 26: 270-280.
58. Motefaker , M. et al., Epidemology of physical activity in Yazd. Tehran university of medical sciences, 2008; 81: 64-77.
59. Najafi, S., Momen-nasab, M. & Tarahi, M. J., prevalence of overweight and obesity in 25-64 year-old population of Khoramabad. Diabetes and Lipid, 2009; 8: 167-176.
60. Rahmaninia, F. & Hojati, Z., Obesity and weight control. s.l.:Varaste, 2009.
61. Sadr Bafghi , M. et al., Prevalence of abdominal obesity and its relationship with other risk factors of cardiovascular diseases in Yazd. journal of mashhad university of medical sciences, 2009; 99: 6-61.
62. Sarshar, N. & Khajavi, J., Prevalence of obesity in women aged 15-65 in Gonabad. horizon of knowledge, 2008; 12: 1-7.