Themed Section : Engineering and Technology
Non-Linear Static Analysis of Composite Bridge
Tenmey Gehlot*1, Gajendra Verma2
*1Civil Engineering Department, , Indore, Madhya Pradesh, India
2 Civil Engineering Departments, University/Institute/Company, Indore, Madhya Pradesh, India
ABSTRACT
In a few years there are seismic hazard like bhuj earthquake in Gujarat and uttarkashi earthquake in uttrakand. So India focusing to design the earthquake resisting structure therefore static /dynamic non-linear analysis is important to find out the performance level of structure. This paper discusses the pushover analysis of composite bridge structure also composite structures are generally used in construction field due to its economical and efficiency solution. The bridge modelling is analysed by using SAP 2000 vs.16 software. Static non-linear analysis is performed on a model to find out the response of the composite bridge under the action of gravity load.
Keywords : Seismic Hazard, Non-Linear, Pushover Analysis, Composite, Bridge.
I.
INTRODUCTIONThe structure analysis of the composite bridge containing two steps the first step of this analysis is the bridge modelling .For the longitudinal global bending behaviour only structure steel with half of a reinforced concrete slab is modelled. The structure analysis is a first order elastic linear one. The analysis of the elastic mechanical properties for each cross section required.
The effective width of the flanges (shear leg effect).
The different modular ratio between concrete and steel (creep effect).
A. SHEAR LEG EFFECT
For a composite structure bridge it mainly affects the concrete slab (upper flange) where the actual width to span ratio is not negligible. The shear leg effect should theoretically also be checked for the bottom steel flange but usually no reduction occurs.
B. SECTION ANALYSIS
Bottom steel flange
The equivalent span lengths of the bridge are 0.85L, L for the side spans and the Abutments, 0.7L, L for the inner span, and for the support regions around the piers.
Upper concrete slab
In a given cross-section of one of the main girder, the effective width of the concrete slab is the sum of 3 terms beff=bo+β1be1+β2be2
Where,
bo= centre-to-centre distance between the outside stud rows.
be1=min (L/8, b) where L is the equivalent span length for the considered cross-section and b is the actual geometric width of the slab associated to the main girder
After the determination of the effective width of the concrete slab and the modular ratios for the different elementary load cases, it becomes possible to calculate the elastic mechanical properties of each composite cross-section along the bridge girder. Following the construction phases these properties have to be given to the bar elements modelling the bridge for getting the internal forces and moments and the stress distribution by applying the general rules of the Strength of Materials. Notations are as follows:
A area of the structural steel part of the composite cross-section
A area of the reinforcing steel of the composite cross-section (within the effective width for shear lag)
A area of the concrete part of the composite cross-section (within the effective width for shear lag) n modular ratio
I second moment of area of the structural steel part of the composite cross-section
I second moment of area of the concrete part of the composite cross-section
Thermal shrinkage
The thermal shrinkage produced by the difference in temperature ▲T between structural steel and concrete when concreting. The recommended value is ▲T = 20°C thus giving a strain e =α▲T which is relatively high. In fact, on-site measurements show that this temperature difference seems correct but a part of the Corresponding thermal shrinkage applies to a structure which has not yet a composite behaviour It should normally be used only to determine the cracked zones of the global analysis and to control the crack width in the concrete slab.
Figure stress-strain distribution in composite section
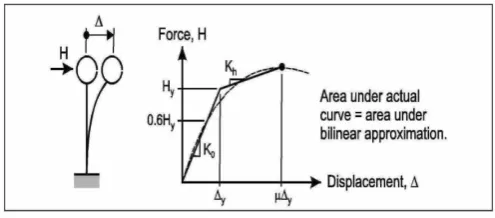
NON LINEAR STATIC ANALYSIS (PUSHOVER METHOD)
Inelastic analysis procedures for the seismic evaluation and design of upgrades of structure as well as design of new construction. The generic process of inelastic analysis is similar to conventional linear procedure in that the engineer develops a model of the structure in which is then subjected to a representation of the anticipated seismic ground motion. The coefficient method is fundamentally a displacement modification procedure that is presented in FEMA 356.
The coefficient method of displacement modification from FEMA 356:-
The coefficient method is the primary non-linear static procedure presented in FEMA 356. This approach modifies the linear elastic response of the equivalent SDOF system.
The peak elastic spectral displacement is directly related to the spectral acceleration by the relation. Sd= (Teff) 2/4π2xSa
Where,
Sd= spectral displacement. Sa=spectral acceleration.
Teff=effective time period depend upon the relative stiffness of structure.
The NSP may be used for any structure and any Rehabilitation Objective, with the following exceptions and limitations.
• The NSP should not be used for structures in which higher mode effects are significant, unless an LDP evaluation is also performed. To determine if higher modes are significant, a modal response spectrum analysis should be performed for the structure using sufficient modes to capture 90% mass participation, and a second response spectrum analysis should be performed considering only the first mode participation. Higher mode effects should be considered significant if the shear in any story calculated from the modal analysis considering all modes required obtaining 90% mass participation exceeds 130% of the corresponding story shear resulting from the analysis considering only the first mode response. When an LDP is performed to supplement an NSP for a structure with significant higher mode effects, the acceptance criteria values for deformation-controlled actions (m values).
Analytical Modelling
The composite bridge structure was assumed to be fixed at the bottom. The slab, beam and Column of Bridge structured are modelled with the help of providing diaphragm. Which means the beam at the same level act as rigid and the displaced structure of the structure is same at same level. The composite and RCC (reinforced cement concrete) bridge design in sap2000 and hinges properties define in beam and column as per American code design as a ductile
material which carries flexural load in beam and axial, flexural load in column only.
Two different modelling are considered as follows. Model 1 – composite bridge model;
Model 2 – RCC (reinforced cement concrete) bridge model;
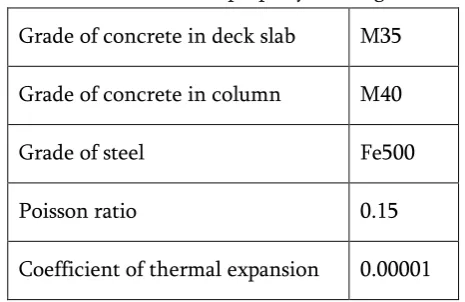
Table1. Material property of bridge
Grade of concrete in deck slab M35
Grade of concrete in column M40
Grade of steel Fe500
Poisson ratio 0.15
Coefficient of thermal expansion 0.00001
Both modelling of bridge structure are design as a road bridge with three spans (70m+80m+70m). the continuous composite deck is made up of four steel girder with I cross section and a concrete slab is modelled in model 1 and concrete slab with four reinforced concrete rectangular beam is designed in model 2 with total width 10m without footpath is design according to IRC. The circular piers have a diameter 1.5m is used. The bottom end of the column is provided with fixed base.
Figure Geometric plan of bridge.
Figure Hinge formation in model 2
II.
RESULTSFrom the output of SAP2000vs.2016, different results obtained are prepared by graphs and is compared to find out structural behaviour against lateral load. The effect of composite bridge against RCC (reinforced cement concrete) pushover results by two different method ATC-40 and FEMA-356. With more data against story displacement and story shear is studied.
1. Pushover Result
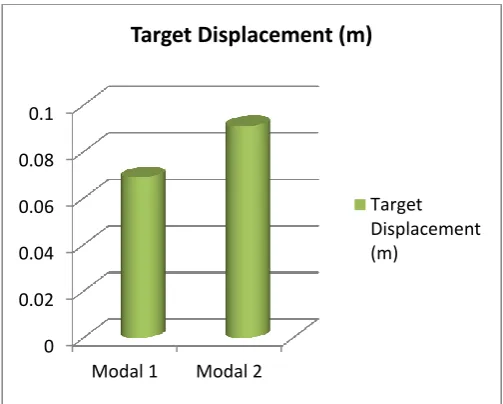
Table Target Shear and displacement from pushover
curve.
Modal Target Shear
(KN)
Target Displacement (m)
Modal 1 2673.669 0.069
Modal 2 4313.667 0.091
Figure Target shear from FEMA-356 method
Figure Target displacement from FEMA-356 method
2. Base Shears
The analysis done on both model by using zone factor 0.36 and find out base shear using IS code 1893-2002 and load participation given in IS code 1893-1984.
Table seismic force by IS 1893-2002
Model Base shear by IS 1893-2002(KN)
Model 1 1768.547
Model 2 2666.954
0 0.02 0.04 0.06 0.08 0.1
Modal 1 Modal 2
Target shear (KN)
Target shear (KN)
0 0.02 0.04 0.06 0.08 0.1
Modal 1 Modal 2
Target Displacement (m)
Figure Base shear from IS 1893-2002
III.
CONCLUSIONThe pushover analysis is done on a composite and RCC (reinforced cement concrete) bridge using analytical mathematical modeling in sap2000 vs.16. A single direction pushover analysis prediction approach for target displacement and shear response is proposed. The following conclusions are made as follows.
Base shear calculated from analysis done by IS code on both the modeled shows that composite bridge structure developed only 66.31% as compare to RCC bridge model because reduce in seismic weight of composite bridge due to using of I section channel as compare to concrete beam in model 2 also the larger stiffness of steel section as compare to the reinforced concrete beam.
Target displacement calculated from model analysis find that model 1 having 24.17% lesser displacement compare to the model 2 because composite structure bridge having larger lateral stiffness compare to the RCC bridge structure.
IV.
REFERENCES[1] BS: 5400: Part 10: “Steel, concrete and composite Bridges-Part10: Code of practice
for fatigue”, British Standards Institution, 1980.
[2] Bridge Rules (in SI units), Ministry of Railways, Govt. of India., Revised 1964. [3] IRC-22: Standard specifications and code of
road bridges, Section-VI, Composite construction, 1986.
[4] Spanscone, E., El-Tawil, S.: Nonlinear Analysis of Steel-Concrete Composite Structures: State of the Art, ASCE J of Structural Engineering, February 2004. pp. 159-166.
[5] Wang. Dongsheng. Di. Tong. Guo. Mingzhu. 2000. Estimated seismic vulnerability of bridges by push-over method. World Information on Earthquake Engineering. 16(2): 47-519.
[6] Wilson. E. L. Suharwardy. A. Habibullah. 1995. A clarification of the orthogonal effects in a tree-dimensional seismic analysis. Earthquake Spectra. 11 (4): 659-666.
[7] Yang. Pu. Li. Yingming. Wang. Yayong. 2000. Improved method of structure pushover analysis. Journal of Building Structures, 2l (1), 44-51.
[8] Kosa, K., Yamaguchi, E., Inokuma, Y., and Tasaki: Investigation and analysis of Bridges and other structures damaged during the Mid Niigata Prefecture Earthquake in2004, Proceedings of the 8th Symposium on Ductility Design Method for Bridges, pp.35-40, 2005.
[9] Suzuki, Tanaka, “A propose of 3-span continuous hybrid cable stayed bridge”, Proceeding of the 56th Annual Conf. of JSCE,
Ⅰ-A218, 2000.9., pp436-437.
[10] Suzuki, Tsuchida, “Structural Characteristic and Economic Superiority of Hybrid Cable Stayed Bridge with Two-Edge Girders”, Journal of Constructional Steel Vol.8, Nov.2000, Japanese society of Steel Construction 2000.11., pp587-594
0 500 1000 1500 2000 2500 3000
Model 1 Model 2
Base Shear
[11] Otsuka, Suzuki, “Seismic Analysis of cable-stayed bridge with 2 girders with high pier”, Proceedings of the 56thannual Conf. of JSCE,
Ⅰ-A299, 2001.10., pp598-599
[12] Y.SUZUKI, H.Otsuka, A.Otsuka, “Investigation of earthquake resistance and cost effect on hybrid cable-stayed bridge with 2-edge girders”, Earthquake Resistance Engineering Structure, 2001.9, pp651-660 [13] Otsuka, Suzuki ,”A proposal of Improvement
on Earthquake-Resistant for Composite Cable-Stayed Bridge with 2 Edge Girders and PC Ramen Bridge” ,Journal of Structural Engineering ,JSCE Vol.49A ,2003.3.