http://www.ijcmph.com pISSN 2394-6032 | eISSN 2394-6040
Original Research Article
Dietary assessment of the ‘sweet enough program’ for primary school
students in Chiang Mai, Thailand
Rakchanok Noochpoung, Shyamkumar Sriram*
INTRODUCTION
Healthy eating patterns in childhood and adolescence promote optimal childhood health, growth, and intellectual development; prevent immediate health problems, such as iron deficiency anemia, obesity, eating disorders, and tooth decay; and may prevent long-term health problems, such as coronary heart disease, cancer, and stroke.1 Steyn reviewed the scientific evidence that suggests that sugar is a risk factor in developing various
illnesses. The patterns of sugar consumption and the sugar-related conditions experienced by adults and children were examined.2 Sugars are an integral part of decay etiology.3 Snacking has gained an increasing role as a risk indicator for decay development in children.4 Low-nutrient and energy dense foods are characterized by a high content of added sugar, but several modern snack products such as chips (crisps), popcorn and shrimp crackers, while not sweet, are still potentially cariogenic due to their extensively hydrolyzed starch. In 2003, an
ABSTRACT
Background: Since 2007, Chiang Mai Public Health Office has conducted a campaign called “Chiang Mai On Wan” to decrease sugar consumption. The aim of this study was to evaluate the dietary patterns of students in schools participating in the program.
Methods: The cross-sectional data were obtained from primary school children during November 2010 to February 2011. A total of 240 children were selected from Prathom 5 students (US Grade 5) in 12 schools. Sweet Enough Program (SEP) schools are those which implement public nutrition policies and supportive environments according to the Ottawa Charter, including no candy, no high-risk decay food or drink, and campaigns to reduce sugar consumption. Dietary patterns were collected using 7-day meal books in which each student recorded individual consumption.
Results: Students in the SEP were found to have a much lower sugar intake than those in non-SEP schools. All students consumed candy, jelly and sweet snacks but the percentages of candy, jelly, and sweet snacks for SEP students were 1.7%, 3.4%, and 11.8%, respectively, while non-SEP students‟ percentages were 26.4%, 11.6%, and 37.2%, respectively. There were significant differences between program school students and non-program school students with regards to candy (p<0.001), jelly (p=0.043), sweet crackers (p<0.001), biscuit (p<0.001), and chips (p<0.001).
Conclusions: The success of this program is highlighted by the nutritional changes among the students. This was achieved by creating public health policies and supportive environments, as set out in the Ottawa Charter strategy.
Keywords: Dietary assessment, Sweet enough program, Primary school student
Department of Health Services Policy and Management, University of South Carolina, Columbia, South Carolina, USA
Received: 24 April 2018
Revised: 30 May 2018
Accepted: 31 May 2018
*Correspondence:
Dr. Shyamkumar Sriram,
E-mail: [email protected]
Copyright: © the author(s), publisher and licensee Medip Academy. This is an open-access article distributed under the terms of the Creative Commons Attribution Non-Commercial License, which permits unrestricted non-commercial use, distribution, and reproduction in any medium, provided the original work is properly cited.
expert panel of the World Health Organization (WHO) has identified the association between tooth decay and excessive sugar consumption and the strength of evidence linking dietary factors to dental cavity.5
The Thai oral health national survey of 2007 reported that 56.87% of children aged 12 years old had decay. These Children have a 1.55 according to the decay missing filling teeth index (dmft).6 A Chiang Mai survey in 2008 showed the prevalence of decay in the same age group as 42.8% and a dmft of 1.9.7 Since schools are an important food source for children, dental health prevention and promotion have been performed in schools.5 However, health promotion cannot be compartmentalized to specific parts of the body. Dental health promotion should be fully integrated into broadly based health-promoting strategies and should be supplemented with more disease-specific policies.8
Since 2007, the Dental Department of the Chiang Mai Public Health Office has conducted a campaign to decrease sugar consumption called “Chiang Mai On Wan” in Chiang Mai (Mae Taeng, Hang Dong and Muang Districts). “Chiang Mai On Wan” is a provincial program of the „Sweet Enough Network‟ that was initiated in 2003 and supported by Thai Health, the non-profit organization for Health promotion and prevention program in Thailand. The „Sweet Enough Program‟ emphasizes four goals which follow the Ottawa Charter. These goals are: creating public health policies, creating supportive environments, strengthening community action, and developing personal skills.9 According to the Ottawa Charter, health promotion is the process of enabling people to increase control over, and improve their health. Health is a positive concept emphasizing social and personal resources, as well as physical capacities. Therefore, health promotion is not just the responsibility of the health sector, but ultimately health professionals want to empower and educate individuals so they may take responsibility for their individual healthy lifestyles and well-being. Chiang Mai health-promotion teams employ the same strategies as the Network and conform to those of Thai Health.10
The aim of this study was to evaluate the dietary patterns of students in schools that are in the Sweet Enough Program. The results generated from this study could lead to the improvement and expansion of these programs for school children in the Chiang Mai area.
METHODS
This study was a cross sectional study conducted using data from 11-year-old primary school children from November 2010 to February 2011. A total of 240 children were selected from Prathom 5 (US Grade 5) students in 12 schools in 3 districts (Mae Taeng, Hang Dong and Muang) in Chiang Mai Province. We collected the 7 days dietary record of the Grade 5 students to compare sugar
consumption between the students who participated and not participated in the Sweet Enough Program.
Inclusion criteria
Dietary record from all Grade 5 students who study in the selected schools. The non-Sweet Enough Program School was chosen to compare with the Sweet Enough Program School which has similar environment and geographic characteristics. All of the student‟s dietary record were reported by students who were oriented to the guideline before recording their meals.
Exclusion criteria
Students having uncompleted 7 days dietary recording. The students were divided into two groups, the first group from schools that had Sweet Enough Program activities (as defined in Table 1), and another group from schools that did not conduct Sweet Enough Program activities. Dietary patterns were collected using 7-day meal books in which each students recorded individual consumption. The directions and guidelines for recording food consumption data were explained by a dentist from the Chiang Mai Public Health Office who also ran the Sweet Enough Program. Records were collected by the teacher 7 days later.
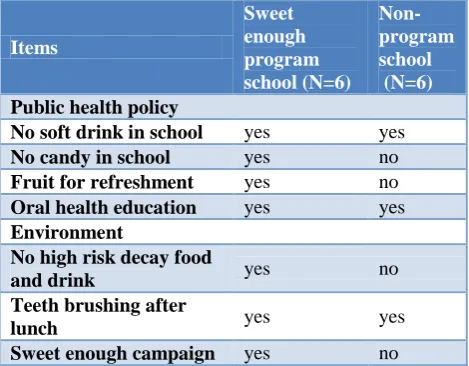
Table 1: Policy and environment in sweet enough program schools.
Items
Sweet enough program school (N=6)
Non-program school (N=6)
Public health policy
No soft drink in school yes yes
No candy in school yes no
Fruit for refreshment yes no
Oral health education yes yes
Environment
No high risk decay food
and drink yes no
Teeth brushing after
lunch yes yes
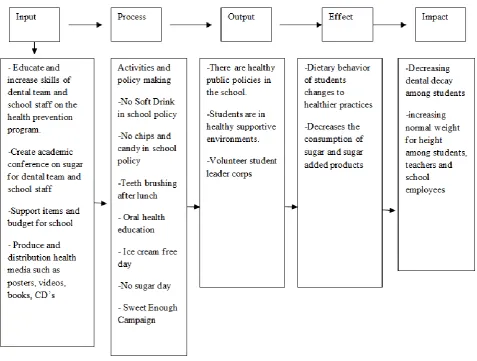
was conducted in 3 districts by focusing on creating public health policy and a supportive environment following Ottawa Charter strategies. This study aims to assess the achievement of the program by showing its
effect on the dietary behavior of students by changing to healthier practices and decreasing the consumption of sugar and low-nutrient, energy dense products.
Figure 1: The conceptual framework of program assessment.
RESULTS
Dietary data was collected from 11 year old students studying in Prathom 5 (US Grade 5) in the Sweet Enough Program Schools (n=3) and Non-Program Schools (n=3). A total of 240 subjects participated in the study from schools in Mae Taeng, Hang Dong and Muang Districts of Chiang Mai. Of these, 45% were male and 55% were female students (Table 2). While both Sweet Enough Program Schools and Non-Program Schools have policies and supportive environment including no soft drink in school, teeth brushing after lunch and oral health education. Some policies and supportive environments including no candy in school, fruit for refreshment, no high risk decay food and drink and the Sweet Enough Campaign were only in the program schools (Table 1).
Table 2: General information regarding location and gender of participants.
Character
Program School Group N=119
Non-Program School Group N=121
Total N=240
Number (%) Number (%) Number (%)
District
Mae Taeng 41 34.5 41 33.9 82 34.2
Hang Dong 34 28.6 25 20.7 59 24.6
Muang 44 37.0 55 45.5 99 41.3
Gender
Male 55 46.2 53 43.8 108 45.0
Female 64 53.8 68 56.2 122 55.0
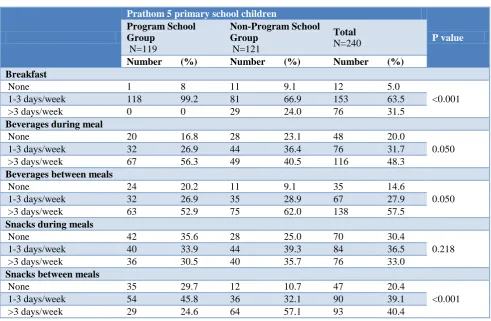
Table 3: Dietary patterns by duration among students.
Prathom 5 primary school children
P value
Program School Group
N=119
Non-Program School Group
N=121
Total
N=240
Number (%) Number (%) Number (%)
Breakfast
None 1 8 11 9.1 12 5.0
<0.001 1-3 days/week 118 99.2 81 66.9 153 63.5
>3 days/week 0 0 29 24.0 76 31.5
Beverages during meal
None 20 16.8 28 23.1 48 20.0
0.050 1-3 days/week 32 26.9 44 36.4 76 31.7
>3 days/week 67 56.3 49 40.5 116 48.3
Beverages between meals
None 24 20.2 11 9.1 35 14.6
0.050 1-3 days/week 32 26.9 35 28.9 67 27.9
>3 days/week 63 52.9 75 62.0 138 57.5
Snacks during meals
None 42 35.6 28 25.0 70 30.4
0.218 1-3 days/week 40 33.9 44 39.3 84 36.5
>3 days/week 36 30.5 40 35.7 76 33.0
Snacks between meals
None 35 29.7 12 10.7 47 20.4
<0.001 1-3 days/week 54 45.8 36 32.1 90 39.1
>3 days/week 29 24.6 64 57.1 93 40.4
Table 4: Dietary behavior by frequency among students.
Prathom 5 primary school children
P value
Program School Group
N=119
Non-Program School Group
N=121
Total N=240
Number (%) Number (%) Number (%)
Candy
None 117 98.3 89 73.6 206 85.8
<0.001
1-3 days/week 0 0 20 16.5 20 8.3
>3 days/week 2 1.7 12 9.9 14 5.8
Jelly
None 115 96.6 107 88.4 222 88.4
0.043
1-3 days/week 4 3.4 12 9.9 16 6.7
Prathom 5 primary school children
P value
Program School Group
N=119
Non-Program School Group
N=121
Total N=240
Number (%) Number (%) Number (%)
Sweet crackers
None 105 88.2 76 62.8 181 75.4
<0.001 1-3 days/week 12 10.1 38 31.4 50 20.8
>3 days/week 2 1.7 7 5.8 9 3.8
Biscuits
None 64 53.8 104 86.0 168 70
<0.001 1-3 days/week 43 36.1 13 10.7 56 23.3
>3 days/week 12 12 4 3.3 16 6.7
Thai desserts
None 98 82.4 95 78.5 193 80.4
0.453 1-3 days/week 21 17.6 26 21.5 47 19.6
>3 days/week 0 0 0 0 0 0
Chips
None 63 52.9 20 16.5 83 34.6
<0.001 1-3 days/week 39 32.8 51 42.1 90 37.5
>3 days/week 17 14.3 50 41.3 67 27.6
Yogurt
None 93 78.2 92 76 185 77.1
0.262 1-3 days/week 19 16.0 26 21.5 45 18.8
>3 days/week 7 5.9 3 2.5 10 4.2
Ice cream
None 102 85.7 81 66.9 183 76.3
0.003 1-3 days/week 14 11.8 33 27.3 47 19.6
>3 days/week 3 2.5 7 5.8 10 4.2
Fruit
None 75 63 61 50.4 136 56.7
0.118 1-3 days/week 37 31.1 53 43.8 90 37.5
>3 days/week 7 5.9 7 5.8 14 5.8
The snacks that students ate during the 7 days were candy, jelly, sweet crackers, biscuits, Thai desserts, chips, yogurt, ice cream and fruit (Table 4). The frequency was divided into three categories: not eaten; eaten 1-3 days a week; and eaten more than 3 days a week. Students ate chips the most (65.1%). Students in non-program schools ate chips significantly more than students in program schools. When considering high decay risk foods such as candy, jelly and sweet crackers it was found that students in non-program schools ate them significantly more than students in program schools. The percentages of students who ate candy, jelly and sweet crackers were 26.4%, 11.6% and 37.2%, respectively. Students in non-program schools who ate candy, jelly and sweet crackers 1-3 days a week were 16.5%, 9.9% and 31.4% respectively, compared with program school students at 0, 3.4% and 38%, respectively. The study also found that students who ate candy, jelly and sweet crackers more than 3 days a week in non-program schools were 9.9%, 1.7% and 5.8% respectively, compared with program schools at 1.7%, 0, and 1.7%, respectively. Overall, program school students ate dental risk foods significantly less than non-program school students. The same scenario is evident
for Thai desserts, yogurt, and ice cream with students in non-program schools who ate them at 21.5%, 24%, and 33.1%, respectively, and those in program schools at 17.6%, 16.0%, and 11.8%. There was a significant difference between school groups in eating ice cream, but there was no significant difference in eating Thai dessert, yogurt and fruit. An exception was found in the consumption of biscuits. In program schools, the percentage of students eating biscuits 1-3 days a week and more than 3 days a week were 36.1% and 12% respectively compared with non-program school students at 10.7% and 3.3%.
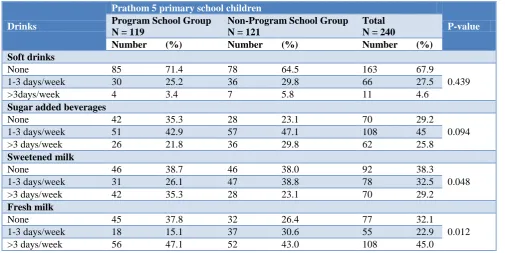
beverages the most, namely 64.7% in program schools and 76.9% in non-program schools. There was also no significant difference between the two groups. Nonetheless, there were significant differences between students who drank sweetened milk and fresh milk in program schools and non-program schools. Students in program schools who drank sweetened milk 1-3 days a
week and more than 3 days a week were 26.1% and 35.3% respectively, compared with non-program school students at 38.8% and 23.1%. In addition, students in program schools who drank fresh milk 1-3 days a week and more than 3 days a week were 15.1% and 47.1% respectively, compared with non-program school students at 30.6% and 43.0%.
Table 5: Drink Behavior by frequency among students.
Drinks
Prathom 5 primary school children
P-value
Program School Group N = 119
Non-Program School Group N = 121
Total N = 240
Number (%) Number (%) Number (%)
Soft drinks
None 85 71.4 78 64.5 163 67.9
0.439
1-3 days/week 30 25.2 36 29.8 66 27.5
>3days/week 4 3.4 7 5.8 11 4.6
Sugar added beverages
None 42 35.3 28 23.1 70 29.2
0.094
1-3 days/week 51 42.9 57 47.1 108 45
>3 days/week 26 21.8 36 29.8 62 25.8
Sweetened milk
None 46 38.7 46 38.0 92 38.3
0.048
1-3 days/week 31 26.1 47 38.8 78 32.5
>3 days/week 42 35.3 28 23.1 70 29.2
Fresh milk
None 45 37.8 32 26.4 77 32.1
0.012
1-3 days/week 18 15.1 37 30.6 55 22.9
>3 days/week 56 47.1 52 43.0 108 45.0
DISCUSSION
Schools have an important role in determining the general health of students, including nutrition, due to the fact that students spend much of their lives at school, and that food and drink are the main sources of energy for these students. School health programs can assist children and adolescents in attaining their full educational potential and good health by providing them with the skills, social support, and environmental reinforcement they need in order to adopt long-term healthy eating behaviors.1 The Education Ministry of Thailand has a lunch menu policy for students.11 Therefore, there is no concern about the lunch meal but there are still problems with students independently buying food and drink.
This study corroborated that students in program schools have more healthy dietary behaviors compared with students in non-program schools. The results of this study were in agreement with those of many similar studies.12-15 A healthy school with a nutritionally supportive environment helps students to adopt and maintain healthy eating behaviors and promotes academic achievement.1,13 Previous research suggests that environmental approaches in conjunction with educational approaches may be the most effective way of bringing about positive change in students‟ eating behaviors.12 Different
epidemiological studies indicated that the optimization of diet and nutrition combined with a healthy life style, can decrease the risk and even lead to amelioration of various non-communicable diseases.1,12,13,16,17 Promising food-based dietary guidelines have been recommended in order to improve nutrition and health.17 Sustainability of environmental change is more likely if a school nutritional policy is adopted. A written policy may help schools maintain healthy food choices during times of transition, such as turnover in school administration or food service personnel and shifts in food preferences among faculties and students. A committee that includes stakeholders and selected decision makers may be best positioned to accomplish this.12
guidance to abandon soft drinks and sugar added beverages in schools is being launched in America, Brazil and South Korea.18,19 In Thailand there is an agreement between the Public Health Ministry and the Education Ministry to have a No Soft Drink policy in schools.11 This policy was in effect in the 3 study area districts.
When considering dietary behavior by type and frequency of students in program and non-program schools, it was found that students in program schools consumed fewer snacks than those in non-program school, so it is doubtful that students in program schools would lower their consumption or change food types. However, it found that students in program schools ate biscuits and drank fresh milk significantly more than students in non-programs schools. This could indicate that students can choose low risk decay food and drink, even though they didn‟t consume healthy food like fruit. Therefore, improvement of the Chiang Mai Sweet Enough Program should focus on developing personal skills and strengthening community action, which are two other strategies of the Sweet Enough Network, which is based on the Ottawa Charter.1,9,18,20
CONCLUSION
According to a concept of program assessment, this study shows the results the program effects. This program, following Ottawa Charter strategies, resulted in nutritional change among students. This study does not examine the relationship between dietary patterns and dental decay, but further investigation of tht relationship is the ultimate goal of the program presented in this study. The impact involving oral health and nutrition, data and study will be reported in the next issue.
ACKNOWLEDGEMENTS
We thank Dr. Dejpitak and Dr. Oungchitpaisan of the Chiang Mai Public Health Office, Thailand and Dr. Chatiketu of the Department of Community Dentistry of the Chiang Mai University for the constant help in the research and write up of the report.
Funding: Funded by the Sweet Enough Network, Thailand
Conflict of interest: None declared
Ethical approval: The study was approved by the Institutional Ethics Committee from Chiang Mai Office of Public Health
REFERENCES
1. Guidelines for school health programs to promote lifelong healthy eating. J Sch Health. 1997;67(1):9-26.
2. Steyn NP, Myburgh NG, Nel JH. Evidence to support a food-based dietary guideline on sugar consumption in South Africa. Bull World Health Org. 2003;81:599-608.
3. Burt BA, Kolker JL, Sandretto AM, Yuan Y, Sohn W, Ismail AI. Dietary patterns related to caries in a low-income adult population. Caries research 2006;6(40):473-80.
4. Johansson I. Snacking habits and caries in young children. Caries Res. 2010;44(5):421-30.
5. Mobley C, Marshall TA, Milgrom P, Coldwell SE. The contribution of dietary factors to dental caries and disparities in caries. Acad Ped. 2009;6(9):410-4. 6. Prasertsom P, Ratanarangsima K. The Thailand
National Oral Survey 6th Report. Dental Health Division, Department of Health, Ministry of Public Health, Thailand; 2007: 42-43.
7. Noochpoung R, Detpitak A. The Chiang Mai Oral Survey 5th Report. Chiang Mai Public Health Office, Chiang Mai, Thailand; 2008: 11-43. 8. Maltz M, Jardim JJ, Alves LS. Health promotion
and dental caries. Braz Oral Res. 2010;2:18-25. 9. World Health Organization. Milestones in health
promotion: Statements from global conferences, 2009. Available at: http://www.who.int/health promotion/milestones/en/. Accessed 10 January 2018.
10. Piyanart C. Team performance indicators for a Thai health-promoting organization: A case study of the sweet enough network. Diss. Chiang Mai: Graduate School, Chiang Mai University. 2011.
11. The Office of the Basic Education Commission. Primary School Lunch Project Procedure: Bangkok Office; 2002: 27-28
12. Davee AM, Blum JE, Devore RL, Beaudoin CM, Kaley LA, Leiter JL, et al. The vending and à la carte policy intervention in Maine public high schools. Prev Chronic Dis. 2005;2:14.
13. Chawannakul M, Otakum S. Outcome evaluation of the Sweet Enough Campaign Project, at Wat Kaw Wang School in Muang District, Rajburee Province. 2008.
14. Kanyarat K, Sheiham A, Srisuphan W, Srisilapanan P. Promoting healthy eating in nursery schoolchildren: a quasi-experimental intervention study. Health Edu J. 2008;67(1):16-30.
15. Chawannakul M, Otakun S. Outcome evaluation of the Sweet Enough Campaign Project: Thailand J Dent Pub Health. 2008;13(1):117-29.
16. Tagliaferro EP, Ambrosano GM, Meneghim MC, Pereira AC. Risk indicators and risk predictors of dental caries in schoolchildren. J Appl Oral Sci. 2008;16(6):408-13.
17. Elmadfa I, Freisling H. Fat Intake, Diet Variety and Health Promotion. Diet diversification and health promotion. 2005;57:1-10.
18. Corinna H. Marketing food to children: the global regulatory environment. World Health Organization, 2004. Available at: http://apps.who.int/iris/handle/ 10665/42937. Accessed 11 February 2018.
20. Briggs M, Safaii S, Beall DL. Position of the American Dietetic Association, Society for Nutrition Education, and American School Food Service Association-Nutrition services: an essential component of comprehensive school health programs. J Am Diet Assoc. 2003;103(4):505-14.