http://www.ijcmph.com pISSN 2394-6032 | eISSN 2394-6040
Original Research Article
Are older drivers getting the information they need from their
health care provider?
Andrea L. Huseth-Zosel*
INTRODUCTION
The population aged 65 or older is expected to progressively increase for several decades and by 2050 will make up one-fifth of the total U.S. population, with the number of older adults continuing to drive expected to increase accordingly.1,2 Drivers aged 65 or older are involved in an inordinate number of motor vehicle crashes resulting in fatalities.3 Age-related declines in cognitive, visual, and physical functioning can heighten an older driver’s crash risk.1,4-6
The projected increase in licensed older adults, increased crash risk, and an
increased dependence on vehicles among this population combine to create a significant public health issue.7 Driving-related anticipatory guidance provided by a health care provider (HCP) is an intervention that could assist older drivers in modifying their current driving behaviors or transitioning to driving cessation.8 Anticipatory guidance is defined as providing information to patients to help with planning for expected physical and behavioral changes.9 Unlike counseling, anticipatory guidance is provided proactively to prevent future actions from taking place.10 This mechanism is underutilized for adults, but has been shown to result in
ABSTRACT
Background: The number of drivers aged 65 or older is expected to increase, creating a significant public health issue. Health care providers (HCPs) can provide counseling to their older patients to assist with continuing to drive safely. The goal of the current study was to determine the frequency with which older drivers recall having had received driving-related information from their HCP.
Methods: Current and former drivers aged 65 or older in the upper Midwest were surveyed about whether a HCP had provided information to them about driving issues.
Results: Of the 59 completed responses for former drivers, less than 15% reported having received information from their HCP on driving issues prior to stopping driving. Of the 775 completed responses for current drivers, 0.7% of respondents aged 65 to 74, 0.4% of respondents aged 75 to 84, and 7.0% of respondents aged 85 or older recalled their HCP ever having provided them with information about safe driving habits, or been told they should limit or discontinue their driving.
Conclusions: Few adults aged 65 or older are receiving information related to driving safety from their HCP. HCP conversations are an important part of normalizing the transition through the stages of driving cessation, and may assist older adults get prepared, both emotionally and logistically, for the time when they have to stop driving. Additional research on HCP provision of driving safety information to older adults is needed.
Keywords: Older drivers, Mobility counseling, Driving cessation, Health care provider, Aging, Injury prevention Department of Public Health, North Dakota State University, Fargo, North Dakota, USA
Received: 07 March 2018
Revised: 05 April 2018
Accepted: 14 April 2018
*Correspondence:
Dr. Andrea L. Huseth-Zosel,
E-mail: [email protected]
Copyright: © the author(s), publisher and licensee Medip Academy. This is an open-access article distributed under the terms of the Creative Commons Attribution Non-Commercial License, which permits unrestricted non-commercial use, distribution, and reproduction in any medium, provided the original work is properly cited.
safer behaviors for younger populations.10-11 For older adults and driving, driving-related anticipatory guidance would include HCPs providing information related to “red flags” for risky driving, driving/vehicle modifications needed to continue driving safely, or recommendations to discontinue driving altogether.9 This type of counseling is provided at the discretion of the HCP, but as HCPs are in a position to provide this information to their patients, they can help older drivers maintain safe driving skills and prevent injuries and fatalities as the result of a vehicle crash. Additionally, early HCP conversations related to driving issues are an important part of “normalizing” the transition from driving independence to driving cessation, and can assist older adults prepare for the time when they have to stop driving.9
Previous research has focused on the frequency with which HCPs self-report providing driving-related information to their older patients, but no known research has been conducted with drivers aged 65 or older to determine their recall of having ever received driving-related anticipatory guidance from their HCP.12 The goal of the current study was to determine the frequency with which older drivers (current and former) recall having had received driving-related anticipatory guidance from their HCP.
METHODS
The survey used in this study was designed based on a review of the relevant literature.13-14 Respondent addresses were acquired from USA Data, a commercial data vendor, for residents aged 65 or older residing in the following states: North Dakota, South Dakota, Utah, Colorado, and Wyoming, which are included in the National Highway Traffic Safety Administration's Region 8.15 Following IRB approval, survey instruments were mailed in January 2013 to 2,600 randomly selected respondents from the original list of 10,000 acquired addresses. A total of 834 respondents completed and returned the survey for a 32.1% response rate. Survey responses were entered manually into SPSS Version 20.
Measures
Respondent characteristics: Respondents were asked about their current driving status. Demographic information was collected for all respondents including age, gender, marital status, highest level of education, current living arrangements, description of health, and whether or not they had ever been involved in a motor vehicle crash.
Non-drivers: Non-drivers were asked to identify the age at which they stopped driving, and if, prior to stopping driving, a HCP had ever spoken with them about driving issues such as driving fitness or when to stop driving. They were also asked to identify reasons they stopped
driving. They were provided with a predefined list of options, and could provide additional reasons not included in the list as well.
Drivers: Current drivers were asked to rate their confidence as to their overall driving abilities on a five-point scale from “not at all confident” to “very confident.” They were also asked to identify the frequency with which they drive and to describe their level of driving abilities as “poor”, “ok”, “good”, or “excellent.” Additionally, this population was asked if a HCP had ever provided information to them about safe driving habits and if they had ever been told by a HCP that they should limit their driving or discontinue driving.
Statistical analyses
Descriptive statistics were conducted for all items and examined by driving status. For comparisons of demographic characteristics of current drivers and non-drivers, one-way analysis of variance was used for continuous variables and chi-square for categorized variables.
RESULTS
Demographic characteristics of respondents
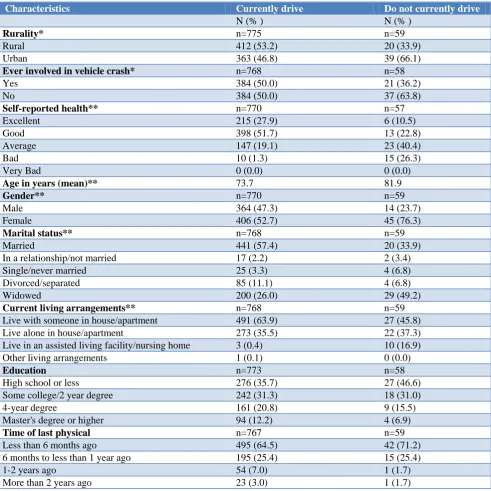
Of the 834 completed responses, 92.9% of the respondents stated they currently drive (“current drivers”), while 7.1% stated they do not drive (“non-drivers”) (Table 1). Half (50.0%) of the current drivers had ever been involved in a vehicle crash, as compared to 36.2% of the non-drivers. Current drivers were more than twice as likely as non-drivers to self-report their health as “Excellent” or “Good” (79.6% vs. 33.3%); were younger than non-drivers (mean=73.7 years vs. 81.9 years); were more likely to be male than non-drivers (47.3% vs. 23.7%), were more likely to be married (57.4% vs. 33.9%), and were more likely to live with someone in a house or apartment (63.9% vs. 45.8%). Current drivers were also more educated than non-drivers with current drivers more likely to have at least a 4-year college degree (33.0% vs. 22.4%). Non-drivers were slightly more likely than current drivers to have had their last physical within the last six months (71.2% vs. 64.5%). There were statistically significant differences between current drivers and non-drivers for all demographic variables with the exception of education and time since last physical.
Non-drivers
HCP advised them to stop driving. Nearly 17 percent stopped driving because it became too frightening to drive, while 15.3% stopped driving because they did not need a vehicle. Several other responses selected by respondents included a friend or family member advised me to stop driving (8.5%), it became too expensive to
drive (8.5%), and they failed their driver’s test (1.7%). Two respondents stated they have never driven. Other responses provided by respondents as to why they stopped driving include: not liking traffic, having a family member killed in a vehicle crash, having medication issues, and winter driving conditions.
Table 1: Participant demographics.
Characteristics Currently drive Do not currently drive
N (% ) N (% )
Rurality* n=775 n=59
Rural 412 (53.2) 20 (33.9)
Urban 363 (46.8) 39 (66.1)
Ever involved in vehicle crash* n=768 n=58
Yes 384 (50.0) 21 (36.2)
No 384 (50.0) 37 (63.8)
Self-reported health** n=770 n=57
Excellent 215 (27.9) 6 (10.5)
Good 398 (51.7) 13 (22.8)
Average 147 (19.1) 23 (40.4)
Bad 10 (1.3) 15 (26.3)
Very Bad 0 (0.0) 0 (0.0)
Age in years (mean)** 73.7 81.9
Gender** n=770 n=59
Male 364 (47.3) 14 (23.7)
Female 406 (52.7) 45 (76.3)
Marital status** n=768 n=59
Married 441 (57.4) 20 (33.9)
In a relationship/not married 17 (2.2) 2 (3.4)
Single/never married 25 (3.3) 4 (6.8)
Divorced/separated 85 (11.1) 4 (6.8)
Widowed 200 (26.0) 29 (49.2)
Current living arrangements** n=768 n=59
Live with someone in house/apartment 491 (63.9) 27 (45.8)
Live alone in house/apartment 273 (35.5) 22 (37.3)
Live in an assisted living facility/nursing home 3 (0.4) 10 (16.9)
Other living arrangements 1 (0.1) 0 (0.0)
Education n=773 n=58
High school or less 276 (35.7) 27 (46.6)
Some college/2 year degree 242 (31.3) 18 (31.0)
4-year degree 161 (20.8) 9 (15.5)
Master's degree or higher 94 (12.2) 4 (6.9)
Time of last physical n=767 n=59
Less than 6 months ago 495 (64.5) 42 (71.2)
6 months to less than 1 year ago 195 (25.4) 15 (25.4)
1-2 years ago 54 (7.0) 1 (1.7)
More than 2 years ago 23 (3.0) 1 (1.7)
*p<0.05; **p<0.001.
Respondents who had ever driven were asked their age when they stopped driving. Nearly half of respondents (48.2%) were between the ages of 75 and 84 when they stopped driving, with 26.8% between the ages of 65 and 74, 17.9% aged 85 or older, and 7.1% younger than 65. The average age of discontinuing driving was 77.54 years, with a range from 60 years to 93 years.
with 14.3% stating their HCP had spoken with them about driving issues.
Drivers
Respondents who identified themselves as current drivers were asked to specify how frequently they drive. Nearly two-thirds of respondents (64.6%) stated they drive “daily”, with 27.2% driving “several times a week”, 2.5% driving “once a week”, 4.0% driving “several times a month”, 0.4% driving “once a month”, and 1.3% driving
“rarely”. When asked to describe their driving abilities, 44.3% of respondents stated their abilities were “excellent”, 51.7% said their driving abilities were “good”, and 4.0% described their driving abilities as “ok.” No respondent described their driving abilities as “poor.” Respondents were also asked to rate their confidence in their overall driving abilities. Nearly 43% were “very confident” about their driving abilities, with 51.4% being “confident”, 5.9% being “somewhat confident”, and 0.1% being “not so confident” in their driving abilities.
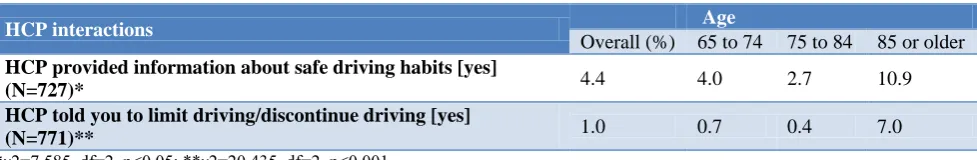
Table 2: Health care provider interactions with current drivers.
HCP interactions Age
Overall (%) 65 to 74 75 to 84 85 or older
HCP provided information about safe driving habits [yes]
(N=727)* 4.4 4.0 2.7 10.9
HCP told you to limit driving/discontinue driving [yes]
(N=771)** 1.0 0.7 0.4 7.0
*χ2=7.585, df=2, p<0.05; **χ2=20.435, df=2, p<0.001.
Of current drivers, 4.4% stated that a HCP had ever provided information to them about safe driving habits (Table 2). When examined by age, those aged 85 or older were more likely than younger drivers to state that a HCP had ever provided information to them about safe driving habits (“85 or older”: 10.9% vs. “65 to 74”: 4.0% or “75 to 84”: 2.7%) (χ2
=7.585, df=2, p<0.05). Only 1.0% of current drivers stated their HCP told them to limit or discontinue driving. Again, when examined by age, those aged 85 or older were more likely than younger drivers to have been told to limit or discontinue driving (“85 or older”: 7.0% vs. “65 to 74”: 0.7% or “75 to 84”: 0.4%) (χ2
=20.435, df=2, p<0.001).
DISCUSSION
According to the current study, very few current and former drivers aged 65 or older reported receiving driving-related anticipatory guidance from their HCPs. It is telling that only 14.3% of non-drivers stated that prior to stopping driving their HCP had ever spoken with them about driving issues, including when to stop driving, while 25.4% of non-drivers stated they stopped driving because their HCP advised them to. This reveals that many older drivers are being told to stop driving without having prior conversations with their HCPs about driving issues. Additionally, this study showed that less than 5% of current drivers aged 65 or older had recalled ever receiving information from their HCP about safe driving habits. A greater proportion of respondents in this study indicated they have received information from physicians related to driving issues than in previous studies. While no known previous studies exist which show the frequency with which older adults recall having received driving-related information from their HCPs, a closely-related study by Lum, Brown, Juarez-Colunga and Betz found that only 3.3% of respondents indicated physicians
were a “major source of information” related to driving issues.16
Study limitations
This study was limited by a number of factors. First, respondents may have had trouble recalling if their HCP had ever provided driving-related anticipatory guidance, due to age-related memory issues. Second, the survey suffered from a low response rate. Finally, this research was subject to non-response bias.18 Although non-response bias is common in survey research it is still concerning, especially when conducting survey studies with older adults, as in this case.19 Research has shown that people with better health are more likely to participate in health surveys, and it is more difficult to obtain responses from those with poorer health.20,21 For the current study, it is possible that those who chose not to respond to this survey have poorer health than those that chose to respond and are those with whom HCPs may have been more likely to provide driving-related anticipatory guidance, thus providing a depressed view of actual HCP counseling rates.
CONCLUSION
The results of this study reveal that few older adults recall receiving information about driving issues from their HCPs. Older adults should be provided this information by their HCPs prior to experiencing aging-related changes which can affect their ability to continue to drive safely. HCP conversations are important to normalizing the transition to non-driver, and can be beneficial in preparing older adults, emotionally and logistically, for the time when they must stop driving.
Funding: No funding sources Conflict of interest: None declared
Ethical approval: The study was approved by the Institutional Ethics Committee
REFERENCES
1. Lyman JM, McGwin Jr G, Sims RV. Factors related to driving difficulty and habits in older drivers. Accident Analysis Prevention. 2001;33(3):413-21. 2. U.S. Census Bureau. 2012 Statistical Abstract – The
National Data Book. 2012.
3. National Highway Traffic Safety Administration (NHTSA). Traffic Safety Facts 2015 Data – Older population. US Department of Transportation, DOT HS 812372, 2017.
4. Anstey KJ, Wood J, Lord S, Walker JG. Cognitive, sensory and physical factors enabling driving safety
in older adults. Clinical Psychol Rev.
2005;25(1):45-65.
5. Kwon M, Huisingh C, Rhodes LA, McGwin G, Wood JM, Owsley C. Association between Glaucoma and At–fault Motor Vehicle Collision Involvement among Older Drivers: A Population-based Study. Ophthalmology. 2016;123(1):109-16.
6. Mathias JL, Lucas LK. Cognitive predictors of unsafe driving in older drivers: a meta-analysis. International Psychogeriatrics. 2009;21(4):637-53. 7. Haustein S, Siren A. Older people's mobility:
Segments, factors, trends. Transport Reviews. 2015;35(4):466-87.
8. Betz ME, Lowenstein SR, Schwartz R. Older adult opinions of “advance driving directives”. J Primary Care Community Health. 2013;4(1):14-27.
9. Betz ME, Jones J, Petroff E, Schwartz R. “I wish we could normalize driving health:” a qualitative study of clinician discussions with older drivers. J General Internal Med. 2013;28(12):1573-80.
10. Nelson CS, Wissow LS, Cheng TL. Effectiveness of anticipatory guidance: recent developments. Current Opinion Pediatrics. 2003;15(6):630-5.
11. DiGuiseppi C, Roberts IG. Individual-level injury prevention strategies in the clinical setting. The Future Children. 2000: 53-82.
12. Huseth-Zosel AL, Sanders G, O'Connor M.
Predictors of health care provider anticipatory guidance provision for older drivers. Traffic Injury Prevention. 2016;17(8):815-20.
13. Dellinger AM, Sehgal M, Sleet DA, Barrett‐Connor E. Driving cessation: What older former drivers tell us. J Am Geriatrics Society. 2001;49(4):431-5. 14. Hakamies-Blomqvist L, Wahlström B. Why do
older drivers give up driving? Accident Analysis & Prevention. 1998;30(3):305-12.
15. NHTSA. National Highway Traffic Safety
Administration Regional Offices. 2012.
16. Lum HD, Brown JB, Juarez-Colunga E, Betz ME. Physician involvement in life transition planning: a survey of community-dwelling older adults. BMC Family Practice. 2015;16(1):92.
17. Liddle J, Carlson G, McKenna K. Using a matrix in life transition research. Qualitative Health Res. 2004;14(10):1396-417.
18. Hansen MH, Hurwitz WN. The problem of non-response in sample surveys. J American Statistical Association. 1946;41(236):517-29.
19. Groves RM, Cialdini RB, Couper MP.
Understanding the decision to participate in a survey. Public Opinion Quarterly. 1992;56(4):475-95.
20. Paganini-Hill A, Hsu G, Chao A, Ross RK. Comparison of early and late respondents to a postal health survey questionnaire. Epidemiology. 1993:375-9.
21. Maclennan B, Kypri K, Langley J, Room R. Non-response bias in a community survey of drinking, alcohol-related experiences and public opinion on alcohol policy. Drug Alcohol Dependence. 2012;126(1):189-94.