Weather Prediction with Datamining Techniques
A Nagaratnam*1, G V Sivanarayana2, S S N L Priyanka3
*1Department of CSE, ANITS,Visakhapatnam, Andhra Pradesh, India 2Department of IT, GITAM University, Visakhapatnam, Andhra Pradesh, India
3Department of CSE, ANITS,Visakhapatnam, Andhra Pradesh, India
ABSTRACT
Weather forecasting is an important application in meteorology and has been one of the most scientifically and technologically challenging problems around the world. In this paper, we investigate the use of data mining techniques in forecasting maximum temperature, rainfall, evaporation and wind speed. Weather prediction approaches are challenged by complex weather phenomena with limited observations and past data. Weather phenomena have many parameters that are impossible to enumerate and measure. Increasing development on communication systems enabled weather forecast expert systems to integrate and share resources and thus hybrid system has emerged. Even though these improvements on weather forecast, these expert systems can’t be fully reliable since weather forecast is main problem.
Keywords: Weather Forecasting, Data Mining
I.
INTRODUCTIONWeather is one of the most effective environmental constraints in every phase of our lives. We are subject to adjusting ourselves with respect to weather condition from our dressing habits to strategic organizational planning activities, since the adverse weather conditions may cause a considerable damage on our lives and properties. We need to be on alert to these adverse weather conditions by taking some precautions and using prediction mechanisms for early warning of hazardous weather phenomena. In this survey we try to give readers an overview about weather prediction phenomena, expert systems approaches, main domain specific problems, and solution methodologies.
Data mining, the extraction of hidden predictive information from large databases, is a powerful new technology with great potential to help companies focus on the most important information in their data
"Which clients are most likely to respond to my next promotional mailing, and why?"
Data mining techniques are the result of a long process of research and product development. This evolution began when business data was first stored on computers, continued with improvements in data access, and more recently, generated technologies that allow users to navigate through their data in real time. Data mining takes this evolutionary process beyond retrospective data access and navigation to prospective and proactive information delivery. Data mining is ready for application in the business community because it is supported by three technologies that are now sufficiently mature: Massive data collection, Powerful multiprocessor computers, Data mining algorithms.
A wide range of companies have deployed successful applications of data mining. While early adopters of this technology have tended to be in information-intensive industries such as financial services and direct mail marketing, the technology is applicable to any company looking to leverage a large data warehouse to better manage their customer relationships. Two critical factors for success with data mining are: a large, well-integrated data warehouse and a well-defined understanding of the business process within which data mining is to be applied (such as customer prospecting, retention, campaign management, and so on).
Weather forecasting is a vital application in meteorology and has been one of the most scientifically and technologically challenging problems around the world in the last century. In this paper, we investigate the use of data mining techniques in forecasting maximum temperature, rainfall, evaporation and wind speed. This was carried out using Artificial Neural Network and Decision Tree algorithms and meteorological data collected between 2000 and 2009 from the city of Ibadan, Nigeria. A data
model for the meteorological data was developed and this was used to train the classifier algorithms. The performances of these algorithms were compared using standard performance metrics, and the algorithm which gave the best results used to generate classification rules for the mean weather variables. A predictive Neural Network model was also developed for the weather prediction program and the results compared with actual weather data for the predicted periods. The results show that given enough case data, Data Mining techniques can be used for weather forecasting and climate change studies.
meteorological characteristics using a number of methods, some of these methods being more accurate than others To predict the weather by numerical means, meteorologists have developed atmospheric models that approximate the atmosphere by using mathematical equations to describe how atmospheric temperature, pressure, and moisture will change over time. The equations are programmed into a computer and data on the present atmospheric conditions are fed into the computer. The computer solves the equations to determine how the different atmospheric variables will change over the next few minutes.
II.
Materials and Methods2.1 Data Collection
The data used for this work was collected from Ibadan Synoptic Airport through the Nigerian Meteorological Agency, Oyo State office. The case data covered the period of 120 months, that is, January 2000 to December 2009. The following procedures were adopted at this stage of the research: Data Cleaning, Data Selection, Data Transformation and Data Mining.
2.2 Data Cleaning
In this stage, a consistent format for the data model was developed which took care of missing data, finding duplicated data, and weeding out of bad data. Finally, the cleaned data were transformed into a format suitable for data mining.
2.3 Data Selection
At this stage, data relevant to the analysis was decided on and retrieved from the dataset. The meteorological dataset had ten (10) attributes, their type and description is presented in Table 1, while an analysis of the numeric values are presented in Table 2. Due to the nature of the Cloud Form data where all the values are the same and the high percentage of
missing values in the sunshine data both were not used in the analysis
2.4 Data Transformation
This is also known as data consolidation. It is the stage in which the selected data is transformed into forms appropriate for data mining. The data file was saved in Commas Separated Value (CVS) file format and the datasets were normalized to reduce the effect of scaling on the data.
2.5 Data Mining Stage
The data mining stage was divided into three phases. At each phase all the algorithms were used to analyze the meteorological datasets. The testing method adopted for this research was percentage split that train on a percentage of the dataset, cross validate on it and test on the remaining percentage. Thereafter interesting patterns representing knowledge were identified.
III.
Evaluation MetricsIn selecting the appropriate algorithms and parameters that best model the weather forecasting variable, the following performance metrics were used
1. Correlation Coefficient: This measures the statistical correlation between the predicted and actual values. This method is unique in that it does not change with a scale in values for the test cases. A higher number means a better model, with a 1 meaning a perfect statistical correlation and a 0 meaning there is no correlation at all.
3. The Mean-squared Error is simply the square root of the mean-squared-error. The mean-squared error gives the error value the same dimensionality as the actual and predicted values.
% Error: The percent error is defined by the following formula
IV.
Experimental DesignC5 Decision Tree classifier algorithm which was implemented in See5 was used to analyse the meteorological data. The C5 algorithm was selected after comparison of results of tests carried out using CART and C4.5 algorithms. The ANN algorithms used were those capable of carrying out time series analysis namely: the Time Lagged Feedforward Network (TLFN) and Recurrent networks implemented in Neuro Solutions 6 (an ANN development and simulation software). The ANN networks were used to predict future values of Wind speed, Evaporation, Radiation, Minimum Temperature, Maximum Temperature and Rainfall given the Month and Year.
V.
Results and Discussion5.1 See5 Decision Tree Results
The C5 algorithm (implemented in the See5 software) is the latest version of the ID3 and C4.5 algorithms developed by Quinlan in the last two decades. The
criterion employed in See5 algorithm to carry out the partitions is based on the concepts from Information Theory and has been improved over time. The main idea is to choose the variable that provides more information to realize the appropriate partition in each branch in other to classify the training set. One advantage of Decision Tree classifiers is that rule can be inferred from the trees generated that are very descriptive, helping users to understand their data.See5 software can generate both decision trees and decision tree rules depending on selected options. The Trees and rules were generated using 10 fold cross validation and the results with the least error on the test data set were selected. Table 3 presents the summary of the runs and the decision tree obtained from Run Number 6 which had the least error.
The See5 decision tree results can also be presented in the form of rules (See5 rules) which are easier to understand and use. Each rule consists of:
1. A rule number that serves only to identify the rule. 2. Statistics (n, lift x) or (n/m, lift x) that summarize
the performance of the rule
3. n is the number of training cases covered by the rule and m shows how many of them do not belong to the class predicted by the rule. The rule's accuracy is estimated by the Laplace ratio (n-m+1)/(n+2). The lift x is the result of dividing the rule's estimated accuracy by the relative frequency of the predicted class in the training set. 4. One or more conditions that must all be satisfied
for the rule to be applicable 5. Class predicted by the rule.
6. A value between 0 and 1 that indicates the confidence with which this prediction is made. 7. Default class that is used when none of the rules
apply.
See5 decision tree generated:
MaxTemp <= 32.2: :...MaxTemp <= 29.6: : :...Wind <= 129.93: sep (7) : : Wind > 129.93:
: : :...Radiation <= 9.6: aug (11/2) : :Radiation > 9.6: jul (6)
: MaxTemp > 29.6:
: :...Wind <= 118.26: oct (9/1) : Wind > 118.26:
: :...MaxTemp > 31: may (9/1) : MaxTemp <= 31:
: :...MinTemp <= 22.2: sep (2)
: MinTemp > 22.2: Jun (10/2) MaxTemp > 32.2: :...MaxTemp <= 34:
:...Rainfall > 81.6: april (10/2) : Rainfall <= 81.6:
: :...MinTemp <= 23.3: : :...Wind <= 101.2: dec (3/1) : : Wind > 101.2: jan (11/2) : MinTemp > 23.3:
: :...MaxTemp <= 33.2: nov (5)
: MaxTemp > 33.2: dec (4/1) MaxTemp > 34: :...Wind <= 117.65: dec (2)Wind > 117.65: :...MinTemp <= 23.7: feb (6/1)MinTemp >
23.7: :...MaxTemp <= 34.2: feb (2/1) MaxTemp > 34.2:
:..MinTemp <= 24.8:mar(9/1)MinTemp > 24.8: feb (2)
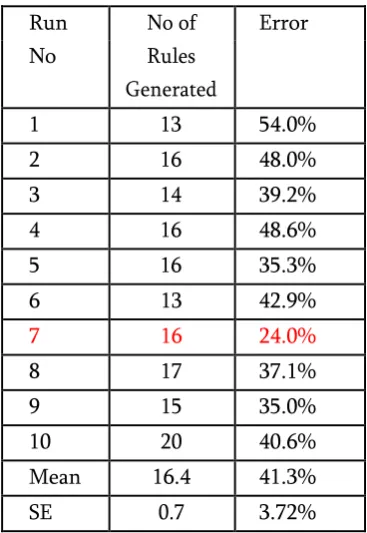
The summary of the runs for the generation of See5 rules on the test data set using 10 fold cross validation is presented in Table 4 and twelve of the rules from Run Number 7 which had the least errors are presented:
Table 4: Summary of results of See5 rules generation process
Run No of Error
No Rules
Generated
1 13 54.0%
2 16 48.0%
3 14 39.2%
4 16 48.6%
5 16 35.3%
6 13 42.9%
7 16 24.0%
8 17 37.1%
9 15 35.0%
10 20 40.6%
Mean 16.4 41.3%
SE 0.7 3.72%
Run No No of Trees Error Generated
1 25 60.5%
2 21 45.3%
3 23 48.7%
4 16 32.7%
5 18 53.0%
6 17 43.0%
7 15 68.7%
8 24 49.2%
9 18 58.3%
10 17 50.0%
Mean 18.3 51.8%
Table 5: TLFN training and test data statistics
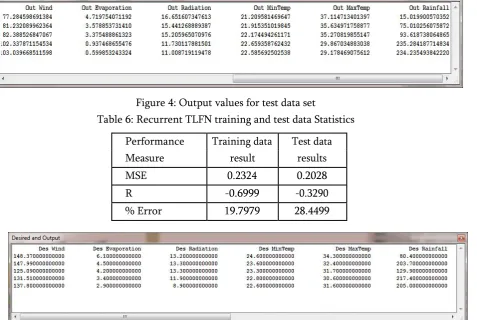
Figure 3: Desired values for test data set
Figure 4: Output values for test data set Table 6: Recurrent TLFN training and test data Statistics
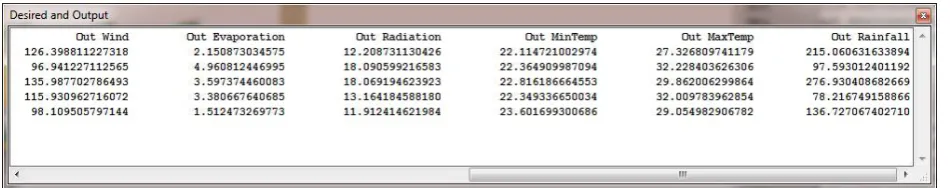
Figure 6: Desired values for test data set
Perfor Training data Test data
mance results results
Measur Traini CV Train CV
E ng ing
MSE 0.2754 0.09 0.208 0.09
36 0 36
R 0.3332 0.51 0.327 0.51
02 0 02
% 78.328 18.0 24.38 18.0
Error 6 765 64 765
Performance Training data Test data
Measure result results
MSE 0.2324 0.2028
R -0.6999 -0.3290
Figure 7: Output values for test data set
VI.
ConclusionIn this work the C5 decision tree classification algorithm was used to generate decision trees and rules for classifying weather parameters such as maximum temperature, minimum temperature, rainfall, evaporation and wind speed in terms of the month and year. The data used was for Ibadan metropolis obtained from the meteorological station between 2000 and 2009. The results show how these parameters have influenced the weather observed in these months over the study period. Given enough data the observed trend over time could be studied and important deviations which show changes in climatic patterns identified. Artificial Neural Networks can detect the relationships between the input variables and generate outputs based on the observed
patterns inherent in the data without any need for programming or developing complex equations to model these relationships. Hence given enough data ANN’s can detect the relationships between weather parameter and use these to predict future weather conditions. Both TLFN neural networks and Recurrent network architectures were used to developed predictive ANN models for the prediction of future values of Wind speed, Evaporation, Radiation, Minimum Temperature,
Maximum Temperature and Rainfall given the Month and Year. Among the recurrent neural network architectures used the recurrent TLFD network which used the TDNN memory component gave a better training and testing result and this better than
the best TLFD network which used a Gamma memory component. The results obtained were evaluated with the test data set prepared along with the training data and were found to be acceptable considering the small size of the data available for training and testing. To have a better result a larger data set which will comprise of data collected over many decades will be needed. In future research works neuro-fuzzy models will be used for the weather prediction process. This work is important to climatic change studies because the variation in weather conditions in term of temperature, rainfall and wind speed can be studied using these data mining techniques.
VII.
REFERENCES[1]. D Fallows, “Search Engine Use,” technical report, Pew Internet and Am. Life Project, http://www.pewinternet.org/Reports/2008/Search-Engine-Use.aspx. Aug. 2008.
[2]. comScore, “Global Search Market Grows 46 Percent in2009,”http://www.comscore.com/Press_Events/Pre ss_Releases/2010/1/Global_Search_Market_Grows_4 6_%_in_2009, Jan. 2010.
[3]. J Coffman and A.C. Weaver, “A Framework for Evaluating Database Keyword Search Strategies,” Proc. 19th ACM Int’l Conf. Information and Knowledge Management (CIKM ’10), pp. 729-738,Oct. 2010.
[5]. W Webber, “Evaluating the Effectiveness of Keyword Search,” IEEE Data Eng. Bull., vol.33, no. 1, pp. 54-59, Mar. 2010.
[6]. A Baid, I. Rae, J. Li, A. Doan, and J. Naughton, “Toward Scalable Keyword Search over Relational Data,” Proc. VLDB Endowment, vol. 3, no. 1, pp. 140-149, 2010.