IJSRSET1736189 | Received: 05 Oct 2017 | Accepted: 22 Oct 2017 | September-October-2017 [(3)6: 753-759]
© 2017 IJSRSET | Volume 3 | Issue 6 | Print ISSN: 2395-1990 | Online ISSN: 2394-4099 Themed Section: Engineering and Technology
753
On Lighting Design, Simulation, Analysis and Amelioration of
a Computing Laboratory Area Using DIALux Software
Simulation Techniques
Sourin Bhattacharya1, Manjulika Bera2, Mohuli Majumdar3, Nirab Majumder4 and Sanjib Majumder5 1,2,3 School of Illumination Science, Engineering and Design, Jadavpur University, Kolkata, India
4 School of Laser Science and Engineering, Jadavpur University, Kolkata, India 5 Department of Physics, Indian Institute of Technology Kharagpur, West Bengal, India
ABSTRACT
It is of significant academic and commercial interest to develop energy efficient lighting systems for different settings especially of indoor facilities following the national illuminance and lighting power density standards. In addition, it is imperative to analyze and ameliorate existing lighting systems in various spheres of humane activity in order to phase out inefficient lamps and replace the corresponding fixtures with energy efficient solid state or other forms of lighting. In the undertaken designing work, the existing lighting system of the Central Computing Laboratory, Electrical Engineering Department, Jadavpur University was analyzed and a DIALux simulation model of the same was created to simulate and ameliorate upon it. Thereafter, an ameliorated DIALux simulation model was created using DIALux 4.12 and it was found that it adheres to the recommendations and guidelines of relevant Indian standards such as the IS–3646 and the Energy Conservation Building Code (ECBC) in terms of illuminance level and lighting power density respectively. It is highly recommended to redesign the lighting layout of the aforementioned laboratory following this ameliorated DIALux simulation model.
Keywords: Indoor Lighting Design, Illumination, Energy Efficient Lighting, Software Simulation, LED, DIALux.
I. INTRODUCTION
Indoor lighting practices have evolved with time and over the past two decades, research works have striven; based on energy efficiency, lighting control, and illumination criteria; to model, visualize, analyse, evaluate and delineate various indoor and outdoor lighting systems as per the stringent requirements of various national and international codes of practice and standards [1-10]. With the ascension of various techniques pertaining to generation of an image by tracing the path of light through the pixels in an image plane and simulating the effects of its encounters with various virtual objects, the scope of lighting simulation has been enriched and these techniques are based on ray tracing. Modern indoor lighting practices take account of the required illumination levels for various activities
[3-5], uniformity of distribution of light in the working spaces for illumination, colour of the light, correlated colour temperature (CCT), colour rendering index (CRI) of the light sources in use, energy considerations etc. [11-13]. It is cardinal to consider the physiological responses to light [14] in order to reduce visual discomfort, excessive glare and inculcate aesthetic lighting effects for optimization of visual stimulus and human performance [15-16]. Considering these, this work focuses upon evaluating the lighting system of a computing laboratory and suggests measures of ameliorating the same by DIALux software simulations.
II. LITERATURE REVIEW
the Bureau of Indian Standards and the National Lighting Code [10] are followed by and referred to for implementing any standard lighting design. The Energy Conservation Building Code (ECBC) of 2007 [2] was developed by the Government of India for commercial buildings and it sets minimum standards for power utilization for a connected load of 100 kW or more. It also tabulates recommended values of lighting power densities (LPD) for various workspaces as a function of building area or space. Kumar, S. et al. [3] expounded on development of energy conservation building codes and their implementation strategies in the Indian context. Walawalkar, R. S. [4] detailed the necessities for an efficient lighting system with respect to software industry requirements. Mukherjee, P. [5] reviewed energy efficient lighting systems for an office building and suggested measures to maintain efficiency. Luoxi, H. G. H. [6] compared between lighting software DIALux and Agi32. It was found that DIALux simulation techniques were more reliable and accurate. Vishwas, M., and Soori, P. K. [7] critically analysed the daylighting and artificial lighting components of an office lighting system design. Other works [8-9, 11-16] focused upon lighting codes, sustainable design methods, energy efficiency, human perception and task performance. Surveying these, DIALux software simulation techniques were utilized in the lighting design, simulation and analysis of the aforementioned computing laboratory.
III. MATERIALS AND METHODS
A. Hardware Components
A digital photometer, a laser range-finding (distance) meter, a chalk and a tape measure were utilized to carry out the light (lx), dimension and distance measurements.
B. Software Components
DIALux, a software developed by DIAL GmbH of Germany for the purpose of lighting system planning and design utilizing its standard library of tools and objects, was utilized for the lighting design and simulation. An associated software POV–Raytracer was used to render photorealistic images of the DIALux simulation models. Standard luminaire intensity (in .ies file format) files for TCS 306/236, TCS 306/136, FBH
100/113 and LTD Lithonia 2PM3N 12 cell 2x4 luminaires were utilized to plan the lighting system.
C. Measurement and Simulation Procedures (1) Distance Measurement Procedure
In order to correctly model the laboratory, distance measurements were tabulated and assumed to proper truncation. The laboratory consisted of six workspaces with a total of twenty-six computer terminals. The length, width and height of workspaces, viz. the tables and rows of adjacently placed worktops, were duly tabulated. A complete floor plan was drawn by sketching the room elements in their respective locations. The height of the room, i.e. the orthogonal distance from the ground to the ceiling was measured with the help of a laser range-finding meter. In a similar fashion, the sill and lintel levels of different windows within the room were measured; also, distances of some workspace edges from their adjacent walls were measured using either the tape measure or the laser range-finding distance meter as per convenience.
(2) Illuminance Measurement Procedure
A digital photometer, which could measure up to illuminance levels of 50000 lx with a minimal error margin, was utilized to calculate the illuminance levels of the different workspaces. To attain better approximations of the average illuminance levels, grid systems with several equidistant grid points were drawn on all the workspaces. Firstly, the requisite dimensional measurements of the workspaces were tabulated and from the tabulated data, the imaginary grid systems were drawn by marking several points on the workspaces by a piece of white chalk. With the photometer, the illuminance levels on those points were measured and noted down in a tabular form. Necessary precautions were taken to avoid the shadows of the observer falling on the workspace or the observer blocking the path of light from the adjacently placed overhead luminaires. By following this procedure, the average illuminance levels of the different workspaces were found out.
(3) DIALux Simulation
Utilizing various objects and luminaire files, a user could design an indoor lighting system as per the required criterion. An illustrative design is shown herein:
Figure 1. Illustrative Project Floor Plan
One shall arrive at the summarized photometric results by simulation, which may be appropriate for easy viewing and analysis of total luminous flux, electrical load, uniformity and lighting power density.
(4) POV–Raytracer Rendition
The POV–Raytracer software was utilized to create photorealistic views of the simulation models. It uses its radiosity function to map the light distribution the way it shall be visually perceived by a normal human eye. It may also work as an anti–aliasing filter to smoothen up rough edges of various textures and improve the overall appearance of the model. An illustrative POV–Raytracer rendition in 3–D is duly shown herein:
Figure 2. Illustrative POV–Raytracer Rendition
D. Original Floor Plan of the Laboratory
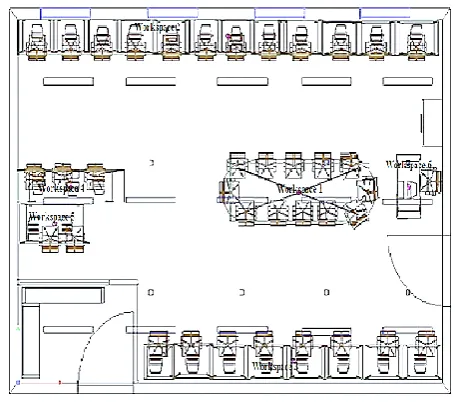
The original floor plan of the laboratory having 10.43 metres in length and 6.85 metres in breadth depicting the working surfaces was sketched. It is shown herein:
Figure 3. Original Floor Plan of the Laboratory
E. Development of DIALux Models
Based on the original floor plan of the laboratory, a DIALux simulation model having a floor and luminaire plan was developed to resemble the physical lighting system as far as practicable. It is duly shown herein:
Figure 4. DIALux Model of the Existing System
Figure 5. DIALux Model of the Proposed System
F. Reflected Ceiling Plan of the Laboratory
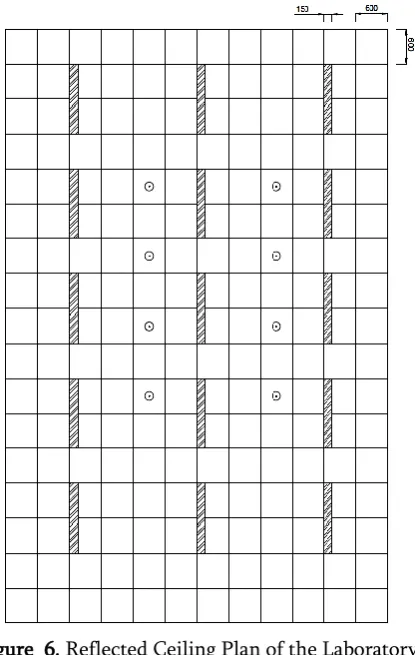
The reflected ceiling plan, depicting the luminaire positions, of the original physical lighting system in the laboratory was sketched. It is shown herein:
Figure 6. Reflected Ceiling Plan of the Laboratory
G. Measured Dimensions of the Workspaces
The measured dimensions of the six workspaces (WSpaces) of the laboratory are tabulated herein:
Table 1. Workspace Dimensions
Name Length (in m)
Width (in m)
Height (in m)
WSpace 1 (Centre Table)
3.66 1.22 0.76
WSpace 2 (12 Computers)
10.43 0.64 0.76
WSpace 3 (8 Computers)
7.30 0.64 0.76
WSpace 4 (3 Computers)
2.631 0.619 0.76
WSpace 5 (2 computers)
1.745 0.751 0.76
WSpace 6 (1 Computer)
1.22 0.60 0.76
IV. RESULTS
A. Illuminance Levels
Average illuminance levels on all the workspaces were determined by physical measurements and DIALux simulations. A table listing the average illuminance levels (lx) of the workspaces of the laboratory, the DIALux model replicating the physical system and the proposed ameliorated DIALux model is shown herein:
Table 2. Average Illuminance Comparison
Parameter Existing System
DIALux Model
Ameliorated DIALux
Model
Average Illuminance
Level (in lx)
WSpace 1: 488.89 WSpace 2:
314.80 WSpace 3:
320 WSpace 4:
283.33 WSpace 5:
232 WSpace 6:
357
WSpace 1: 485 WSpace 2:
257 WSpace 3:
264 WSpace 4:
233 WSpace 5:
211 WSpace 6:
408
WSpace 1: 716 WSpace 2:
419 WSpace 3:
462 WSpace 4:
415 WSpace 5:
417 WSpace 6:
B. POV–Raytracer Diagrams
(1) One POV–Raytracer diagram pertaining to the general DIALux model emulating the physical existing lighting system was created. It is duly shown herein:
Figure 7. POV–Raytracer Rendition of Light Distribution of the DIALux Model of Existing System
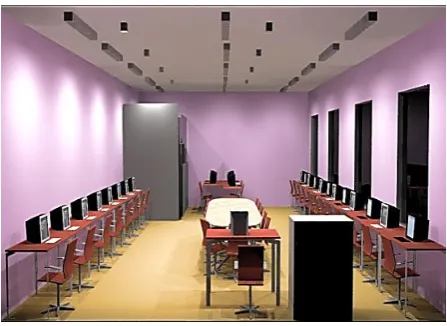
(2) One POV–Raytracer diagram of the ameliorated DIALux model of the laboratory demonstrating the subjective improvement in aesthetics and light distribution is duly shown herein:
Figure 8. POV–Raytracer Rendition of Light Distribution of the DIALux Model of Proposed System
V. DISCUSSION
A. Calculation of Lighting Power Densities
(1) The surface area of the laboratory = length × breadth = (10.43 × 6.85) m2 = 71.4455 m2. For the existing
lighting system, there are 26 (twenty-six) T12 fluorescent tubular luminaires each of 40 W, 4 (four) T8 fluorescent tubular luminaires each of 36 W and 8 (eight) of compact fluorescent luminaires each of 18 W present
and there are two lamps per luminaire for fluorescent tubular lamps.
Thus, the electrical power consumed = 26×40 + 4×36 + 8×18 = 1328 W.
Therefore, the lighting power density (LPD) =
1328
71.4455𝑊/𝑚
2= 18.59 𝑊/𝑚2
(2) For the general DIALux model, there are 8 (eight) FBH 100/113 luminaires each of 17.3 W and 15 (fifteen) Philips TCS306/236 HF Normal luminaires each of 74 W having two lamps per luminaire.
Thus, the electrical power consumed can be calculated as = 8×17.3 +15×74=1248.4 W.
Therefore, the lighting power density (LPD) =
1248.4
71.4455𝑊/𝑚
2= 17.47 𝑊/𝑚2
(3) For the proposed (ameliorated) DIALux model, there are 6 (six) TCS 306/136 M1 luminaires each of 45.2 W, 4 (four) Philips TCS 306/236 HF Normal luminaires each of 74 W and 10 (ten) MLS CO., LTD Lithonia 2PM3N 12 Cell 2x4 Parabolic luminaires each of 37.3 W.
Thus, the consumed electric power for the purpose of lighting can be determined as = 6×45.2 + 4×74 + 10×37.3 = 940.2 W.
Therefore, the lighting power density (LPD) =
940.2
71.4455𝑊/𝑚
2 = 13.16 𝑊/𝑚2
B. Comparison of Various Parameters
A tabulation of the three designs with comparison parameters such as number of luminaires utilized, total electrical power consumed by connected loads, minimum planar average illuminance, maximum planar average illuminance, lighting power density and compliance with relevant standards is shown herein:
Table 3. Comparison of Parameters
Parameters Existing Lighting System
General DIALux Model
Proposed DIALux
Model Total No. of
Luminaires
38 23 20
Total Electric
Load
Minimum Planar Average Illuminance 232 lx in WSpace 5 211 lx in WSpace 5 415 lx in WSpace 4 Maximum Planar Average Illuminance 488.89 lx in WSpace 1 485 lx in WSpace 1 716 lx in WSpace 1 Lighting Power Density 18.59 W/m2 17.47 W/m2 13.16 W/m2 Compliance With IS–3646
No No Yes
Compliance With ECBC 2007
No No Yes
The ameliorated DIALux model thus complies with the IS–3646 (Part 1) of 1992 as it follows the 300–500–750 lx illuminance level recommendation and also the ECBC 2007 guidelines as the lighting power density for the laboratory is found to be 13.16 W/m2 which is well
below the highest recommended value of 15.10 W/m2.
C. Limitations
Hereby, the study and analysis is dependent upon certain assumptions. First, the luminaires files utilized in the DIALux simulation model (closely replicating the physical laboratory) were assumed to be ideal sources of luminous flux and did not necessarily consider the lumen depreciation of the actual luminaires present in the laboratory. Then, the reflection factor of the ceiling was assumed to be 80%; that of the four walls to be 70%. Irregularities and roughness of the aforementioned surfaces were not considered. After that, various air circulating and air conditioning systems, such as air conditioners, wall mounted fans etc. were not considered and their 3D models were not imported to the simulation environment. In addition, other existing physical conditions of the laboratory were left out of the purview of simulation. Now, in the ameliorated model, these exclusions and limitations inadvertently restrict the scope of this amelioration, and it needs more iteration in order to attain higher degrees of practicality
in simulating and ameliorating the existing conditions of the laboratory lighting system.
VI. CONCLUSION
It can be perceived that the existing lighting system of the Central Computing Laboratory, Electrical Engineering Department, Jadavpur University does not necessarily adhere to the recommendations of the IS–
3646 (Part 1) of 1992 and the Energy Conservation Building Code (ECBC) of 2007. Two of the workspaces had average illuminance levels of 283.33 lx (workspace 4) and 232 lx (workspace 5) respectively and the lighting power density (LPD) was more than 15.10 W/m2 which
is the recommended maximum LPD of a laboratory as per the table 7.3.2 (Interior Lighting Power–Space Function Method) of the ECBC. The DIALux simulation model of the existing system exhibits its simulated LPD as 17.47 W/m2. In the ameliorated DIALux model, the
introduction of LTD Lithonia 2PM3N 12 cell 2x4 parabolic luminaires and complete elimination of compact fluorescent lamps (CFL) alongside a reduction in the number of utilized fluorescent tubelights (FTL) substantially increased the average light level of the workspaces. It follows the 300–500–750 lx illuminance level guidelines of the IS–3646 (Part 1) of 1992 and the middle value is the intended one for five of the workspaces. Workspace 1 receives an average illuminance of 716 lx while workspaces 2 to 6, the computer workspaces, receive 419 lx, 462 lx, 415 lx, 417 lx and 426 lx respectively. It also follows the ECBC 2007 recommendations and has a lighting power density value of 13.16 W/m2 which is significantly lower than
the recommended maximum value of 15.10 W/m2. Thus,
this ameliorated model is an energy efficient one and produces more luminous flux (lm) per Watt of consumed electric power.
Laboratory, therefore, may be improved upon by installing new fixtures for LED lamps [12], eliminating the existing compact fluorescent lamps and reducing the number of utilized fluorescent tubelights as per the ameliorated model and this would essentially be an economically viable energy efficient lighting design.
REFERENCES
[1]. Bureau of Indian Standards (BIS) (1992), IS 3646 : Code of Practice for Interior Illumination.
[2]. Bureau of Energy Efficiency (BEE) (2007), Energy Conservation Building Codes.
[3]. Kumar, S., Kapoor, R., Rawal, R., Seth, S. & Walia, S. (2010). Developing an Energy Conservation Building Code Implementation Strategy in India. Proceedings of the 2010 ACEEE Summer Study on Energy Efficiency in Buildings, 8(1), 209-224.
[4]. Walawalkar, R. S. (1998). Illuminating the Software Industry. National Seminar on Modern Trends in Efficient Lighting Systems, 98(1), 01-07.
[5]. Mukherjee, P. (2016). An Overview of Energy Efficient Lighting System Design for Indoor Applications of an Office Building. Key Engineering Materials, 692(1), 45-53.
[6]. Luoxi, H. G. H. (2005). Comparison and Analysis of Lighting Calculation Software DIALux & Agi32 [J]. China Illuminating Engineering Journal, 3, 011. [7]. Vishwas, M., & Soori, P. K. (2012). Simple Tool for
Energy Analysis of Day Lighting and Artificial Lighting for a Typical Office Building Lighting System Design. International Journal of Energy Engineering, 2(6), 332-338.
[8]. Evans, M., Shui, B., & Somasundaram, S. (2009). Country Report on Building Energy Codes in India. Pacific Northwest National Laboratory.
[9]. Lechner, N. (2014). Heating, Cooling, Lighting: Sustainable Design Methods for Architects. John Wiley & Sons.
[10]. Bureau of Indian Standards (BIS) (2010), SP 72: National Lighting Code.
[11]. Hanselaer, P., Lootens, C., Ryckaert, W. R., Deconinck, G., & Rombauts, P. (2007). Power Density Targets for Efficient Lighting of Interior Task Areas. Lighting Research & Technology, 39(2), 171-184.
[12]. Krames, M. R., Shchekin, O. B., Mueller-Mach, R., Mueller, G. O., Zhou, L., Harbers, G., & Craford, M.
G. (2007). Status and Future of High-Power Light-Emitting Diodes for Solid-State Lighting. Journal of display technology, 3(2), 160-175.
[13]. Li, D. H., Cheung, K. L., Wong, S. L., & Lam, T. N. (2010). An Analysis of Energy-Efficient Light Fittings and Lighting Controls. Applied Energy, 87(2), 558-567.
[14]. Haak, R., Wicht, M. J., Hellmich, M., Nowak, G., & Noack, M. J. (2002). Influence of Room Lighting on Grey-scale Perception with a CRT-and a TFT Monitor Display. Dentomaxillofacial Radiology, 31(3), 193-197.
[15]. Veitch, J. A., & Newsham, G. R. (1998). Lighting Quality and Energy-Efficiency Effects on Task Performance, Mood, Health, Satisfaction, and Comfort. Journal of the Illuminating Engineering Society, 27(1), 107-129.