gin Ju., Berulev G. 1998. Precipitation Character-istics Variations Effected by Hail Protection Tech-niques, 1998, (296 p).
– Dinevich, L., Shilin V., 1983. Methodical Aid for Conducting of Hail Suppression Operations by Rocket Complexes Kishinev, Moldavian Research. Institute of Scientifi c Information, 1983, (86 p.)
– Dinevich L., Dinevich S., Kudlaev E., Le-onov M. 1995. Physical and statistical investiga-tions of infl uence of the hail prevention seeding of cumulus rain clouds on regime of precipitation. Re-view of Applied and Industrial Mathematics. Scien-tifi c Publishers “RTA”. Moscow, Р. 253–287.
The work is submitted to the International Sci-entifi c Conference “Ecology and rational nature management”, Israel (tel Aviv), April 25 – Мay 2, 2014, came to the editorial offi ce оn 01.04.2014.
USING MRL-5 RADAR FOR IDENTIFYING RADAR ECHO OF MIGRATING BIRDS
AND PLOTTING RADAR ORNITHOLOGICAL CHARTS
Dinevich L., Leshem Y.
George S. Wise Faculty of Natural Sciences, Dept. of Zoology, Tel-Aviv University, Ramat Aviv,
e-mail: dinevich@barak-online.net
The computerized radar ornithological sys-tem based on MRL-5 meteorological radar enables to perform automatic 24-hour monitoring of bird
taining both the meteorological and ornithological data made it possible to design an algorithm for plotting superposed weather and ornithological charts and to provide them every 15–20 min online to be used by air traffi c control services.
Introduction. The progress of aviation, high density of aircraft over relatively small areas (es-pecially in the vicinity of large airports), as well as striving for higher speeds using the lightest possible aircraft constructions – all these factors have inevi-tably created a confl ict between the technological advancement and the nature. The most serious man-ifestation of this confl ict is collisions between air-craft and birds (Ganja et al.,1991). The main routes of bird migration from Europe to Asia and Africa and back lie over Israel (Leshem and Yom-Tov, 1998). It was shown (Bruderer, 1992) that during the migration period the average number of birds over a cubic km of the air may exceed 500. As the airspace over Israel is also dense with aircraft, col-lisions are not rare during vigorous spring and au-tumn migrating bird fl ows, resulting in loss of bird life and sometimes human casualties (Bahat and Ovadia, 2005). Bird-aircraft collision are not rare in other regions (Thorpe, 2005). This situation calls for development of operational techniques aimed at assessment and control over the ornithological sta-tus in order to ensure air traffi c safety.
The main idea underlying the algorithm
Tables 1 and 1(a) present the typical character-istics of migrating birds’ radar echoes.
Table 1
Typical characteristics of radar echoes of migrating birds
Typical characteristics of radar echo Studies* – relatively low power. Refl ectance coeffi cient (Z < 30dBZ),
– forward and relatively linear movement
– maximum amplitude fl uctuations within the low frequency range (below 10 dB in 2–50 Hz frequency range).
– MRL-measured are greater on the 10 cm wave length than those on the 3 cm wavelength
– polarization characteristics of the signal are typical of horizontally-oriented targets. Differential refl ectance as the ratio of horizontally-oriented signal (with pulse horizontally polarized) to vertically-oriented signal (with pulse vertically polarized) exceeds the unity signifi cantly (dP = P׀׀/P┴ >> 1). For small droplets within clouds and precipitation this value is close to unity.
– in the wave-length range of 3 to 100 cm, of both birds and insects decrease noticeably as the radar wavelength increases. At the same time, there is a distinct maximum of the () frequency dependency that occurs at = 10 cm wave-length. – high dispersion of experimental data at = const (from few tens of cm2 at
= 3 см to = 10–1 cm2 at = 100 cm). σ values for some bird species with
wings folded are presented in Table 1(a).
– the mean -values of different bird spices at the value of radar wavelength from less than 10 cm2 (Sparrow) up to 400 сm2 (Albatross).
– -values of birds are approximately by order of 2–3 greater than -values of insects
Edwards, Houghton, 1959; Salman, Brilev, 1961; Schaefer, 1966;
Chernikov and Schupjatsky, 1967;
Skolnik. 1970; Chernikov, 1979; Bruderer and Joss, 1969; Bruderer, 1992;
Ganja et al. 1991; Buurma, 1999; Larkin
et al., 2002; Gudmundsson et al., 2002; Gauthreaux and
Belser, 2003; Zavirucha et al., 1977;
Zrnic and Ryzhkov, 1998.
Table 2
ESA (σ) values for various bird species with wings folded and bodies set at different angles relative to the radar
Bird species Dimensions of bird Side σ (m2) obtained at exposure to the radar at various anglesHead Tail
Rook 2,5·10–2 – –
Pigeon 1,0·10–2 1,1·10–4 1,0·10–4
Starling 2,5·10–3 1,8·10–4 1,3·10–4
House sparrow 7,0·10–4 2,5·10–5 1,8·10–5
ESA parameters of the same bird may vary as much as by factor of 10 depending on its orientation relative to the radar (Houghton, 1964; Bruderer and Joss, 1969). According to a study where ESA was measured in a anechoic chamber at different angles relative to the radar beam (Zavirucha et al., 1977), the maximum echo values were found within the range of 65–115° relative to the beam, which cor-responds to the bird’s lateral exposure (while 0° corresponds to the radar beam directed at the bird’s beak). In addition, ESA variations can be caused by the bird’s wingbeat. In these cases, the ESA values may increase up to 10-fold or drop almost to zero, the frequency of the fl uctuations reaching 2–24 Hz (Chernikov, 1979). Hence, ESA of a bird depends on its size, its orientation relative to the radar beam and on the instantaneous position of its beating wings. In the resent study, we managed to establish a number of other characteristics typical of bird echoes.
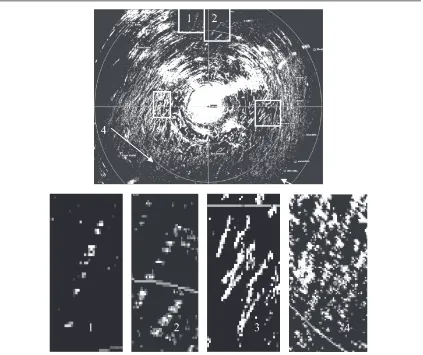
Fig. 1 shows the echo fi eld after computer pro-cessing of signals obtained from 18 scans, which has a distinct dot structure. Analysis of the photos shows that a major characteristic of a bird echo is movement, which leads to transforming the dot-made echoes into strips. The enlarged fragments of the strips (1, 2, 3, 4) demonstrate their straightfor-wardness. The increments to the strip length take place due to the transitional movement of an echo in time. Aspecial software designed as part of our study enabled to analyze the structure of 270 ran-domly selected echo strips. Each experimental strip was obtained over summation of 8 scans at a fi xed antenna vertical angle. The software enables to trace the process of strips’ formation from scan to scan. The fi ndings show that the recurrence of a bird echo at the same coordinate point (over 8 scans, the total duration of 80 s) in at least 90 % of cases does not exceed two. This result is due not only to the pattern of a bird fl ight, but also to the technical pa-rameters of the radar system, with its narrow pulse and the narrow symmetric beam. The recurrence of echoes from other refl ectors (ground clutter, clouds and some kinds of atmospheric inhomogeneities) follow a different pattern, with their echoes usually reoccurring over all of or most of the scans, and thus are easily fi ltered out. The only exception is heavily fl uctuating week signals refl ected from fri-able clouds and precipitations. In case the
concen-tration of such objects is relatively high, it creates an illusion of change in their spatial position, i.e. of a movement. At the same time, due to the origin and behavior of these objects, their typical feature is a chaotic character of the direction of adjacent echoes caused by the pseudo-movement. Hence, the vec-tors formed in the process are chaotically directed, in contrast to bird echoes.
The detailed description of the method for bird echo identifi cation against the background of other types of atmospheric echoes, as well as the technique for designing and plotting ornithological charts can be found in other papers by the authors (Dinevich and Leshem, 2007; 2008;2010; 2011). Examples of ornithological charts of different types are presented in Fig. 2–7. Fig. 8 shows the cloud echo chart. Fig. 9 features the external look of the radar and a group of school students who came to take a class in radar ornithology. Fig. 10 gives the internal view of the display booth of the radar orni-thological station.
On the potential development and increasing the accuracy of the system
1. The ratio of radar echo power at the two wavelengths
The ratio of radar echo power at the two wave-lengths of MRL-5 radar depends entirely on the pa-rameters of a target (Abshaev et al., 1980). Chernikov (1979) showed that the power of an insect echo at the 3 cm wavelength is twice as large as that at the 10-cm wavelength. This ratio is inverse for bird echo as well as for small-drop clouds and precipita-tion (Stepanenko, 1973). Therefore, the ratio of the two refl ection coeffi cients at the two wavelengths (ZdBZ3,2sm/ZdBZ10sm > 1 for “non-bird echo”) can serve as an additional indication while identifying bird echoes and eliminating false vectors.
2. Polarization parameters of a radar echo.
tg2θ = 2dP½ ΔP½ [dP½ – 1], where θ is the angle of
the orientation. It is important that the differential refl exivity value makes it possible to identify birds against the background of various atmospheric inhomogeneities whose nature does not imply formation of visible hydrometeors and whose dif-ferential refl exivity value is close to unity. As the differential refl exivity values of bird echoes is much larger than unity, it means that this feature of
desired signals. It was also shown (Dinevich et al., 1994) that differential refl exivity values of small drops are close to unity. Taking this into account, signals with parameters ≤ 30 dBZanddP≈ 1 are characteristic of small drop echoes, while signals with parameters ≤ 30 dBZanddP >> 1, in combi-nation with other typical characteristics (fl uctua-tion patterns, mobility in space etc.) are likely to be bird echoes.
Fig. 1. The echo fi eld after computer processing of signals obtained from 18 scans. 1,2,3 and 4 present enlarged fragments of the fi eld
3. Fluctuation characteristics of echo from various target refl ectors
On the basis of our research in fl uctuation pa-rameters of signals (Dinevich et al., 2004), a special device was designed that enables to analyze fl uc-tuation characteristics. With the antenna in the “halt mode” and within the preset 200 m-long strobe, the device analyzes each pulse to isolate the signal of the maximum amplitude and to store it in memo-ry, as well as to accumulate and plot the spectra of amplitude and frequency on the basis of 10–20 s samples. Given the frequency of MRL-5 sounding pulse (500 pulses per sec.), each sample contains
spectra of power changes and frequency of maxima repetitions for 5–10 thousand signals. A low-fre-quency fi lter that underwent special tuning enabled to separate fl uctuation amplitude spectra into “bird/ not bird” categories at the accuracy of at least 80 %. In cases when the signal is refl ected from a single bird the accuracy exceeds 95 %.
Conclusions
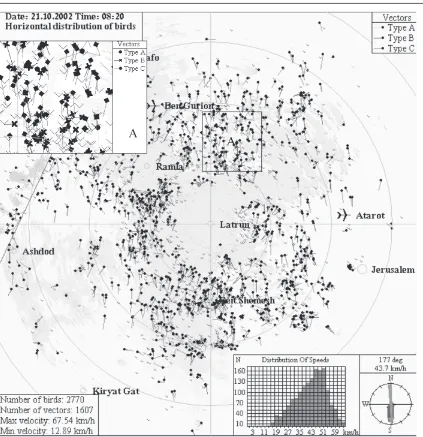
Fig. 2. Ornithological chart. Bird migration on October 21, 2002, 08.20 a.m. The actual charts are made in color. Vectors indicating the directions and velocities of bird fl ights (both single birds and fl ocks) are of three types and differ in colors. In the Figure, cloud and ground clutter refl ections are colored pale gray (blue color in actual charts). Fragment А presents an enlargement where all the three types of vectors are distinctly seen, representing different patterns of fl ights for various bird species. Charts of this type, as well as charts of vector distribution over height and bird volume distribution during seasonal migration, are sent online to air traffi c control operators every 15-20 min
– The technique of vector fi eld plotting enables to classify birds, on the basis of their movement patterns, into several categories, among them birds
fl ying with frequent shifts in fl ight direction (local birds), birds fl ying straightforwardly at steady ve-locities or at varying velocity, and those fl ying with repeating deviations from a straight line and at vari-able velocities.
– Radar ornithological charts plotted on the ba-sis of the algorithm data enable to obtain the
fol-lowing information within the area of 60 km radius from the radar position, including:
1) the total quantity of birds;
2) distribution of birds’ mass over height; 3) the spectra of fl ight directions and velocities, including the sum direction vector;
4) vector fi elds of bird movement juxtaposed with current meteorological status and local terrain;
observable atmospheric inhomogeneities and their parameters.
References
1. Abshayev M., Burtsev I., Vaksenburg S., Shevela G., 1980. Guide for use of the MRL-4, MRL5 and MRL-6 radars in urban protection systems. L., “Hydrometeoizdat”.
2. Bahat O. and Ovadia O., 2005. Minimizing Bird-Air-craft Collisons Caused by Resident Raptors in Israel. IBSC 27th
Meeting, Athens, Hellas, 23–27 May 2005. Р. 178.
3. Bruderer B. and Joss, 1969. Zur Registrierung and Inter-pretation von Echosingnaturen an enema 35 cm-Zielvervolgung-stradar. Orn. Beob., Bd 66, 70–88.
4. Bruderer B., 1992. Radar studies on bird migration in the
south of Israel. BSCE/21, Jerusalem, Р. 269–280.
5. Buurma, L., 1999. The Royal Netherlands Air Force: Two Decades of Bird Strike Prevention “En Route”. Internation-al Seminar on Birds and Flight Safety in the Middle East, Israel, April, 25 – 26, 1999. P. 71–83.
6. Chernikov A., 1979. Radar clear sky echoes. Leningrad,
Hydrometeoizdat, Р. 3–40.
7. Chernikov A., Schupjatsky A., 1967. Polarization char-acteristics of radar clear sky echoes. Transactions of USSR Academy of Sciences, atmosphere and ocean physics, Vol. 3,
№ 2, Р. 136–143.
8. Dinevich L., Kapitalchuk I., Schupjatsky A., 1994. Use of the polarization selection of radar signals for remote sounding of clouds and precipitation. 34 th Israel Annual conference on
Aerospace Science, Р. 273–277.
9. Dinevich L., Leshem Y., Pinsky M., Sterkin A., 2004. Detecting Birds and Estimating their Velocity Vectors by Means
of MRL-5 Meteorological Radar. J. The RING, 26 (2), Р. 35–53.
10. Dinevich L., Leshem Y., 2007. Algorithmic System for Identifying Bird Radio-Echo and Plotting Radar Ornithological Charts. J. The RING 29, (1–2): 3–39.
11. Dinevich L., Leshem Y., 2008. Селекция радиоэхо
перелётныхптиципостроениеорнитологическихкартпо
даннымрадиолокатораМРЛ-5. Advances in modern radioelec-tronics, Russian Academy of Sciences, Inst. for radio
engineer-ing and radioelectronics, Vol. 3, Р. 48–68. (RUS).
12. Dinevich, L., Leshem, Y., 2010. Radar monitoring of seasonal bird migration over Central Israel // J. The Ring. –
Vol. 32 (1–2). – Р. 31–53.
13. Dinevich, L., Leshem, Y., 2011. Accuracy and resolu-tion capacity of MRL-5 (Is) radar ornithological staresolu-tion and its
14. Advantages”. – Vol. 13. – № 1. – Р. 72–94.
Edwards J., Houghton E. W., 1959. Radar echoing area
po-lar. Diagrams of birds // Nature. – 184. – № 4692.
15. Gauthreaux, S.A. and C.G. Belser (2003). Radar
orni-thology and biological conservation. Auk 120(2), Р. 266–277.
16. Ganja I., Zubkov M., Kotjazi M., 1991. Radar ornithol-ogy, Stiinza, 123–145.
17. Gudmundsson, G.A., AlerstamT. , et al. (2002). Radar observations of Arctic bird migration at the Northwest Passage,
Canada. Arctic 55(1), Р. 21–43.
18. Larkin, R.P., W.R. Evans, et al. (2002). Nocturnal fl ight
calls of Dickcissels and Doppler radar echoes over south Texas
in spring // Journal of Field Ornithology, 73(1), Р. 2–8.
19. Leshem, Y., Yom-Tov Y. 1998. Routes of migrating
soaring birds. Ibis 140, Р. 41–52.
20. Leshem, Y., Yom-Tov Y.,1996. The use of thermals by soaring migrants in Israel. Ibis 138, 667–674.
21. Salman E, Brylev G., 1961. Radar echo from dielectric inhomogeneities of thermal nature.. Proc. Main Geophysic
Ob-servatory, № 120, Р. 37–44.
22. Skolnik, M., 1970. Radar Handbook. McGraw-Hill Book Company, 1970.
23. Schaefer G., 1966. The study of birds echo using a
tracking radar. Proc. 14th Int. Ornith. Cjngress. Oxford.
24. Shupiyatsky A., 1959. Radar dispersion by means of nonspherical particles. Pros of CAO, 30, pp. 39–52.(RUS).
25. Stepanenko V., 1973.. Radar in meteorology. Hydrome-teoizdat, Leningrad (RUS).
26. Thorpe J., 2005. Fatalities and Destroyed Civil Aircraft Due to Bird Strikes, 2002 to 2004 (with an Addendum of Animal
Strikes). IBSC 27th Meeting, Athens, Hellas, 23–27 May 2005.
pp. 17–24.
27. Zavirucha V., Saricev V., Stepanenko V, Shepkin U., 1977. Study of the dispersion characteristics of the meteorologi-cal and ornitologimeteorologi-cal objects in echo-free cameras. Proc. Main
Geophysic Observatory, № 395, Р. 40–45. (RUS)
28. Zrnic D.S. and Ryzhkov A.V. (1998). Observations of insects and birds with a polarimetric radar. Transactions on Geo-science and Remote Sensing, 36(2).