Received: 28 March 2012 / Revised: 28 August 2012 / Accepted: 16 October 2012 / Published online: 6 November 2012 ÓSpringer-Verlag Berlin Heidelberg and AWI 2012
Abstract This paper addresses the dynamics of the
pro-karyotic picoplankton community in the coastal and open sea areas of the central Adriatic and in the coastal area of the southern Adriatic. This involved the study, from January to December 2005, of bacteria (total number of non-pigmented bacteria; high nucleic acid content (HNA) bacteria; low nucleic acid content (LNA) bacteria), cya-nobacteria (Synechococcus and Prochlorococcus) and heterotrophic nanoflagellates. During the warmer seasons, in the mainly oligotrophic area under investigation into the Adriatic Sea, bacterial densities and bacterial production have shown an increase in values and domination of the LNA group of the bacterial population. In contrast, in those areas influenced by karstic rivers, the domination of HNA bacteria in total abundance of non-pigmented bacteria and high values of bacterial production was estimated throughout the investigated period. Our results show the importance of both HNA and LNA bacterial groups in the total bacterial activity throughout the investigated area. The biomass of bacteria was mostly predominant in the prokaryotic community, while within the autotrophic communitySynechococcus biomass mostly predominated. During the warmer seasons, an increase in autotrophic biomass was observed in relation to non-pigmented bio-mass. The importance of predation in controlling bacteria
by heterotrophic nanoflagellates was pronounced during the warmer period and in the coastal areas.
Keywords SynechococcusProchlorococcus
Heterotrophic bacteriaHNA LNAAdriatic Sea
Introduction
Non-pigmented bacteria and photosynthetic picoplankton are ubiquitous and represent numerous and active compo-nents of the marine ecosystem. Bacteria play an important role through their assimilation of dissolved organic matter (Cole et al. 1988) and by the decomposition of organic matter and through the transformation of inorganic com-pounds into forms suitable for primary producers (Ducklow et al. 1986). Photosynthetic picoplankton appears to be an essential component of marine ecosystems and one of their representatives, cyanobacteria Synechococcus (Waterbury et al. 1979) and Prochlorococcus (Chisholm et al. 1988) significantly contribute to phytoplankton biomass, espe-cially in oligotrophic areas like the Mediterranean Sea (Magazzu` and Decembri1995; Agawin and Agustı´1997). In addition, the application of flow cytometry has expanded the knowledge of the microbial community members and has permitted discrimination within cyanobacterial cells (SynechococcusandProchlorococcus) and non-pigmented bacterial cells based on different deoxyribonucleic acid content (Olson et al.1993; Gasol and Del Giorgio 2000). There is much literature concerning the distribution and dynamics of non-pigmented cells within the investigated area of the Adriatic Sea. A few reports ofSynechococcus and Prochlorococcus exist (Fuks et al. 2005; Nincˇevic´ et al. 2006; Radic´ et al. 2009; Sˇilovic´ et al. 2011; Sˇantic´ et al.2011), but simultaneous observations ofSynechococcus, Communicated by G. Gerdts.
D. Sˇantic´ (&)N. Krstulovic´M. Sˇolic´G. Kusˇpilic´ Institute of Oceanography and Fisheries,
P. O. Box 500, Split, Croatia e-mail: segvic@izor.hr
M. Ordulj
Prochlorococcus and non-pigmented bacteria are absent. The objectives of this study were to describe the seasonal cycles of non-pigmented prokaryotes, indicate the possible role of HNA and LNA bacteria in bacterial activity in the investigated areas, show the relationship between bio-masses of autotrophic and non-pigmented prokaryotes and identify the role of heterotrophic nanoflagellates in controlling the bacterial population.
Materials and methods
Study area
The Adriatic Sea is the northernmost basin in the Medi-terranean, 800 km long and 200–250 km wide. Bathymetry divides the basin into three parts: a broad northern Adriatic shelf with an average depth of 40 m, the central Adriatic with depressions as deep as 280 m, and connected to the southern Adriatic circular basin over the Palagruzˇa Sill. The coastal area investigated is located in the central and southern Adriatic basin, covering the coastal zone from Zadar to Dubrovnik and is partly under the influence of the karstic rivers: Krka (Sˇibenik area), Jadro (Kasˇtela Bay), Zˇ rnovnica, Cetina (Split area), Neretva (Plocˇe area) and Trebisˇnjica (Dubrovnik area). In the open sea, samples were collected from station CA001 located in the Jabuka Pit, CA003 located in the open sea area of Sˇibenik and at station CA009 located near the island of Vis (Fig.1). Sampling
Sampling was mostly at monthly intervals from January 2005 to December 2005 on RV Bios using Niskin bottles (5 l). Samples were collected at several depths between the surface and the bottom (at 5- to 10-m intervals for the upper 50 m and at 75, 100, 168, 200 and 260 m at deepest station). A SeaBird 25 CTD profiler recorded temperature and salinity data. Nutrient concentrations (NO3-, NO2-, NH4?, total dissolved inorganic nitrate/DIN/and soluble reactive phosphate/SRP) were determined using the auto-analyser modified method by Grasshof (1976).
Flow cytometry
Abundances ofSynechococcus, Prochlorococcusand non-pigmented bacteria were determined using flow cytometry (Marie et al. 1997). For flow cytometry counts of auto-trophic cells, 2 ml of preserved samples in 0.5 % gluter-aldehyde was frozen at -80°C and stored until analysis (5–10 days), while samples for bacteria were preserved in 2 % formaldehyde and stored at 4°C until analysis (5–10 days).
Abundances of SybrGreen I-stained non-pigmented bacteria were determined using flow cytometry (Marie et al. 1997). Samples of 1 ml without replicas were ana-lysed on a Beckman Coulter EPICS XL-MCL with a high flow rate from 1 to 1.2lL s-1, and the analysed volume was calculated by acquisition time. To standardise the fluorescence intensity of the cells, 1.0-lm yellow-green beads were added (Level-III Epics Division of Coulter Corporation Hialeah, Florida). Two groups of bacteria were distinguished according to their relative green fluorescence as a proxy for the nucleic acid content (Jochem 2001), referred to as high nucleic acid (HNA) and low nucleic acid bacteria (LNA) and light scattering.
Autotrophic cells were separated into two groups of cyanobacteria (Synechococcus and Prochlorococcus) and were distinguished according to light scattering, red emission of cellular chlorophyll content and orange emis-sion of phycoerythrin-rich cells. Biomasses of Synecho-coccus, Prochlorococcus and heterotrophic bacteria were calculated by using the following volume-to-carbon con-version factors: 250 fg C cell-1 for Synechococcus, 53 fg C cell-1forProchlorococcusand 20 fg C cell-1for non-pigmented bacteria (Zhang et al. 2008).
Bacterial cell production was measured from DNA synthesis based on incorporation rates of 3H-thymidine (Fuhrman and Azam 1982). Conversion factors (CF) for bacterial production were calculated from bacterial cell numbers and 3H-thymidine incorporation during bacterial growth in 1-lm pre-filtered seawater (Riemann et al. 1987): CF=(N2-N1)/3H where N1and N2are the num-bers of bacteria at the beginning and the end of the experiment, and 3H is the integrated3H-thymidine incor-poration rate during the experiment. The number of het-erotrophic nanoflagellates (HNF) was estimated using epifluorescence microscopy. Samples were stained with 40-6-diamidino-2-phenylindole (DAPI) for 10 min and fil-tered through polycarbonate filters with 0.8lm pore diameters (Milipore, Ireland). Microscope slides were examined with an Olympus microscope under UV light at a magnification of 1,000X (Porter and Feig 1980).
Methods for determination of regulation mechanisms in the prokaryotic community
Relationships between abiotic and biotic factors and the abundance of autotrophic and heterotrophic prokaryotes were determined using the Pearson’s rank correlation index.
between bacterial and HNF abundance. The graph includes an empirically determined maximum attainable abundance (MAA) line (based on a large database from a variety of systems) depicting the HNF abundance that could be attained at a given bacterial abundance (max log HNF= -2.47?1.07 log bacterial abundance) and a mean rea-lised abundance (MRA) line. The points close to the MAA line indicate strong coupling between the bacteria and HNF, which according to Gasol (1994), could be interpreted as strong predation on the bacteria. The points that lie well below the MRA line indicate conditions when bacterial abundance was not controlled by HNF grazing. Therefore, distance (D) values (differences between the maximum and realised HNF abundances at different bacterial concentra-tions) represent a good indicator of the importance of HNF predators in controlling bacterial abundance. The distance (D) between the maximum and actual measured HNF abundance, for each bacterial abundance value, shows the
degree of uncoupling between bacteria and their predators and is surrogate for the grazing pressure of HNF on bacteria. Low D values mean strong coupling between the abundance of bacteria and HNF, while high D values mean no or low coupling between bacteria and HNF.
Results
Physicochemical conditions of seawater
extent, the rivers Jadro, Zˇ rnovnica, Cetina and Neretva (Morovic´ et al. 2006). Nitrates and nitrites in the investi-gated areas showed increased values in January to February and in December. Values of soluble reactive phosphates at the coastal sea stations were uniform during the isothermal and stratified periods. The highest concentration of ammonium in the coastal areas was detected in November, but high values were also recorded in May and August. In the open sea areas, slightly increased values of ammonium were detected in the period from April to May. Increased values of chlorophyllawere determined in the period from September to December with higher concentrations in coastal areas compared with the open sea (Table1).
Abundance of non-pigmented bacteria
Average monthly abundance of bacteria, obtained as the average value from the surface to the bottom layers of the investigated stations, ranged from 0.249106 to 1.39106cells mL-1 in the central and southern coastal areas and in the open sea ranged from 0.239106 to 0.639106cells mL-1 (Fig.2). Seasonal distribution of non-pigmented bacteria in the coastal areas has shown an increased abundance during the warmer seasons and lower abundance during the colder seasons, with pronounced variations in bacterial densities in relation to open sea area (Fig.2). Comparing all investigated areas, the highest numbers of non-pigmented bacteria were found in the Kasˇtela Bay area (Table2).
Percentage of HNA bacteria in the community of non-pigmented bacteria
The average monthly percentage of HNA bacteria in the central and southern coastal areas ranged from 26 to 83 %, while in the open sea HNA ranged from 28 to 65 %. Dif-ferent temporal patterns were found for HNA and therefore for LNA bacterial groups. Seasonal distribution mostly showed the prevalence of the HNA group during the colder seasons and a prevalence of LNA bacteria, or equal pro-portions of the LNA and HNA groups, in the bacterial community during spring and summer. However, a prev-alence of the HNA group in the bacterial community dur-ing all four seasons was found in the coastal areas directly influenced by rivers (Fig.3), specifically in the Kasˇtela Bay (Jadro) and Sˇibenik areas (Krka). Comparing the investigated areas with the annual average, variations in the proportion of HNA bacteria were mostly more pronounced in the coastal sea areas compared with the open sea area. The annual average at the open sea stations CA001 and CA003 showed percentages of HNA bacteria less than 50 % (Table2).
Table 1 Mean monthly value with standard deviation ( ± ) o f temperature ( ° C), salinity, nutrient concentrations ( l M) and chlorophyll a (mg m -3 ) at coastal and open sea area Complete data set Coastal sea N = 370 Open sea N = 148 Month I II III IV V V I VII VIII IX X X I XII Temperature ( ° C) Coastal sea 13.47 ± 1.59 11.16 ± 0.57 10.61 ± 0.86 13.30 ± 1.17 17.18 ± 1.93 18.72 ± 2.74 19.81 ± 3.47 19.30 ± 3.42 21.27 ± 1.55 20.28 ± 1.82 17.55 ± 1.74 15.10 ± 1.30 Open sea 14.86 ± 0.29 13.38 ± 0.52 13.50 ± 0.24 15.22 ± 0.80 16.67 ± 1.97 16.78 ± 3.72 18.11 ± 3.51 17.81 ± 4.59 17.44 ± 3.75 18.41 ± 1.69 18.02 ± 1.35 15.72 ± 0.33 Salinity Coastal sea 37.11 ± 4.02 37.71 ± 0.69 37.35 ± 1.07 37.16 ± 0.86 36.73 ± 3.63 37.26 ± 3.28 37.61 ± 1.10 37.40 ± 2.24 37.78 ± 1.77 38.03 ± 0.90 37.24 ± 4.14 36.09 ± 6.36 Open sea 38.58 ± 0.26 38.65 ± 0.22 38.71 ± 0.01 38.19 ± 0.71 38.55 ± 0.36 38.68 ± 0.19 38.59 ± 0.32 38.67 ± 0.34 38.78 ± 0.15 38.65 ± 0.10 38.66 ± 0.07 38.54 ± 0.12 Nitrate ( l M) Coastal sea 3.53 ± 6.88 1.04 ± 0.60 1.35 ± 0.71 0.36 ± 0.29 0.74 ± 2.85 0.40 ± 1.13 0.64 ± 1.08 0.92 ± 1.47 0.82 ± 1.63 1.00 ± 2.10 2.24 ± 5.87 4.08 ± 9.58 Open sea 2.03 ± 0.47 1.30 ± 0.81 0.71 ± 0.19 0.32 ± 0.37 0.64 ± 0.63 0.30 ± 0.59 0.49 ± 0.26 0.95 ± 0.72 0.77 ± 0.78 0.46 ± 0.65 0.35 ± 0.22 0.47 ± 0.19 Nitrite ( l M) Coastal sea 0.29 ± 0.18 0.37 ± 0.24 0.16 ± 0.10 0.11 ± 0.07 0.10 ± 0.06 0.05 ± 0.03 0.04 ± 0.05 0.07 ± 0.10 0.10 ± 0.17 0.09 ± 0.19 0.16 ± 0.17 0.25 ± 0.15 Open sea 0.19 ± 0.12 0.21 ± 0.09 0.16 ± 0.05 0.13 ± 0.06 0.10 ± 0.02 0.09 ± 0.02 0.10 ± 0.03 0.07 ± 0.06 0.05 ± 0.03 0.05 ± 0.05 0.06 ± 0.04 0.13 ± 0.02 Ammonium ( l M) Coastal sea 1.12 ± 0.54 0.80 ± 0.35 0.68 ± 0.22 1.27 ± 0.27 1.62 ± 2.89 0.59 ± 0.28 0.69 ± 0.72 2.05 ± 3.75 0.79 ± 0.52 0.68 ± 0.33 5.06 ± 9.37 1.18 ± 0.73 Open sea 1.25 ± 0.33 0.95 ± 0.41 0.79 ± 0.32 1.58 ± 0.32 1.17 ± 0.65 0.57 ± 0.35 0.60 ± 0.45 0.56 ± 0.45 0.43 ± 0.32 0.65 ± 0.12 0.41 ± 0.18 0.91 ± 0.39 Soluble reactive
phosphate-SRP (l
Relationship of bacterial production
and the contribution of HNA bacterial group
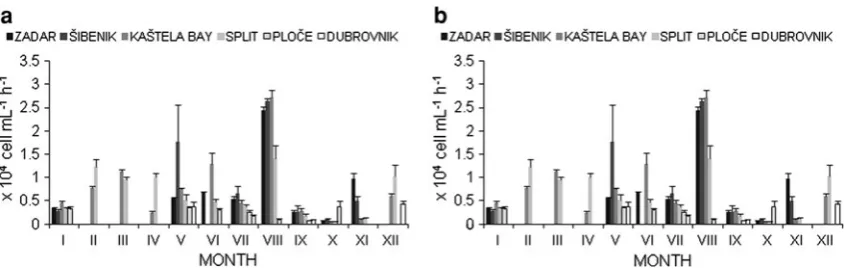
The average monthly values of bacterial production in the central and southern coastal areas ranged from 0.039104 to 2.89104 cells mL-1h-1 and in the open sea ranged from 0.069104 to 2.719104 cells mL-1h-1 (Fig.4). Seasonal distribution of bacterial production in the coastal areas from Zadar to Split shows increased bacterial pro-ductivity during the summer. The second highest values were found in the area of Sˇibenik during the spring and in the area of Split during the winter. In the area of Plocˇe, high values of bacterial production were found in January and December. In the southern coastal region, increased bacte-rial production was determined during the seasons of spring and autumn. Distribution at the open sea stations CA001 and CA003 showed increased bacterial productivity in the spring and at CA009, during winter and autumn (Fig.4).
Comparing the investigated areas with the annual average, variations in bacterial production in the coastal and open sea areas were more pronounced in the area influenced by rivers Krka (Sˇibenik area) and less pro-nounced in the southern part of coastal sea (Table2).
In order to examine bacterial activity, this study observed bacterial productivity in relation to seasonal distribution of
the HNA and LNA bacterial groups. The analysis of these two bacterial groups in relation to bacterial productivity in the coastal and open sea regions showed a simultaneous increase in the percentage of the LNA group and bacterial production (Figs.3, 4). However, exceptions with a prev-alence of the HNA group in the bacterial community during the highest values of bacterial productivity were found in those areas influenced by the Krka and Jadro Rivers (Figs. 3,4). A comparison of all of the investigated areas of the one-year survey showed that the HNA bacterial group was dominant in the bacterial population in coastal areas over values of bacterial production ranging from 0.279104 to 0.899104cells mL-1h-1. However, in the open sea areas, the LNA bacterial group was mostly prevalent in the bacterial population over values of bacterial production ranging from 0.539104 to 0.899104cells mL-1h-1 (Table2).
Biomass of non-pigmented bacteria in relation to biomasses ofSynechococcusandProchlorococcus The biomass of the prokaryotic community throughout the studied area was mainly dominated by non-pigmented prokaryotes, except during the spring in the Dubrovnik area and during winter at the open sea station CA003, when the Fig. 2 Seasonal fluctuations of non-pigmented bacteria.aCoastal areasbopen sea station. Average values (column,line with markers) and positive standard error (bars) are presented. The missing sampling points show that there was no sampling
biomass of autotrophic prokaryotes predominated over non-pigmented prokaryotes (Fig.5). Average seasonal values of non-pigmented prokaryotic biomass in the coastal area ranged from 7.87 to 22.27lgC L-1 and in the open sea from 4.60 to 9.60lgC L-1. The values of the bio-masses as well as their abundances showed seasonality, mostly demonstrating higher values during the warmer seasons (Fig.5).
Influencing factors on prokaryotic picoplankton
In the investigated area, correlations between bacterial parameters with temperature and inorganic nutrients were weak or not statistically significant (Table3). The rela-tionship between HNF as a main predator of bacteria and the bacteria was described by distance points (D) obtained by the Gasol model (1994). Thus, lower D values show higher predation pressure and vice versa. Results indicate that the impact of HNF was more pronounced during the warmer season (Fig.6). Comparing coastal and open sea areas, the strongest associations between HNF and the bacteria were found in the coastal areas of Sˇibenik, Plocˇe and Dubrovnik (Fig.6).
In addition to a predator–prey relationship, other rela-tionships within the prokaryotic community in the study area were also identified. In both thermal conditions of the water column, bacterial abundance was positively corre-lated with Prochlorococcus abundance (Table3). During colder periods, in the coastal sea areas, a positive correla-tion between bacterial abundance and concentracorrela-tion of chlorophyll a (chl a) was determined. During warmer periods, in the open sea areas, a negative correlation between bacterial production and concentration of chl a was observed.
Discussion
The abundance of non-pigmented bacteria in most parts of the study area was lower than 106cells mL-1. According to bacterial density, the investigated area of the Adriatic Sea is mainly oligotrophic (Cotner and Biddanda 2002). The exceptions are those areas under direct influence of the Rivers Krka (Sˇibenik area) and Jadro (Kasˇtela Bay), where abundances of non-pigmented bacteria were more than 106 cells ml-1. The obtained values of chlorophyllawere in a range from 0.02 to 4.73 chla m-3with the highest values in Kasˇtela Bay (1.53 chla m-3) and the Sˇibenik area (4.73 chl am-3), which describes the investigated area as mostly oligotrophic with mesotrophic and eutrophic parts (Marasovic´ et al.2006). During the investigation, seasonal distribution in the bacterial community in the coastal areas was determined with maxima in the spring–summer period
and minima during the winter, which confirms previous reports on the central Adriatic (Krstulovic´1992; Sˇolic´ et al. 2001). Seasonal distribution of non-pigmented bacteria at the open sea stations was not as pronounced as the seasonal distributions of bacteria in the Bay of Biscay (Calvo-Dı´az and Mora´n2006).
Generally, within the bacterial community, the HNA group predominated in eutrophic and mesotrophic areas, whilst the LNA group predominated in oligotrophic envi-ronments (Zubkov et al. 2004; Mora´n et al. 2007). The predominance of the LNA group in oligotrophic conditions can be explained by the high surface area to volume ratio of the cell (Button 1998; Jochem et al. 2004), which facilitates successful survival in poor conditions. However, the prevalence of an individual bacterial group in different environmental conditions could be the result of different life strategies. Members of the HNA bacterial group with large genomes are able to cope with a wide variety of environmental conditions, whilst the LNA group with a small genome occupy narrow ecological niches (Schattenhofer et al.2011). In this paper, the domination of the HNA bacterial group in the bacterial community was established in areas that have a high trophic level and which are directly influenced by rivers. Thus, our finding is consistent with other research that found that rivers directly influence the dominance of the HNA over the LNA group in eutrophic areas (Li et al.1995; Sˇolic´ et al.2009). Fur-thermore, the annual average of the investigated oligo-trophic open sea stations showed percentages of HNA bacteria below 50 %. This is in accordance with the pre-dominance of the LNA group over HNA, which has also been established for other oligotrophic areas, such as the Celtic Sea, Gulf of Mexico and the Atlantic (Zubkov et al. 2001; Jochem et al.2004; Andrade et al.2007).
The seasonal distribution in all investigated oligotrophic areas showed the dominance of the LNA group in the bacterial community mostly during the summer season and dominance of the HNA group during the colder seasons, as described previously in the literature (Gre´gori et al.2001;
Calvo-Dı´az and Mora´n 2006). The domination of LNA cells during the warmer seasons can be attributed to selective grazing (Sˇimek and Chrzanowski 1992; Ju¨rgens and Matz 2002), or better adaptation to oligotrophic con-ditions (Kjelleberg et al.1993).
Historically, it was thought that the HNA bacteria were the active part of the microbial community, and the LNA were the inactive or dead part (Zweifel and Hagstro¨m 1995; Gasol and Mora´n 1999), and recent studies have confirmed the importance of the activity of the HNA group in the NW Mediterranean Sea (Me´vel et al. 2008). How-ever, a number of papers have shown that the LNA group also contributes to the activity of bacterioplankton in the marine ecosystem (Gre´gori et al.2001; Li and Dickie2001; Zubkov et al. 2001; Jochem et al. 2004). Some authors have also shown that the LNA group successfully con-sumes nutrients and amino acids (Zubkov et al.2006; Mary et al. 2006) and demonstrates a high-specific growth rate that can exceed the growth rate of HNA bacteria in oli-gotrophic conditions (Longnecker et al.2005; Mary et al. 2006). In this study, bacterial activity was observed through seasonal distribution of bacterial productivity in relation to the percentage of the HNA and LNA bacterial groups. At the same time, it was determined that LNA values were higher than 50 % with increased values of bacterial production, which is consistent with previous results from the Atlantic (Mora´n et al.2002,2004). How-ever, in the areas directly influenced by karstic rivers, the HNA bacterial group was dominant throughout the study as well as in areas directly influenced by inflowing rivers (Casotti et al. 2000; Jochem et al. 2004) during all four seasons, as reported by Longnecker et al. (2006). Our results indicate the relative importance of both bacterial groups in bacterial production and activity.
non-pigmented prokaryotes. Analysis of biomass in the prokaryotic community usually shows an increase of autotrophic picoplankton biomass in investigated sites, as well as in some research areas of the Mediterranean Sea, during the warmer season (Agawin et al.2000). In relation to coastal areas, an increase of autotrophic prokaryotic
biomass was found in the open sea as well as in the Mediterranean Sea (Magazzu` and Decembri1995). Within the autotrophic fraction, it was found that Synechococcus biomass as well as abundance predominated over Pro-chlorococcus, as reported in the literature for the summer period in the surface layers of the Mediterranean Sea (Llabre´s et al.2010). This can be compared with data from the Coral Sea (Crosbie and Furnas 2001), Pacific and the Atlantic (Zhang et al. 2008). However, our results are contrary to those from different regions of the Mediterra-nean Sea (Mella-Flores et al.2011), where abundances of Prochlorococcus mostly predominated over Synechococ-cus.The difference in domination of Synechococcus over the Prochlorococcus densities in the investigated areas of the Adriatic Sea could be explained by the fact that gen-erally genus Synechococcus is known as a eurythermal organism (Waterbury et al. 1986; Shapiro and Haugen 1988; Neuer1992). It is adapted on water-column mixing (Lindell and Post 1995) and is able to consume different types of nitrogen and phosphorus sources, which possibly gives it an advantage over genus Prochlorococcus in the coastal study area of the Adriatic Sea.
Our results show that predation has an important role in the observed seasonal and spatial distributions of non-pig-mented bacteria. We identified changes in the degree of predation as a type of control on the seasonal scale, in the coastal areas where bacteria were more controlled by HNF during the warmer period, as also reported by Sˇolic´ et al. (2009). On the spatial scale, our results show the strongest correlation between bacteria and HNF in the coastal area, especially in the region of Sˇibenik and Plocˇe, which is described as the area richest in nutrients (Cetinic´ et al.2006; Svensen et al.2007; Sˇolic´ et al.2008). Our obtained results agree with Hobbie and Cole (1984) who highlighted the impact of predation by HNF in nutrient-rich environments. Fig. 6 Relationship between HNF and heterotrophic bacteria abun-dance according D values
In oligotrophic ecosystems, bacterial abundance is mostly controlled by the supply of nutrients (Cole et al. 1988; Ducklow1992). According to the literature, the cor-relation between bacteria and phytoplankton excretion, like food source, is well known (Carlson et al.1996; Kirchman and Rich1997). Similar correlations with the concentration of chlorophyll a determined in this paper have also been reported in previous papers for the oligotrophic central Adriatic (Krstulovic´ et al.1997; Sˇestanovic´ et al.2004). The very weak relationship between bacteria and inorganic nutrients obtained in this paper could be explained by the fact that, during the investigated period, the warmer and more saline Levantine Intermediate Water influenced the deep waters in the eastern middle Adriatic Sea. This brings higher concentrations of inorganic nutrients (Sˇolic´ et al. 2008), and therefore, bacterial expansion was not limited by low concentrations of inorganic nutrients.
Conclusions
The proportions of HNA bacteria in total abundance of non-pigmented bacteria were highest in those areas with the highest bacterial production (in the areas influenced by karstic rivers) and the higher bacterial densities, during all investigated seasons. In oligotrophic areas, the LNA group dominated for a period of high bacterial production, indicating the importance of both bacterial groups in bacterial production and activity. The biomass of non-pigmented prokaryotes was mostly predominant in the prokaryotic community. Within the autotrophic community, Synechococcusbiomass mostly predominated. Predation of
heterotrophic bacteria by HNF was pronounced during the warmer period in the coastal areas.
Acknowledgments This research was supported by the Croatian Ministry of Science, Education and Sport as part of the research program ‘Role of plankton communities in the energy and matter flow in the Adriatic Sea ’(project no 001-0013077-0845), also thank Barbara Zorica and Ivan Vucˇic´ to help.
References
Agawin NSR, Agustı´ S (1997) Abundance, frequency of dividing cells and growth rates of Synechococcus sp. (cyanobacteria) in the stratified Northwest Mediterranean Sea. J Plankton Res 19:1599–1615
Agawin NSR, Duarte CM, Agustı´ S (2000) Nutrient and temperature control of the contribution of picoplankton to phytoplankton biomass and production. Limnol Oceanogr 45:591–600 Andrade L, Gonzales AM, Rezende CE, Suzuki M, Valentin JL,
Paranhos R (2007) Distribution of HNA and LNA bacterial groups in the Southwest Atlantic Ocean. Braz J Microbiol 38:330–336 Button DK (1998) Nutrient uptake by microorganisms according to
kinetic parameters from theory as related to cytoarchitecture. Microbiol Mol Biol Rev 62:636–645
Calvo-Dı´az A, Mora´n XAG (2006) Seasonal dynamics of picoplank-ton in shelf waters of the southern Bay of Biscay. Aquat Microb Ecol 42:159–174
Carlson CA, Ducklow HW, Sleeter TD (1996) Stocks and dynamics of bacterioplankton in the northwester Sargasso Sea. Deep-Sea Res II 4:491–516
Casotti R, Brunet C, Aronne B, D’Alcala` MR (2000) Mesoscale features of phytoplankton and planktonic bacteria in a coastal area as induced by external water masses. Mar Ecol Prog Ser 195:15–27
Cetinic´ I, Vilicˇic´ D, Buric´ Z, Olujic´ G (2006) Phytoplankton seasonality in a highly stratified karstic estuary (Krka, Adriatic Sea). Hydrobiologia 555:31–40
Open sea,N=45,P\0.05 (isothermal period)
Pearson correlation with B 0.19 -0.13 -0.26 0.22 0.10 -0.10 0.51 0.21 Pearson’s correlation with BP 0.44 -0.06 -0.53 -0.26 -0.04 0.09 -0.14 0.68 Open sea,N=103,P\0.05 (stratified period)
Pearson’s correlation with B 0.14 -0.18 -0.32 -0.02 0.22 -0.27 0.29 -0.08 Pearson’s correlation with BP -0.12 -0.06 -0.27 0.07 -0.04 -0.07 -0.02 -0.38
Chisholm SW, Olson RJ, Zettler ER, Waterbury JB, Goericke R, Welschmeyer N (1988) A novel free-living prochlorophyte occurs at high cell concentrations in the oceanic euphotic zone. Nature 334:340–343
Cole JJ, Findlay S, Pace ML (1988) Bacterial production in fresh and saltwater ecosystems: a cross-system overview. Mar Ecol Prog Ser 43:1–10
Cotner JB, Biddanda BA (2002) Small players, large role: microbial influence on auto-heterotrophic coupling and biogeochemical processes in aquatic ecosystems. Ecosystems 5:105–121 Crosbie ND, Furnas MJ (2001) Abundance, distribution and
flow-cytometric characterization of picophytoprokaryote populations in central (17°S) and southern (20°S) shelf waters of the Great Barrier Reef. J Plankton Res 23:809–828
Ducklow HW (1992) Factors regulating bottom-up control of bacterial biomass in open ocean plankton communities. Archiv fu¨r Hydrobiologie, Organ der Internationalen Vereinigung fu¨r Theoretische und Angewandte Limnologie, Beihefte. Ergebnisse der Limnologie 37:207–217
Ducklow HW, Purdie DA, Williams PJL, Davis JM (1986) Bacte-rioplankton: a sink for carbon in a coastal marine plankton community. Science 232:865–867
Fuhrman JA, Azam F (1982) Thymidine incorporation as a measure of heterotrophic bacterioplankton production in marine surface waters. Mar Biol 66:109–120
Fuks D, Radic´ J, Radic´ T, Najdek M, Blazˇina M, Degobbis D, Smodlaka N (2005) Relationships between heterotrophic bacte-ria and cyanobactebacte-ria in the northern Adbacte-riatic in relation to the mucilage phenomenon. Sci Total Environ 353:178–188 Gasol JM (1994) A framework for the assessment of top-down vs.
bottom-up control of heterotrophic nanoflagellates abundance. Mar Ecol Prog Ser 113:291–300
Gasol JM, Del Giorgio PA (2000) Using flow cytometry for counting natural planktonic bacteria and understanding the structure of planktonic bacterial communities. Sci Mar 64:197–224 Gasol JM, Mora´n XAG (1999) Effects of filtration on bacterial
activity and picoplankton community structure as assessed by flow cytometry. Aquat Microb Ecol 16:251–264
Grasshof K (1976) Methods of seawater analysis. Verlag Chemie, Weinhein
Gre´gori G, Citterio S, Ghiani A, Labra M, Scorbati SB, Denis M (2001) Resolution of viable and membrane-compromised bac-teria in fresh water and marine waters based on analytical flow cytometry and nucleic acid double staining. Appl Environ Microbiol 67:4662–4670
Hobbie JE, Cole JJ (1984) Response of a detrital foodweb to eutrophication. B Mar Sci 35:357–363
Jochem FJ (2001) Morphology and DNA content of bacterioplankton in the northern Gulf of Mexico: analysis by epifluorescence microscopy and flow cytometry. Aquat Microb Ecol 25:179–194 Jochem FJ, Lavrentyev PJ, First MR (2004) Growth and grazing rates of bacteria groups with different apparent DNA content in the Gulf of Mexico. Mar Biol 145:1213–1225
Ju¨rgens K, Matz C (2002) Predation as a shaping force for the phenotypic and genotypic composition of planktonic bacteria. Antonie Leeuwenhoek 81:413–434
Kirchman DL, Rich JH (1997) Regulation of bacterial growth rates by dissolved organic carbon and temperature in the equatorial Pacific Ocean. Microb Ecol 33:11–20
Kjelleberg S, Albertson N, Flaerdh K, Holmquist L, Jouper-Jaan A, Marouga R, Oestling J, Svenblad B, Weichart D (1993) How do nondifferentiating bacteria adapt to starvation? Antonie Leeu-wenhoek 63:333–341
Krstulovic´ N (1992) Bacterial biomass and production rates in the central Adriatic. Acta Adriat 33:49–65
Krstulovic´ N, Sˇolic´ M, Marasovic´ I (1997) Relationship between bacteria, phytoplankton and heterotrophic nanoflagellates along the trophic gradient. Helgo¨l Mar Res 51:433–443
Li WKW, Dickie PM (2001) Monitoring phytoplankton, bacterio-plankton and viriobacterio-plankton in a coastal inlet (Bedford Basin) by flow cytometry. Cytometry 44:236–246
Li WKW, Jellett JF, Dickie PM (1995) DNA distribution in planktonic bacteria stained with TOTO or TO-PRO. Limnol Oceanogr 40:1485–1495
Lindell D, Post AF (1995) Ultraphytoplankton succession is triggered by deep winter mixing in the Gulf of Aqaba (Eilat), Red Sea. Limnol Oceanogr 40:1130–1141
Llabres M, Agustı´ S, Alonso-Laita P, Herndl GJ (2010)
Synechococ-cusandProchlorococcuscell death induced by UV radiation and
the penetration of lethal UVR in the Mediterranean Sea. Mar Ecol Prog Ser 399:27–37
Longnecker K, Sherr BF, Sherr EB (2005) Activity and phylogenetic diversity of bacterial cells with high and low nucleic acid content and electron transport system activity in an upwelling ecosystem. Appl Environ Microb 71:7737–7749
Longnecker K, Sherr BF, Sherr EB (2006) Variation in cell-specific rates of leucine and thymidine incorporation by marine bacteria with high and with low nucleic acid content off the Oregon coast. Aquat Microb Ecol 43:113–125
Magazzu` G, Decembri F (1995) Primary production, biomass and abundance of phototrophic picoplankton in the Mediterranean Sea: a review. Aquat Microb Ecol 9:97–104
Marasovic´ I, Nincˇevic´-Gladan Zˇ , skejic´ S, Buzˇancˇic´ M (2006) Biolosˇke osobine u Kusˇpilic´ G i sur. Kontrola kakvoc´e obalnog mora (Projekt Vir-Konavle 2005). Studije i elaborati Instituta za oceanografiju i ribarstvo, Split, pp 68–81
Marie D, Partensky F, Jacquet S, Vaulot D (1997) Enumeration and cell cycle analysis of natural populations of marine picoplankton by flow cytometry using the nucleic acid stain SYBR Green I. Appl Environ Microb 63:186–193
Mary I, Heywood JL, Fuchs BM, Amann R, Burkill PH, Tarran GA, Zubkov MV (2006) SAR11 dominance among metabolically active low nucleic acid bacterioplankton in surface waters along an Atlantic meridional transect. Aquat Microb Ecol 45:107–113 Mella-Flores D, Mazard S, Humily F et al (2011) Is the distribution of
ProchlorococcusandSynechococcusecotypes in the
Mediterra-nean Sea affected by global warming? Biogeosciences 8:2785– 2804
Me´vel G, Vernet M, Goutx M, Ghiglione JF (2008) Seasonal to hour variation scales in abundance and production of total and particle-attached bacteria in the open NW Mediterranean Sea (0–1000 m). Biogeosciences 5:1573–1586
Mora´n XAG, Gasol JM, Pedro´s-Alio´ C, Estrada M (2002) Partitioning of phytoplanktonic organic carbon production and bacterial production along a coastal-offshore gradient in the NE Atlantic during different hydrographic regimes. Aquat Microb Ecol 29:239–252
Mora´n XAG, Ferna´ndez E, Pe´rez V (2004) Size-fractionated primary production, bacterial production and net community production in subtropical and tropical domains of the oligotrophic NE Atlantic in autumn. Mar Ecol Prog Ser 274:17–29
Mora´n XAG, Bode A, Sua´rez LA´ , Nogueira E (2007) Assessing the relevance of nucleic acid content as an indicator of marine bacterial activity. Aquat Microb Ecol 46:141–152
Morovic´ M i sur (2006) Fizikalne i kemijske osobine u Kusˇpilic´ G i sur. Kontrola kakvoc´e obalnog mora (Projekt Vir-Konavle 2005). Studije i elaborati Instituta za oceanografiju i ribarstvo, Split, pp 29–46
Riemann B, Bjorsen PK, Newell S, Fallon R (1987) Calculation of cell production of coastal marine bacteria based on measured incorporation of (H)thymidine. Limnol Oceanogr 32:471–476 Sˇantic´ D, Krstulovic´ N, Sˇolic´ M, Kusˇpilic´ G (2011) Distribution of
SynechococcusandProchlorococcusin the central Adriatic Sea.
Acta Adriatic 52:101–114
Schattenhofer M, Wulf J, Kostadinov I, Glo¨ckner FO, Zubkov MV, Fuchs BM (2011) Phylogenetic characterisation of picoplank-tonic populations with high and lownucleic acid content in the North Atlantic Ocean. Syst Appl Microbiol 34:470–475 Sˇestanovic´ S, Sˇolic´ M, Krstulovic´ N, Nincˇevic´ Zˇ (2004) Seasonal and
vertical distribution of planktonic bacteria and heterotrophic nanoflagellates in the middle Adriatic Sea. Helgo¨l Mar Res 58:83–92
Shapiro LP, Haugen EM (1988) Seasonal distribution and tolerance of
Synechococcus in Boothbay harbor. Maine Estuar Coast Shelf
Sci 26:517–525
Sˇilovic´ T, Ljubesˇic´ Z, Mihanovic´ H, Olujic´ G, Terzic´ S, Jaksˇic´ Zˇ , Vilicˇic´ D (2011) Picoplankton composition related to thermo-haline circulation: the Albanian boundary zone (southern Adriatic) in late spring. Estuar Coast Shelf Sci 91:519–525 Sˇimek K, Chrzanowski TH (1992) Direct and indirect evidence of the
size selective grazing on pelagic bacteria by freshwater nano-flagellates. Appl Environ Microb 58:3715–3720
Sˇolic´ M, Krstulovic´ N, Sˇestanovic´ S (2001) The roles of preda-tion, substrate suply and temperature in controlling bacterial
Estuar Coast Shelf Sci 71:381–390
Waterbury JB, Watson S, Guillard RRL, Brand LE (1979) Wide-spread occurrence of a unicellular, marine, planktonic, cyano-bacterium. Nature 277:293–294
Waterbury JB, Watson S, Valois FW, Franks DG (1986) Biological and ecological characterization of the marine unicellular cyano-bacteriumSynechococcus. Can J Fish Aquat Sci 214:71–120 Zhang Y, Jiao NZ, Hong N (2008) Comparative study of picoplankton
biomass and community structure in different provinces from subarctic to subtropical oceans. Deep-Sea Res II 55:1605–1614 Zubkov MV, Fuchs BM, Burkill PH, Amann R (2001) Comparison of cellular and biomass specific activities of dominant bacterio-plankton groups in stratified waters of the Celtic Sea. Appl Environ Microb 67:5210–5218
Zubkov MV, Allen JI, Fuchs BM (2004) Coexistence of dominant groups in marine bacterioplankton community-a combination of experimental and modelling approaches. J Mar Biol Assoc UK 84:519–529
Zubkov MV, Tarran GA, Burkill PH (2006) Bacterioplankton of low and high DNA content in the suboxic waters of the Arabian Sea and the Gulf of Oman: abundance and amino acid uptake. Aquat Microb Ecol 43:23–32