R E S E A R C H
Open Access
The Polish face in profile: a cephalometric
baseline study
Jolanta E Loster
1, Stephen Williams
2, Aneta Wieczorek
1and Bart
ł
omiej W Loster
2*Abstract
Background:This study reports the cephalometric evaluation of a group of adolescent Polish individuals describing dento-facial structure as well as details of incisor position and soft tissue characteristics. The results should reveal morphological features specific to Polish persons and serve as a comparative material for future diagnostic procedures. Methods:The study was based on an analysis of cephalgrams of 122 Polish adolescents average age 18years 6 months analysed in a computer system using the Kracovia composite system analysis describing dento-facial morphology ad modum Björk as well as soft tissue factors. The control material was based on published reports by Björk (Dento-facial characteristics) Riketts and Holdaway (soft tissue profile).
Results:The comparative study revealed a slight reduction in the sagittal jaw relationship with a significant reduction in the vertical jaw relationship and a distinctive mandibular morphology with a reduced jaw angle and an increase in the "Beta angle". These findings were reflected in the soft tissue pattern. The soft tissue profile reflected the skeletal cephalometrics observation.
Conclusion:The dento-facial profile of Polish adolescents demonstrates specific characteristics which should be taken into account when diagnosing facial form in connection with orthodontic treatment planning in particular Polish patients.
Introduction
Despite many technical advances, the measurement of pa-rameters on a two-dimensional cephalometric registration as introduced by Broadbent [1] remains an important and worthwhile element in orthodontic treatment planning. The results of the cephalometric analysis are usually expressed as angles, the value of which are often com-pared with tables representing average values for a given population. The aim is of course to localise possible mor-phological variations which could explain the biology of the given malocclusion. It is widely recognised that the value of cephalometric norms used for comparison are re-lated to the nationality of the population on which the control material is based. Many studies have demonstrated clear morphological differences between dento-facial pa-rameters of individuals of different ethnic background [2-4]. In describing European subjects it is quite custom-ary to describe participants as“Caucasians”, a term which
could give the impression of some degree of homogeneity whereas in fact a considerable degree of variation in ana-tomical morphology, including craniofacial form exists. Compared with many areas of Europe the population of Poland can be considered reasonably homogenic and con-sequently it can be considered worthwhile to evaluate cephalometric parameters describing the dento-facial skeleton of young Polish subjects with the intention of creating a cephalometric reference material specific for this nationality.
It is now generally accepted that facial aesthetics con-stitute a significant factor in the indication for orthodon-tic treatment which often involves orthognathic surgery in the correction of malocclusion [5]. Evaluation of the soft tissue profile, by comparison with average values of relevant parameters can be of great value though due to obvious racial differences evaluation must be compared with material based on similar ethic origins.
Estimation of thesagittal jaw relationship can in many ways be considered a basic step in the differential diagno-sis of malocclusion and has been traditionally based on the ANB angle defined by Downs [6], later demonstrated
* Correspondence:[email protected]
2
Department of Orthodontics, Dental Institute, Faculty of Medicine, Jagiellonian University, Kraków, Poland
Full list of author information is available at the end of the article
by Jacobsen [7] to be unreliable due to geometric prob-lems which has been shown could easily affect the inter-pretation [8]. A study comparing different parameters describing sagittal jaw relationship [9] found very little correlation between the parameters investigated.
Over many years theposition of the mandibular incisors relative to the jaw base as well as maxillary incisors has formed an important step in orthodontic treatment plan-ning and various norms have been described based on theories regarding stability [10] as well as function [11,12]. Despite many years of study of incisal position no well-substantiated guidelines really exist and an investigation based on the present untreated sample of Polish juveniles
affords the opportunity to investigate natural incisor
orientation in relatively harmonious occlusion. The aim of the study was to investigate the dento-facial morphology and soft tissue characteristics of a group of young adolescent individuals of Polish nationality by means
of cephalometrics, thus establishing a series of values (norms) which can serve as a comparative material for fu-ture orthodontic treatment of Polish patients. The vari-ation in incisal orientvari-ation (angular inclinvari-ation and linear protrusion) was been investigated. Using the opportunity provided by the extensive nature of the study material the sagittal skeletal jaw relationship evaluated by a number of methods will also be reported and compared.
This study was approved by the bioethical committee of the Jagiellonian University, Krakow with the approval certificate number KBET/89/B/2009.
Method and materials
The present study is based on standardised digital ceph-alometric recordings (low dosage protocol) of 122 individ-uals (35 males, 87 females) with an average age of 18 years six months, minimum 17 years 2 months and maximum 19 years 7 months. Material was collected in connection
with a larger study investigating function of the stoma-tognathic system in the Polish population. All the par-ticipants fulfilled the Research Diagnostic Criteria for Temporo Mandibular Disorders Polish Version Questionnaire (RDC/TMD) and in point 25 axis II they described their Polish nationality [13]. None of the participants included in the study had received orthodontic treatment and were included irrespective of occlusion. The study was performed using the stat-istical premise used by Björk and internationally ac-cepted since 1947. Since the number of subjects was large it was considered acceptable to base results on the entire material, irrespective of occlusion/malocclusion. The participants and their parents were informed about examination procedure and both of them had signed
informed consent form. The study was conducted in accordance with the Declaration of Helsinki and Good Clinical Practise (GCP) rules. All cephalograms in the study material were recorded under standardized condi-tions on the same machine (Planmeca ProMax, Helsinki, Finland 2005) and measurement was performed by the same observer (BWL) using a FACAD© computer cephalometric system (Ilexis AB, Sweden 2014) which simultaneously calibrated all radiographs to the same enlargement factor. All data was calculated using the statistical facility in an Excel® spreadsheet.
The basic analysis
The Kracovia composite analysis [14] consists basically in three parts, the first being the full cephalometric
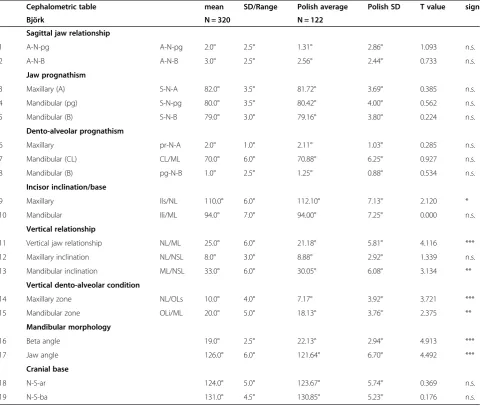
Table 1 Comparison of results of the cephalometric analysis of skeletal, dento-alveolar and soft tissue factors of the Polish study material compared to the control group (Björk)
Cephalometric table mean SD/Range Polish average Polish SD T value sign
Björk N = 320 N = 122
Sagittal jaw relationship
1 A-N-pg A-N-pg 2.0° 2.5° 1.31° 2.86° 1.093 n.s.
2 A-N-B A-N-B 3.0° 2.5° 2.56° 2.44° 0.733 n.s.
Jaw prognathism
3 Maxillary (A) S-N-A 82.0° 3.5° 81.72° 3.69° 0.385 n.s.
4 Mandibular (pg) S-N-pg 80.0° 3.5° 80.42° 4.00° 0.562 n.s.
5 Mandibular (B) S-N-B 79.0° 3.0° 79.16° 3.80° 0.224 n.s.
Dento-alveolar prognathism
6 Maxillary pr-N-A 2.0° 1.0° 2.11° 1.03° 0.285 n.s.
7 Mandibular (CL) CL/ML 70.0° 6.0° 70.88° 6.25° 0.927 n.s.
8 Mandibular (B) pg-N-B 1.0° 2.5° 1.25° 0.88° 0.534 n.s.
Incisor inclination/base
9 Maxillary Ils/NL 110.0° 6.0° 112.10° 7.13° 2.120 *
10 Mandibular Ili/ML 94.0° 7.0° 94.00° 7.25° 0.000 n.s.
Vertical relationship
11 Vertical jaw relationship NL/ML 25.0° 6.0° 21.18° 5.81° 4.116 ***
12 Maxillary inclination NL/NSL 8.0° 3.0° 8.88° 2.92° 1.339 n.s.
13 Mandibular inclination ML/NSL 33.0° 6.0° 30.05° 6.08° 3.134 **
Vertical dento-alveolar condition
14 Maxillary zone NL/OLs 10.0° 4.0° 7.17° 3.92° 3.721 ***
15 Mandibular zone OLi/ML 20.0° 5.0° 18.13° 3.76° 2.375 **
Mandibular morphology
16 Beta angle 19.0° 2.5° 22.13° 2.94° 4.913 ***
17 Jaw angle 126.0° 6.0° 121.64° 6.70° 4.492 ***
Cranial base
18 N-S-ar 124.0° 5.0° 123.67° 5.74° 0.369 n.s.
19 N-S-ba 131.0° 4.5° 130.85° 5.23° 0.176 n.s.
analysis as outlined by Björk [15] and further elaborated in a Scandinavian textbook [16]. This analysis describes the occlusion in a unique way, differentiating between skeletal, alveolar and dental characteristics in the sagittal and verti-cal planes, as well as describing mandibular morphology and the flexure of the cranial base. The concept of skeletal and dento-alveolar components and the principles of com-pensation and dysplasia were further outlined and elabo-rated by Solow [17].
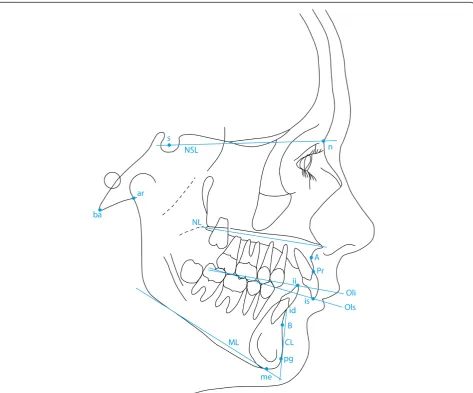
The reference points used in this study are illustrated in Figure 1 and include the following:
s - Sella. The midpoint of sella turcica.
n - Nasion. The most anterior point of the fronto-nasal suture.
ar - Articulare. The point of intersection of the contour of the external cranial base and dorsal contour of the condylar process.
ba - Basion. The lowest, most anterior point on the clivus and median point on the anterior border of the foramen magnum.
A- Downs A point. The deepest point of the anterior curvature of the maxillary alveolar process in the midline (pointsubspinale (ss)in Björk).
pr - Prosthion. The lowest and most anterior point on the surface of the maxillary alveolar process.
id - Infradentale. The highest and most anterior point of the mandibular alveolar process.
B - Downs B point. The deepest point on anterior curvature of the alveolar process of the mandible (point supramentale(sm) in Björk).
pg - Pogonion. The most anterior point of the anterior surface on the bony chin.
me - Menton (namedgnathionin Björk). The lowest point on the mandibular symphysis measured from nasion.
is - incision superius. The middle of the incisal edge of the most prominent maxillar incisor
ii - incision inferius. The tip of the most prominent mandibular incisor.
Figure 1 also illustrates the following reference lines (All from Björk [15]).
NSL Sella Nasion line
NL Nasal line (anterior nasal spine–posterior nasal spine) OLs Maxillary occlusal plane (tip of disto buccal cusp of the maxillary first molar to incision superius) OLi Mandibular occlusal plane (tip of disto buccal cusp of the first molar to incision inferius)
ML Mandibular line. A tangent to the lower border of the mandible with the origin through menton. CL Chin line. A line tangent to the anterior border of the mandibular symphysis from point id
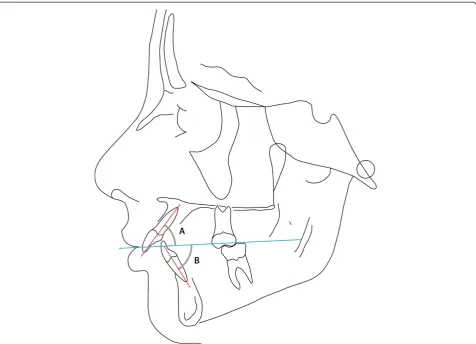
The parameters derived from the reference points above are listed in Table 1 and illustrated in Figure 1 and describe skeletal jaw relationships sagittal (1–5) and vertical (11–13) as well as the dento-alveolar relation-ships in the sagittal (6–10) and vertical planes (14–15). The analysis also describes the shape of the mandible expressed as theβangle illustrated in Figure 2, an angle which, in reality describes the relative height of the ramus and length of the ramus.
The sagittal jaw relationship and incisal position
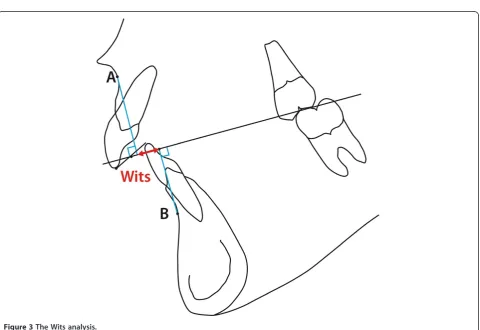
The second part of the analysis considers the sagittal jaw relationship. Due to doubts concerning the value of the ANB angle as suggested by Jacobsen [7] the linear“Wits Analysis”is also included in part 2 of the cephalometric analysis (var. 20 (Table 2) and Figure 3). Since also the value of the Wits analysis has been drawn into doubt [8]
Figure 3The Wits analysis.
Table 2 Comparison of results of the cephalometric analysis of skeletal, dento-alveolar and soft tissue factors of the Polish study material compared to the control group (Björk)
Supplementary values
Wits appraisal Mean Björk SD/Range Polish average Polish SD
20 Wits 0.0mm 0.70mm 3.14mm
Jaw lengths (to Porion)
21 Maxilla Po-A mm 89.62mm 5.34mm
22 Mandible Po-B mm 102.14mm 6.29mm
23 Relative jaw length % 87.79 3.09
Incisal inclination to OP
24 Maxillary Ils/OP 60.7° 63.18° 6.26°
25 Mandibular Ili/OP 72.0° 69.55° 6.67°
26 Inter-incisal angle 132.0° 132.73° 10.09°
Incisal relationship
27 Maxillary incisor proclination Iis/NA 21.50o 7.47°
28 Maxillary incisor protrusion Is-NA 3.04o 2.49°
29 Mandibular incisor proclination Ili/NB 23.21o 6.05°
30 Mandibular incisor protrusion Ii-NB 3.29o 2.17°
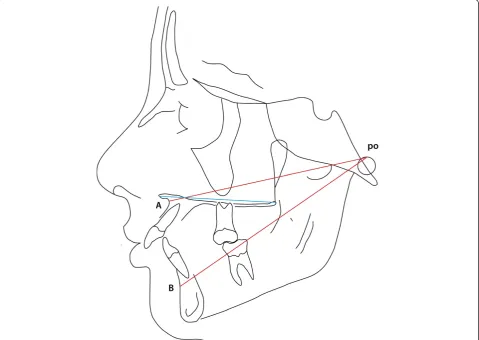
a third evaluation of the sagittal jaw relationship was con-sidered based on the length/ protrusion of the maxilla and mandible (as well as their relative lengths) related to the point Porion (po), replicating a system devised by Harvold [18] though purposely avoiding the use of the point articu-lare. The parameters are illustrated in Figure 4 and repre-sented by variables 21, 22, 23 in Table 2.
Incisal position and relationship
The inclination of the maxillary and mandibular incisors was estimated relative to the occlusal plane (var. 24 and 25 Table 2 and Figure 5) as was the inter-incisal angle (var. 26). The protrusion of the incisors, maxillary and mandibular was also measured as an angle and a linear distance to the NA and NB lines respectively as described by Steiner [19,20]. Finally the protrusion of the mandibu-lar incisors as described by Ricketts [21] relative to the A-pg line was recorded (Figure 6).
The soft tissue profile
The third part of the analysis describes the soft tissue profile as originally outlined by Holdaway [22,23], the
parameters measured being shown in Table 3 and are illustrated in Figures 7, 8 and 9 (mean values and possible variation, where available, are quoted in Table 3 with the appropriate references to the source of the information).
The sagittal jaw relationship and association between selected morphological parameters
In a supplementary study based on the same material a correlation analysis was performed using selected parame-ters, the aim being:
(1). to compare the results of three different measurements describing sagittal jaw relationship in order to compare conclusions.
(2). to investigate the correlation between the flexure of the cranial base and jaw prognathism and vertical skeletal conditions.
Results
Considering the general cephalometric analysis the infor-mation derived from the Polish material compared with the findings of Björk revealed some similarity though also
statistically significant differences in some parameters. Table 1, 2 and 3 can be summarised as follows (figures in parenthesis refer to the appropriate line in Tables 1, 2 and 3).
A slightly decreased sagittal relationship in the Polish material (var. 1, 1.31° t = 2.345, p < 0.01 and var. 2, 2.56° t = 1.683, p < 0.05). A single dental parameter reveals a slight statistical difference, namely the protrusion of the maxillary incisor to the skeletal base ILs/NL (var. 9) which is 2.1° larger in the Polish material (t = 2.886 p < 0.01). In the vertical plane significant differences were observed between the two groups, the skeletal vertical relationship (var. 11) of the Polish group (mean = 21.18°) being 3.82° less than the corresponding parameter in Björk’s Scandinavian material (mean = 25.0°) (t = 6.123, p < 0.001), due to a slight increase in posterior maxillary inclination in the Polish group (var. 12, t = 2.810, p < 0.01) as well as a clear anterior inclination of the man-dible (var. 13) of 30.05° relative to the cranial base, t = 4.576, p < 0.001). This difference in vertical jaw rela-tionship was accommodated by a compensatory reduc-tion in both the maxillary zone (var. 14, 7.17°, t = 6.746,
p < 0.001) and mandibular zone (variable 15, 18.13° t = 4.245, p < 0.001). A histogram demonstrating the dis-tribution of the vertical jaw relationship (var. 11) is shown in Figure 10 and demonstrates a tendency to platykurtotic distribution representing the inclination of the mandible to the cranial base NSL/ML. The histogram demonstrates however a very broad distribution which is also represented in the size of the standard deviation of the two parameters are very similar to that seen in the control material.
Comparing the shape of the mandible between the two groups, based on the“beta”angle, representing the height of the mandibular ramus (var. 16) and the jaw angle (var. 17) revealed a clear inter-group difference, with the Polish group demonstrating a significantly larger beta angle (t = 10.411, p < 0.001) and reduced jaw angle (t = 6.290, p < 0.001). A comparison of the degree of flexure of the cranial base, based on group means and considered both medially (variable 19) and laterally (variable 18) demonstrate similarity in the two groups.
Figure 6Protrusion of lower incisor to A-pg line (Ricketts [21]) (var. 31 see Table 2).
Table 3 Comparison of results of the cephalometric analysis of skeletal, dento-alveolar and soft tissue factors of the Polish study material compared to the control group (Björk)
Soft tissue profile Mean Björk SD/Range Polish average Polish SD
Chin
32 Soft tissue Facial Angle 91° 84°-98° 88.34° 4.58°
33 Facial Contour Angle −11° −7°–15° −13.70° 5.87°
Upper Lip
34 Prominence (H Angle) 7°-14° 13.73° 4.71°
35 Lip tip to aesthetic Line −4.0 mm −5.01mm 2.18mm
36 Naso-labial Angle 110° 109.93° 10.72°
37 Depth of superior labial sulcus −1.0- -4.0mm −2.02mm 1.19mm
Lower Lip
38 Prominence (to H Line) −0.5 mm 0.0 - 0.5 mm 0.08mm 1.63mm
39 Lip tip to aesthetic Line −2.0 mm −3.06mm 2.51mm
40 Depth of inferior labial sulcus 5.0 mm −5.03mm 1.25mm
41 Depth of inferior labial sulcus (to H line) −4.99mm 1.73mm
42 Lower lip/mandibular plane 50.87 6.44
Vertical Dimensions
43 Upper Facial Height (UFH) 40% 42.06% 2.95
44 Lower Facial Height (LFH) 60% 57.94% 2.95
45 Upper Lip (UL) 20% 18.51% 2.08
with a standard deviation of 3.09%. No statistical com-parison could be made with the control material, since these parameters are not included in the Björk study. The maxillary and mandibular incisor inclination and position relative to the NA, or NB line respectively (var.
27–30), correspond closely to the values suggested by
Steiner [19,20]. Considering the inclination of the inci-sors to the occlusal plane (var. 24 and 25) the maxillary incisors were slightly retracted and thus more steep and the mandibular incisors slightly more proclined when compared with the variables by Riolo et al. [24] based on an American material, though again a statistical com-parison was not possible.
The inter-incisor angle (var. 26) was on average 132.73° corresponding closely to the figures published by Steiner [19,20], though the standard deviation of 10.9° must be remembered. A histogram demonstrating the distribution of the inter-incisal angle is presented as
Figure 11 demonstrating a normal distribution though with a range from 111° to 163°. The position of the lower incisal edge (variable 27) showed a mean value of 0.85mm with a relatively small standard deviation (2.22mm corresponding closely to the figures described by Ricketts [21]. Again the histogram describing the distribution of values for this par-ameter (Figure 12) reveals a normal distribution. The angle of the mandibular incisor to the mandibular base (var 10) was on average 94.0° though with a standard deviation of 6.25°, which is clearly seen in the histogram Figure 13 which also reveals a range from 75° to 110°.
parameter describing soft tissue profile is reported in the present report.
In keeping with the differences in the vertical skeletal dimensions the distribution of the vertical facial height was seen to differ slightly in the Polish material (Table 3) in that the upper facial height U.F.H. was relatively greater (42.06%) than that quoted as average [5] and cor-respondingly the lower facial height was reduced at 57.94% basically due to a slightly lower value of the dis-tance from the subnasion to the stomion, (UL) (18.51%) in the Polish material against an average of 20% as quoted by Holdaway [22,23].
Considering the correlation analysis of different methods of describing the sagittal jaw relationship it will be seen in Table 4 that the correlation between the ANB and parameters representing the mandible are relatively high (SNB r =−0.36 p < 0.01 and SNpg
r =−0.42 p < 0.001) as was the relationship between ANB and the Wits analysis (r = 0.74p < 0.001). The correlation between the relative Jaw relationship (linear evaluation from Po) to the Wits analysis was also very high (r = 0.81 p < 0.001) as it also was to the ANB (r = 0.70 p < 0.001) Interestingly, in the same way that the angular prognath-ism of the two jaws, expressed by SNA and SNB were highly correlated (r = 0.79 p < 0.001) as was the correlation between the linear parameters designed to express the sa-gittal position of the jaws (Po-A/Po-B r = 0.83 p < 0.001).
In general the sagittal position of the mandible expressed by SNpg or SNB correlated negatively to an increase in posterior inclination of the mandible ML/ NSL (r =−0.64 and −0.57 respectively), both being sig-nificant at the p < 0.001 level).
Figure 9Soft tissue proportionsad modumIsaacson [5].
a clear negative correlation to parameters expressing sagit-tal jaw prognathismviz: N-S-ba to SNA, r =−0.41p < 0. 01 and N-S-ba to SNB r = 0.039 p < 0.01.
Discussion
Evidence from other studies indicates that for purposes of comparison of individual patient data with ortho-dontic cephalometric reference material (cephalometric norms) the latter must be based on material as ethnic-ally homogenous as possible since differences in the morphology of individuals as a result of ethnic origin which will be reflected in the value of cephalometric norms [2-4].
Considering the European situation it is not unusual that the reference material with which European patients are compared is often from another part of the world,
frequently USA as is the case where the widespread use of analyses by Downs [5], Sassouni [25], Steiner [19], Ricketts [21] etc. Europe is also represented by the analyses defined by Harvold [18], Hasund [26] and Björk [15]. No analysis based on patients of Polish origin have been recorded in the literature making an investigation of the craniofacial morphology of Polish individuals highly relevant.
In the creation of this study it was considered that the Björk cephalometric analysis should form the basis of the study since this is the one method which considers skeletal (basal) alveolar and dental components in order to explain the morphology of any occlusion in the sagittal and verti-cal planes as described by Solow [17]. The Björk philoso-phy encompassed also two other hypotheses, namely that the growth pattern of the mandible, reflected in the morphology of the mandible (beta angle) as well as the Figure 11Distribution of the inter-incisal angle as observed in the Polish material.
importance of the flexure of the cranial base. The latter, being unchangeable by orthodontic means should be con-sidered a dominant feature in occlusal development. The material for the original Björk study was based on Swedish individuals and even considering the geographical distance close proximity to Poland to Sweden differences in eth-nic origin make differences in occlusal and dental facial characteristics likely. The findings of the present study demonstrate that certain important differences between the two groups could be identified.
Concerning the standard cephalometric analysis ad
modum Björkthe principal differences were found to be in the vertical plane such that the Polish material repre-sented the lower vertical jaw relationship related to an increased anterior inclination of the mandible. Consider-ing the dental alveolar compensation, which is a unique feature of the Björk analysis, a significant reduction in both maxillary and mandibular zones was observed. A clear difference in mandibular morphology could be seen
between the two groups such that the increased “beta”
Figure 13The distribution of the inclination of the mandibular incisor relative to the mandibular base (var.10) observed in the Polish study material.
Table 4 The results of the correlation analysis (Pearson) based on a number of parameters chosen to represent skeletal and cranial sagittal relationships
A-N-pg A-N-B S-N-A S-N-pg S-N-B ML/NL ML/NSL N-S-ar N-S-ba Wits Po-A Po-B Rel. Jaw ANS-PNS
A-N-pg 1
A-N-B 0.96*** 1**
S-N-A 0.27** 0.29*** 1
S-N-pg −0.46*** −0.42** 0.73*** 1
S-N-B −0.35** −0.36** 0.79*** 0.98*** 1
ML/NL 0.38** 0.31** −0.18 −0.44** −0.37** 1
ML/NSL 0.39** 0.31** −0.38** −0.64*** −0.57*** 0.88*** 1
N-S-ar −0.09 −0.11 −0.44*** −0.34** −0.36** −0.13 0.07 1
N-S-ba 0.01 −0.01 −0.41*** −0.38** −0.39** −0.04 0.16 0.89*** 1
Wits 0.63*** 0.74*** 0.15 −0.31** −0.33** −0.01 −0.09 −0.07 −0.03 1
Po-A −0.02 0.02 0.16 −0.16 0.14 −0.32** −0.33** 0.17 0.06 0.19* 1
Po-B −0.36** −0.38** 0.04 0.29* 0.29** −0.21* −0.21* 0.18 0.06 −0.29** 0.83*** 1
Rel. Jaw 0.59*** 0.70*** 0.20** −0.24* −0.26** −0.18 −0.21* −0.04 −0.01 0.81*** 0.25* −0.33** 1
ANS-PNS −0.01 0.06 0.15 0.14 0.10 −0.22 −0.26 −0.03 −0.08 0.25 0.57 0.42 0.24 1
angle as defined by Björk [15] combined with a reduced jaw angle (gonion angle) illustrates a relatively “square” mandibular morphology in the Polish group, probably suggesting a history of an“anterior rotational”growth pat-tern in a large number of cases, a factor which would have clinical significance.
Relating general jaw prognathism, both maxillary and mandibular, the hypotheses of Björk [27] that jaw prog-nathism can be related to flexure of the cranial base seems to be supported by the present study, confirming also the correlation findings by Solow [28].
The principal findings of the supplementary study concerning the position of the incisors both relative as the inter-incisor angle and also to the occlusal plane re-vealed values similar to those reported by Tweed [10] Steiner [19] and Riolo [24] though the principal finding of the present study underlines the variability of these parameters such that a simple distance or angulation for every patient in connection with treatment planning is unrealistic. This seems to indicate that the relationship between incisors is not a purely an anatomical factor which can be predicted cephalometrically but could well be related to other external factors as for example the inclination of the articular plane in the temporoman-dibular joint as suggested by Slavicek [11].
Conclusion
The dento-facial profile of Polish adolescents demonstrates specific characteristics which should be taken into account when diagnosing facial form in connection with orthodon-tic treatment planning in parorthodon-ticular Polish patients.
Competing interests
The authors declare that they have no competing interests.
Authors’contributions
JEL has participated in acquisition of data, in the design of the study and have been involved in drafting the manuscript and revising it critically. SW has substantial contributions to conception and design of manuscript and have been involved in drafting the manuscript. AW has participated in acquisition of data. BWL participated in the design and coordination of the study and have been involved in drafting the manuscript and revising it critically. All authors read and approved the final manuscript.
Acknowledgements
This study was supported by a grant from the Polish Ministry of Research and High Education number N403 589138 which is hereby gratefully acknowledged.
Author details
1Department of Prosthodontics, Dental Institute, Faculty of Medicine, Jagiellonian University, Kraków, Poland.2Department of Orthodontics, Dental Institute, Faculty of Medicine, Jagiellonian University, Kraków, Poland.
Received: 11 November 2014 Accepted: 19 February 2015
References
1. Broadbent BH. A new X-ray technique and its application to Orthodontia. Angle Orthod. 1931;7:209–33.
2. Miyajima K, McNamara JA, Kimura R, Murata S, Lizuka T. Craniofacial structure of Japanese and Euro-American adults with normal occlusion and well-balanced faces. Am J Orthod DO. 1996;110:431–8.
3. Durosimmi-Eti TF. Values of school children in Lagos, Nigeria (ages 12–14 years) Thesis. Lagos, Nigeria: Lagos University teaching Hospital; 1998. 4. Richardson ER. Racial differences dimensional traits of the human face.
Angle Orthod. 1980;50:301–11.
5. Worms FW, Isaacson RJ, Speidel TM. Surgical orthodontic treatment planning: profile analysis and mandibular surgery. Angle Orthod. 1976;46(1):1–25.
6. Downs WB. Variations in facial relations: their significance in treatment and prognosis. Am J Orthod. 1948;34:812–40.
7. Jacobsen A. The“Wits”appraisal of jaw disharmony. Am J Orthod. 1975;66:125–38.
8. Williams S, Leighton B, Nielsen J. Linear evaluation of the development of sagittal jaw relationship. Am J Orthod. 1985;88(3):235–41.
9. Kirchner J, Williams S. A comparison of five different methods for describing sagittal jaw relationship. Br J Orthod. 1993;20:13–7.
10. Tweed CH. The Frankfort–mandibular incisor angle (FMIA) in orthodontic diagnosis, treatment planning and prognosis. Angle Orthod. 1954;24:121–69. 11. Slavicek R. The masticatory organ: functions and dysfunctions.
Klosterneuburg: GAMMA Medizinisch-wissenschaftliche Fortbildungs-GmbH; 2006.
12. Steiner CC. The use of cephalometrics as an aid to planning and accessing orthodontic treatment. Am J Orthod. 1960;46:721–35.
13. Osiewicz M, Lobbezoo F, Loster BW, Wilkosz M, Naeije M, Ohrbach R. Research Diagnostic Criteria for Temporomandibular Disorders (RDC/TMD)– the Polish version of a dual-axis system for the diagnosis of TMD. RDC/TMD Form J Stoma. 2013;66(5):576–649.
14. Williams S, Loster BW. Cephalometrics rationalized: presenting the Kracovia system (K.C.S). J Stoma. 2012;65(4):525–42.
15. Björk A. The face in profile: an anthropological X-ray investigation on Swedish children and conscripts. Svensk Tandl Tidskr. 1947;40(supp):5B. 16. Björk A. Kaebernes relationtil det ovrige cranium. In: Ortodonti Nordisk
Lärobok. Stockholm: Sveriges Tandläkarforbunds Forlagsforening u p a; 1975. 17. Solow B. The dento-alveolar compensatory mechanism: background and
clinical implications. BJO. 1980;7:145–61.
18. Harvold EP. The activator in interceptive orthodontics. St Louis: CV Mosby company; 1974.
19. Steiner CC. Cephalometrics for you and me. Am J Orthod. 1953;39:729–55. 20. Steiner CC. Cephalometrics in clinical practice. Angle Orthod. 1959;29:8–29. 21. Ricketts RM, Bench RW, Gugino CF, Hilgers JJ, Schulhof R. Bioprogressive
therapy. Denver: Rocky Mountain Orthodontics; 1979. p. 55–70.
22. Holdoway RA. A soft-tissue cephalometric analysis and its use in orthodontic treatment planning Part 1. Am J Orthod. 1983;84:1–28.
23. Holdoway RA. A soft-tissue cephalometric analysis and its use in orthodontic treatment planning Part 2. Am J Orthod. 1983;85:279–93.
24. Riolo M, Moyers RE, McNamara JA, Stuart Hunter W. An atlas of craniofacial growth: Pub. The centre of human growth and development. Ann Arbor, MI: The University of Michigan; 1974. p. 48109–406.
25. Sassouni V. Diagnosis and treatment planning via roentgenographic cephalometry. Am J Orthod. 1958;44:433–63.
26. Hasund A. Clinical cephalometry for the Bergen technique. Bergen: Orthodontic department, Dental Institute, University of Bergen; 1977. 27. Björk A. Cranial base development. Am J Orthod. 1955;39:198–225. 28. Solow B. The pattern of craniofacial associations. Acta Odont Scand.

![Figure 6 Protrusion of lower incisor to A-pg line (Ricketts [21]) (var. 31 see Table 2).](https://thumb-us.123doks.com/thumbv2/123dok_us/603020.1555965/8.595.55.539.453.732/figure-protrusion-lower-incisor-line-ricketts-var-table.webp)
![Figure 7 Facial planes used in the present study as well as the two angles used to describe chin prognathism (according to Holdaway [22,23]).](https://thumb-us.123doks.com/thumbv2/123dok_us/603020.1555965/9.595.62.539.87.476/figure-facial-planes-present-angles-prognathism-according-holdaway.webp)
![Figure 8 Angles and linear measurements used to describe lip position and profile (Holdaway [22,23])](https://thumb-us.123doks.com/thumbv2/123dok_us/603020.1555965/10.595.59.540.88.488/figure-angles-linear-measurements-used-position-profile-holdaway.webp)
![Figure 9 Soft tissue proportions ad modum Isaacson [5].](https://thumb-us.123doks.com/thumbv2/123dok_us/603020.1555965/11.595.57.541.88.440/figure-soft-tissue-proportions-ad-modum-isaacson.webp)