P R O C E E D I N G S
Open Access
Improved method for protein complex detection
using bottleneck proteins
Jaegyoon Ahn
1, Dae Hyun Lee
1, Youngmi Yoon
2, Yunku Yeu
1, Sanghyun Park
1*From
ACM Sixth International Workshop on Data and Text Mining in Biomedical Informatics (DTMBio 2012)
Maui, HI, USA. 29 October 2012
Abstract
Background:Detecting protein complexes is one of essential and fundamental tasks in understanding various biological functions or processes. Therefore accurate identification of protein complexes is indispensable. Methods:For more accurate detection of protein complexes, we propose an algorithm which detects dense protein sub-networks of which proteins share closely located bottleneck proteins. The proposed algorithm is capable of finding protein complexes which allow overlapping with each other.
Results:We applied our algorithm to several PPI (Protein-Protein Interaction) networks of Saccharomyces cerevisiae and Homo sapiens, and validated our results using public databases of protein complexes. The prediction accuracy was even more improved over our previous work which used also bottleneck information of the PPI network, but showed limitation when predicting small-sized protein complex detection.
Conclusions:Our algorithm resulted in overlapping protein complexes with significantly improved F1 score over existing algorithms. This result comes from high recall due to effective network search, as well as high precision due to proper use of bottleneck information during the network search.
Background
Most proteins are known to be involved in complex biolo-gical processes or functions in a cell, forming a protein complex with other proteins [1]. Therefore, detecting pro-tein complexes is one of essential and fundamental tasks in understanding various biological functions or processes. A protein complex can be modelled as an undirected graph of which node is a protein and edge is a physical interaction between two protein nodes. This physical interaction of two proteins is called PPI (Protein-Protein Interaction). Representative methods to find those interac-tions are two-hybrid system [2] and Mass Spectrometry [3]. Recent development of those high-throughput meth-ods has resulted in abundant PPI network.
A protein complex is a set of proteins that interact with each other, so it is frequently assumed that distances between its member proteins are short, and its members
tend to form clique-like structure in the PPI network. Accordingly, a protein complex is often assumed as a dense sub-graph in the PPI network. There have been active researches to develop algorithms for detecting pro-tein complexes, and many of them are based on search-ing dense sub-graph in the PPI network. MCODE [4] gives high weight to nodes of which degree is high, and searches the network using those nodes as seeds. It enforces local search on the network, and finds sub-net-work whose nodes are highly interconnected. CMC [5] gives weight to PPIs using an iterative scoring method to assess the reliability of PPI, finds maximal cliques from the weighted PPI network, and then removes or merges overlapping maximal cliques based on their interconnec-tivity. MCL [6] detects clusters by distinguishing the strong and weak connections in the network and parti-tioning the network, based on manipulation of transition probabilities or stochastic flows between vertices of the graph. MCL has been reported to have good perfor-mance, and many variations of it have been proposed
* Correspondence: [email protected]
1
Department of Computer Science, Yonsei University, 3rd Engineering Bldg. 533-1, Shinchon-dong, Seodaemun-gu, Seoul, Korea
Full list of author information is available at the end of the article
[7-9]. However, they are known to suffer from imbalance of resulting clusters [9].
These network clustering algorithms commonly do not allow overlapping between identified protein complexes. In other words, a protein can be involved in only one pro-tein complex. Recently, algorithms that allow overlapping have been extensively studied. DPClus [10] detects initial protein complexes starting from the seeds and then including neighbours so as to maintain the edge’s density of the sub-network above the threshold. Then it finds overlapped protein complexes extending the initial protein complexes. CFinder [11] is based on Clique Percolation Method (CPM) [12], which defines a protein complex as a union of k-cliques that share (k-1) vertices. The result of CFinder is sensitive to the value of k. As k increases, it tends to find smaller, but highly denser sub-network. Link Cluster [13] firstly substitutes edges to virtual nodes, and then make edge between those virtual nodes (edges) that share nodes. Virtual nodes of the substituted network are closer as their connectivity increase. Hierarchical cluster-ing of those virtual nodes results in the clusters of the edges, and as a result, those clusters can share nodes. Allowing the overlaps between resulting protein com-plexes obviously leads to higher recall and precision, because a protein is frequently involved in several protein complexes [10]. Becker et al. [14] proposed Overlapping Cluster Generator (OCG) which decomposes a network into overlapping clusters for correct assignment of multi-functional proteins. The OCG makes initial overlapping classes that are iteratively fused into a hierarchy according to an extension of Newman’s modularity function.
Precise prediction of protein complexes is important since they are likely to be fundamental units for various biological functions or processes. Also, the validation cost of predicted protein complexes is high. For more precise detection of protein complexes, we used the characteristics of bottlenecks in the network. A bottleneck of a network is a node that the information of the network is concen-trated. The bottleneckness of a node can be calculated using betweenness centrality, which is a measure of a node’s centrality in a network, and equal to the number of shortest paths going through it. Yu et al. [15] revealed that bottleneck proteins tend to be essential proteins and cor-respond to the dynamic component of the PPI network. Moreover, they can be global connectors between func-tional modules of the PPI network. Therefore, sub-graphs of which boundary proteins are bottleneck proteins have higher chance to be functional modules. We expected that finding these sub-graphs as candidate protein complexes will efficiently filter the possible false predictions out.
Previously, we proposed the protein complex prediction algorithm that utilizes the bottleneck proteins as partition-ing points for detectpartition-ing the protein complexes, based on
this expectation [16]. It iteratively constructs directed acyclic graphs of which starting node is bottlenecks in the PPI network. The search ends at nodes where flows from the starting node are concentrated. This graph is called DG (Distance Graph), and terminal nodes of DG tend to be bottlenecks of the PPI network. Established DGs are used to identify sub-graphs that may be overlapped with each other. The sub-graphs having enough edge-density are reported as protein complexes.
Even though [16] showed improved F1 score over pre-vious works, it showed limited results when predicting small-sized protein complexes. For address this problem, we propose new network search algorithm which searches dense protein sub-networks of which proteins share closely located bottleneck proteins.
We applied our algorithm to several PPI networks of Saccharomyces cerevisiae and Homo sapiens, and validated our results using public databases of protein complexes. Our algorithm resulted in significantly improved F1 score over existing algorithms including our previous work [16]. This result comes from high recall due to effective network search, as well as high precision due to proper use of bot-tleneck information during the network search.
Methods
The protein complex detection method proposed in this study is composed of two parts. First, betweenness cen-tralities of all the nodes and shortest distances between all node pairs in the PPI network are calculated. Second, we search dense protein sub-networks of which proteins share closely located bottleneck proteins.
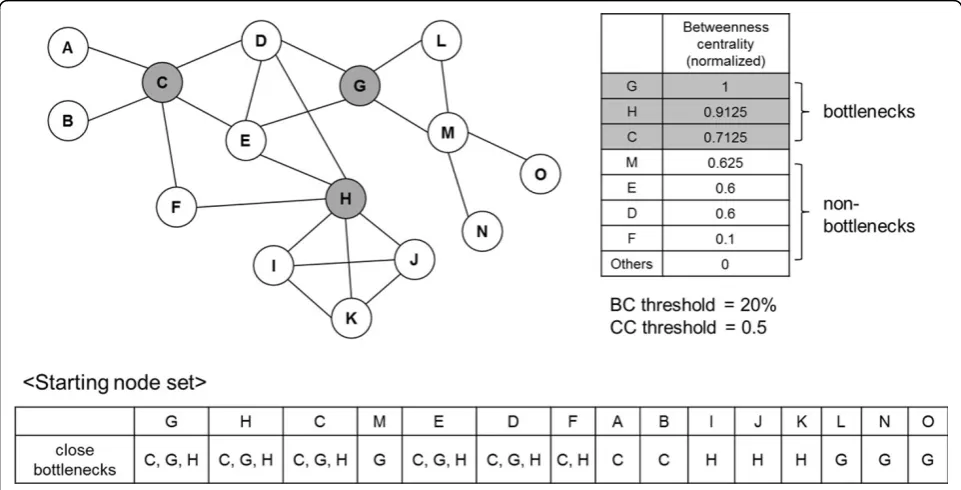
The network search starts from sorting nodes by their betweenness centrality in descending order, and putting them in the starting node set. Among them, upper BC
threshold (user parameter, %) nodes are called bottle-neck nodes. Also, each node keeps “close bottlenecks”, which is a set of bottleneck nodes of which distance from the nodes≤2.
Each node in the starting node set forms an initial cluster. The initial cluster grows by including neigh-bouring proteins iteratively, until no nodes can be included. Each cluster keeps its set of shared bottle-necks. In case of the initial cluster, this set means close bottlenecks of its starting node. From each initial clus-ter, we include neighbouring protein nodes that satisfy two conditions: the edge density and ratio of sharing bottleneck nodes. Given node n, these two conditions can be expressed by following score function:
score(n)=clutering coefficientwhennis included in the cluster × n(shared bottlenecks)
n(shared bottlenecks of the cluster)
“shared_bottleneck“ indicates intersection of shared bottlenecks of cluster and close bottlenecks ofn. Edge density can be measured by clustering coefficient, as in our previous work [16].
We find neighbouring nodes from non-bottleneck pro-teins in the cluster, except for the initial cluster. In other words, bottlenecks are nodes where the search ends. For each neighbouring node that makes clustering coefficient
≥CCthreshold, we calculate its score, and include topk% scored nodes into next cluster. Throughout the rest of the paper, we usedk= 5. We used priority queue to imple-ment this mechanism. Using topk% scored nodes rather than only one node with best score is essential for efficient network traverse. Higherkenables faster clustering, and we confirmed that higherk(~ 10%) does not lower the prediction accuracy through iterative experiments.
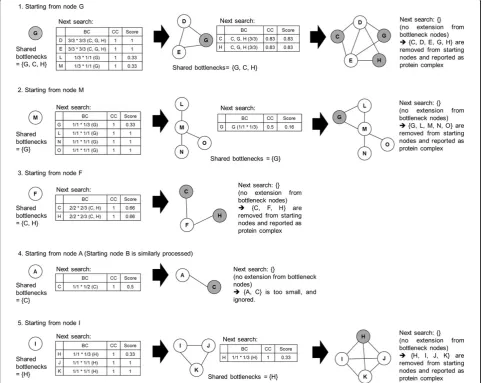
Figure 1 shows the example PPI network and its bottle-neck nodes. Each node keeps its close bottlebottle-necks. Figure 2 describes search process for the example PPI network. Starting from node G, we can see that its neighbour nodes are D, E, L and M. We calculate the score of them. Cluster {G} has shared bottlenecks {G, C, H}. Node D and cluster {G} share {G, C, H}. So, second term of above formula is 3/3. Node D has close bottlenecks {G, C, H}. So, third term of above formula is 3/3. Because clustering coeffi-cient of {D, G} is 1,score(D) is 1. For convenience, we include just top scored nodes, rather than topk% scored nodes, into next protein complex in Figure 2. So, initial
cluster {G} grows up to {D, E, G}. The neighbouring nodes of those nodes are {C, H}. Because nodes C and H satisfy
CCthreshold, they are included in the cluster. Also, as they are bottlenecks, no neighbouring nodes exist, and the search ends.
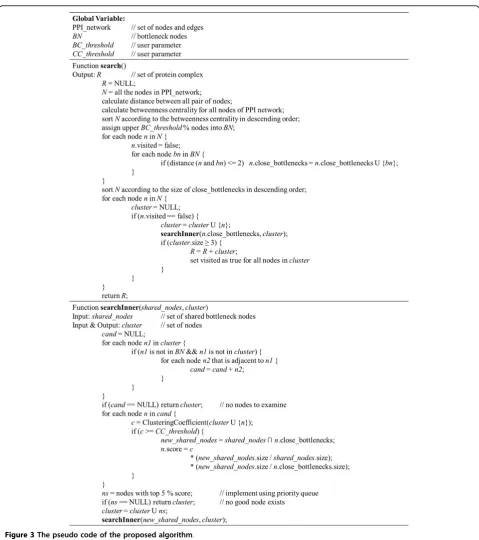
After searching for the cluster ends, it is reported as pro-tein complex if its size≥ 3, and its member nodes are removed from the starting node set. This prevents too much overlapping between resulting protein complexes. Figure 3 presents the pseudo code of the described algorithm.
Results
Experimental environment
We downloaded two PPI networks of Saccharomyces cere-visiae (yeast) from DIP [17] and BioGRID [18] database. Also, 109,086 human PPIs were downloaded from the I2D database [21]. PPIs from DIP are biologically validated, thus the number of PPIs is relatively small, but they tend to be more accurate. Meanwhile, BioGRID has about ten times more PPIs than DIP. BioGRID has many predicted PPIs, which result in much higher false positive error rate. Table 1 shows the information of the PPI network datasets.
We also collected known protein complexes (reference) to validate the results of our algorithm. Two reference data-sets of Saccharomyces cerevisiae were downloaded from MIPS [19] and CYC2008 [20] database. One reference
dataset of Homo sapiens was downloaded from CORUM database [22]. For both reference datasets and identified protein complex sets, we used complexes of which size is more than or equal to three. Table 2 shows the information of collected reference datasets.
Performance test
To see whether a complex identified by an algorithm is matched with protein complexes in the reference data-sets, we used affinity score. Given set of proteins in a protein complex in a reference dataset and set of pro-teins in an identified protein complex, which we call A and B respectively, affinity score between A and B can be calculated by the following Equation.
aff(A, B)= n(A∩B)2/(n(A)×n(B))
The searching is successful if a protein complex is iden-tified with affinity score≥0.2 for any protein complex in a reference datasets. If this threshold is too big or small, the affinity score loses its assessment function. Through itera-tive experiments, we set the affinity score threshold as 0.2, which makes the difference between results of various algorithms.
The performance of a clustering algorithm can be measured using recall, precision and F1 score, which are calculated as follows:
Recall =|Rhit|/|R|, Precision =|Chit|/|C|,
F1 score = harmonic mean of Recall and Precision,
Rhit =
Ri∈R|aff
Ri,Cj
≥0.2,Cj∈C
,
Chit =
Ci∈C|aff
Ci,Rj
≥0.2,Rj∈R
Figure 3The pseudo code of the proposed algorithm.
Table 1 PPI network datasets
Database (version) Species Number of proteins Number of PPIs
DIP (20071007) Saccharomyces cerevisiae 4,823 16,914
BioGRID (3.1.69) Saccharomyces cerevisiae 5,920 162,378
whereCis a set of protein complexes found by a clus-tering algorithm, andRis a set of protein complexes in a reference dataset. Recall means a rate of protein com-plexes in the reference datasets that were successfully found, precision means a rate of protein complexes iden-tified by an algorithm that are matched with the protein
complexes in the reference datasets, and F1 score means an overall accuracy of the test.
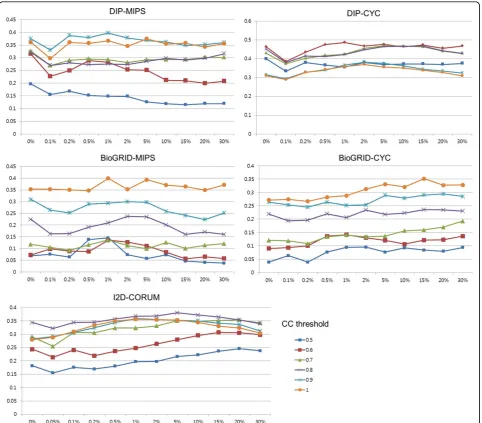
First, we tested the performance of proposed algorithm varying two user parameters,BCandCC. The results are shown in Figure 4. The optimalCCandBCthresholds are from 0.6 to 0.8 and from 1%~5% respectively, for three Table 2 Reference datasets
Database (version)
Species Number of protein complexes
Number of proteins
Avg. number of proteins in protein complexes
MIPS Saccharomyces cerevisiae
81 885 12.358
CYC2008 (2.0) Saccharomyces cerevisiae
236 1,627 6.678
CORUM (17.02.2012)
Homo Sapiens 1,942 4,394 5.789
experiments using DIP and I2D datasets (MIPS, DIP-CYC and I2D-CORUM). For two experiments using Bio-GRID dataset, the optimalCCandBCthresholds are from 1% to 15% and 1.0, respectively. The supposed reason of these differences in optimal thresholds is that BioGRID has large number of predicted PPI, which leads to higher false positive complex predictions. Therefore, the precision would decrease unlessCCis high enough, as shown in these two graphs. For the same reason, relatively large number of bottleneck seems to be helpful for accurate prediction.
To see the impact of using bottlenecks, we performed experiments using only clustering coefficient, which meansscorefunction in Methods chapter is as follow:
score(n)=clutering coefficientwhennis included in the cluster
For all the experiments, tests using bottleneck infor-mation brought more accurate results. Especially, pre-diction accuracies were clearly increased when using bottlenecks in two cases using BioGRID. This means that bottleneck information were effective in dense net-work which may include many false interactions. At the same time, tests using only clustering coefficient shows comparable prediction accuracy, which means that the
proposed network searching algorithm is effective for detecting protein complexes.
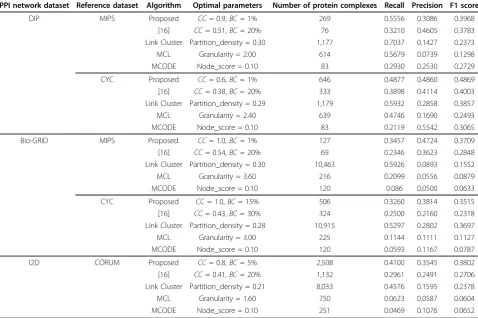
We then measured the prediction performance of pro-posed algorithm, and compared the results with repre-sentative network clustering algorithms, MCODE [4], MCL [5], Link Cluster [13], and our previous work [16]. We applied each algorithm including proposed algo-rithm to PPI networks and two reference datasets. For each algorithm, we found optimal parameters that result in best F1 score.
In Table 3, the proposed algorithm shows overall high F1 score. Except for DIP-MIPS experiment, F1 score of the proposed algorithm is significantly improved over our previous work [16]. Our previous work showed limited performance on finding small-sized protein complexes, as shown in experiments DIP-CYC, BioGRID-CYC and I2D-CORUM. While high precision was the strength of [16], we can confirm that the increased F1 score comes from higher recall, as well as high precision.
We can see that optimalBCthresholds are generally smaller, and optimalCCthresholds are higher than [16]. This indicates the proposed algorithm detects denser sub-network. However, this does not means that the proposed algorithm uses less bottleneck information, because
Table 3 Result of comparison test
PPI network dataset Reference dataset Algorithm Optimal parameters Number of protein complexes Recall Precision F1 score
DIP MIPS Proposed CC= 0.9,BC= 1% 269 0.5556 0.3086 0.3968
prediction accuracy was also good for higherBC. Because our algorithm uses bottlenecks as boundary of the protein complex, detected sub-networks are basically similar to the DG. However, division procedure of DG [16] has lim-itation on detecting dense sub-network. Therefore, we can say that the network searching algorithm we proposed overcame the limitation when detecting dense sub-networks.
Like [16], the proposed algorithm can detect protein complexes that shares PPIs. We can see that overlapped region of different protein complexes contains PPIs in Figure 5. Also, we can confirm that bottleneck proteins function as boundaries for protein complexes.
Conclusions
We proposed the novel network clustering algorithm which detects dense protein sub-networks of which teins share closely located bottleneck proteins. The pro-posed algorithm showed improved F1 score which comes from high recall due to effective network search, as well as high precision due to proper use of bottleneck information during the network search.
As future works, we extend our algorithm to detect the hierarchical relationship between sub-networks identified. This algorithm would help us to elucidate hierarchical structure of various protein complexes or functional
modules in a cell, and to infer a function of them in con-junction with various biology databases such as Gene Ontology database.
Authors’contributions
JA designed the algorithm, developed application, executed experiments, analyzed the data and wrote the paper. DHL developed application and executed experiments. YYO contributed to design of experiments and wrote the paper. YYE executed experiments, analyzed the data. SP contributed to design of the algorithm and experiments, analyzed the data and wrote the paper.
Competing interests
The authors declare that they have no competing interests.
Acknowledgements
This work was supported by National Research Foundation of Korea (NRF) grant funded by the Korea government (MEST) (No. 2012010775). This work is based on an earlier work:“Protein complex prediction via bottleneck-based graph partitioning”, inProceedings of the ACM Sixth International Workshop on Data and Text Mining in Biomedical Informatics, 2012 © ACM, 2012. http://doi.acm.org/10.1145/2390068.2390079
Declarations
The publication costs for this article were funded by the corresponding author.
This article has been published as part ofBMC Medical Informatics and Decision MakingVolume 13 Supplement 1, 2013: Proceedings of the ACM Sixth International Workshop on Data and Text Mining in Biomedical Informatics (DTMBio 2012). The full contents of the supplement are available online at http://www.biomedcentral.com/bmcmedinformdecismak/ supplements/13/S1.
Author details
1Department of Computer Science, Yonsei University, 3rd Engineering Bldg.
533-1, Shinchon-dong, Seodaemun-gu, Seoul, Korea.2Department of Computer Engineering, Gachon University, 1342 Seongnamdaero, Sujeong-gu, Seongnam-si, Gyeonggi-do, Korea.
Published: 5 April 2013
References
1. Kumar A, Snyder M:Protein complexes take the bait.Nature2002, 415:123-124.
2. Fields S, Song O:A novel genetic system to detect protein-protein interactions.Nature1989,340:245-245.
3. Ho Y, Gruhler A, Bader GD, Moore L, Adams SL, Miller A,et al:Systematic identification of protein complexes in Saccharomyces cerevisiae by mass spectrometry.Nature2002,415:180-183.
4. Bader GD, Hogue CW:An automated method for finding molecular complexes in large protein interaction networks.BMC Bioinformatics2003, 4:2.
5. Liu G, Wong L, Chua HN:Complex discovery from weighted PPI networks.Bioinformatics2009,25(15):1891-1897.
6. Dongen SV:Graph Clustering by Flow Simulation.PhD thesis, University of Utrecht2000.
7. Brohee S, van Helden J:Evaluation of clustering algorithms for protein-protein interaction networks.BMC Bioinformatics2006,7:488. 8. Vlasblom J, Wodak S:Markov clustering versus affinity propagation for
the partitioning of protein interaction graphs.BMC bioinformatics2009, 10:99.
9. Satuluri V, Parthasarathy S, Ucar D:Markov Clustering of Protein Interaction Networks with Improved Balance and Scalability.ACM-BCB 2010, 247-256.
10. Altaf-Ul-Amin M, Shinbo Y, Mihara K, Kurokawa K, Kanaya S:Development and implementation of an algorithm for detection of protein complexes in large interaction networks.BMC Bioinformatics2006,7:207.
11. Adamcsek B, Palla G, Farkas I, Derenyi I, Vicsek T:CFinder:locating cliques and overlapping modules in biological networks.Bioinformatics2006, 22(8):1021-1023.
12. Palla G, Derenyi I, Farkas I, Vicsek T:Uncovering the overlapping community structure of complex networks in nature and society.Nature 2005,435:814-818.
13. Ahn Y, Bagrow JP, Lehmann S:Link communities reveal multiscale complexity in networks.Nat2010,466:761-765.
14. Becker E, Robisson B, Chapple CE, Guenoche A, Brun C:Multifunctional proteins revealed by overlapping clustering in protein interaction network.Bioinformatics2012,28(1):84-90.
15. Yu H, Kim PM, Sperecher E, Trifonov V, Gerstein M:The Importance of Bottlenecks in Protein Networks: Correlation with Gene Essentiality and Expression Dynamics.PLoS Comput Biol2007,3(4):e59.
16. Ahn J, Lee DH, Yoon Y, Yeu Y, Park S:Protein complex prediction via bottleneck-based graph partitioning.Proceedings of the ACM Sixth International Workshop on Data and Text Mining in Biomedical Informatics New York: ACM; 2012, 49-56.
17. Salwinski L, Miller CS, Smith AJ, Pettit FK, Bowie JU, Eisenberg D:The database of interacting proteins: 2004 update.Nucleic Acids Research 2004,32(Database):D449-D451.
18. Stark C, Breitkreutz BJ, Reguly T, Boucher L, Breitkreutz A, Tyers M:BioGRID: a. general repository for interaction datasets.Nucleic Acids Research2006, 34(Database):D535-D539.
19. Güldener U, Münsterkötter M, Kastenmüller G, Strack N, van Helden J, Lemer C,et al:CYGD: the comprehensive yeast genome database.Nucleic Acids Research2005,33(Database):D364-D368.
20. Pu S, Wong J, Turner B, Cho E, Wodak S:Up-to-date catalogues of yeast protein complexes.Nucleic acids research2009,37(3):825-831.
21. Brown KR, Jurisica I:Unequal evolutionary conservation of human protein interactions in interologous networks.Genome Biol2007,8:R95. 22. Ruepp A, Waegele B, Lechner M, Brauner B, Dunger-Kaltenbach I, Fobo G,
et al:CORUM: the comprehensive resource of mammalian protein complexes-2009.Nucleic Acids Research2010,38(Database):D497-501.
doi:10.1186/1472-6947-13-S1-S5
Cite this article as:Ahnet al.:Improved method for protein complex detection using bottleneck proteins.BMC Medical Informatics and Decision Making201313(Suppl 1):S5.
Submit your next manuscript to BioMed Central and take full advantage of:
• Convenient online submission
• Thorough peer review
• No space constraints or color figure charges
• Immediate publication on acceptance
• Inclusion in PubMed, CAS, Scopus and Google Scholar
• Research which is freely available for redistribution