R E S E A R C H A R T I C L E
Open Access
The impact of health information
technologies on quality improvement
methodologies
’
efficiency, throughput and
financial outcomes: a retrospective
observational study
Raed H. AlHazme
1*, Syed S. Haque
1, Hal Wiggin
2and Arif M. Rana
2,3Abstract
Background:To evaluate whether or not the utilization of Health Information Technologies (HITs) in Quality Improvement Methodologies (QIMs) has impacts on QIMs’efficiency, throughput and financial outcomes at healthcare organizations and physician practices in the United States.
Methods:This is a retrospective observational study that was conducted between the years of 2014 and 2015 and relied on two data sources: the Dorenfest Institute dataset and the Healthcare Information and Management Systems Society (HIMSS) Analytics data source. In addition, questionnaires were submitted to collect data about how healthcare settings in the United States had been utilizing QIMs in the last 10 years. The submitted
questionnaire invitations yielded 144 responses from 134 hospitals and 10 physician practices. Descriptive statistics were used to assess the condition of the data. This involved the utilization of Box-Whisker plots to visualize the data shape, outliers and variation. The Gamma correlation analysis method was used to evaluate the statistical
relationships between the QIM outcomes, efficiency, throughput and financial outcomes, and the employment of HIT systems in QIMs.
Results:The study found that 99.3% of the healthcare organizations and physician practices had implemented at least one QIM over the last 10 years. In the QIM implementations, the total numbers of reported utilization instances of manual data collection, electronic health records, lab information systems, pharmacy information systems, computerized provider order entry and radiology information systems were 387, 352, 205, 185, 180 and 158, respectively. Based on a 95% confidence limit, the Gamma statistical test has shown an inverse correlation between the exclusive utilization of manual data collection and the overall QIM efficiency (p= 0.047, Gamma =−0. 388) and throughput (p= 0.012, Gamma =−0.593) outcomes. However, the overall QIM financial outcomes were found to have a statistically insignificant correlation (p= 0.159).
Conclusions:The study has revealed statistically significant negative impacts on QIMs’efficiency and throughput outcomes when the manual data collection is the sole method used in QIM implementations. This also indicates a positive correlation between the QIMs’efficiency and throughput outcomes and the HIT utilization in QIMs.
Keywords:Clinical and business intelligence, Data analytics, Healthcare challenges, Quality control, Quality improvement
* Correspondence:[email protected]
1Department of Health Informatics, Rutgers University, School of Health Related Professions, Newark, NJ 07107, USA
Full list of author information is available at the end of the article
Background
Quality improvement is one of the key challenges facing healthcare organizations, health government agencies, and patient safety advocates [1, 2]. This issue has been highlighted in scientific and professional literatures. For instance, the Institute of Medicine (IOM) has reported that, in the United States, between 44,000 and 98,000 patients die due to preventable mistakes [3]. The IOM also estimated that around 1.5 million preventable medi-cation errors occur each year in the United States [4]. From a cost perspective, it has been reported that the healthcare waste value in the United States has reached $750 billion in 2009 [5]. In Europe, the World Health Organization (WHO) reported that one of the healthcare quality issues, Health Care-Associated Infections (HCAIs), causes 16 million extra-days of hospital stay annually, resulting in financial losses of approximately € 7 billion every year (considering direct costs only [6]). Such serious alarms and others highlight the importance of implement-ing solutions that assist in overcomimplement-ing quality of service challenges.
Over the years, multiple Quality Improvement Meth-odologies (QIMs) have been developed and employed in many industries. In fact, many healthcare organizations have already been utilizing a variety of those methodolo-gies. A study that was conducted in the Netherlands has shown that 91% of responding hospitals have imple-mented at least one of the common methodologies [7]. The study also pointed that 39% of the hospitals have used five or more QIMs.
Despite their proven effectiveness [8–11], most QIMs were developed originally for work environments that were vastly different from healthcare. For example, the Lean methodology was developed by Toyota [12] and the Six Sigma methodology was mostly created by Motorola [13]. Both of these work environments are typically manufacturing-based. Even after a traditional QIM is extended to other industries, there are significant challenges in meeting the environment and other requirements of healthcare settings. Limitations [14, 15], resource demands [14, 16–18], inaccuracy [19] and im-practicality [20] are some of the issues that have been highlighted in the literature. The significance of such is-sues is very high, and in fact, the reported high imple-mentation failure rates of some of the traditional QIMs in healthcare [21] mostly results from these issues.
The previously mentioned QIM challenges are mainly related to the traditional data collection process, as data represent a key element in quality improvement [22]. The issues of the traditional data collection can be miti-gated using the available information technology tools [23]; mainly Health Information Technology (HIT) systems. As of 2015, 56.7% of the surveyed 5462 hospi-tals in the United States are now using HIT systems to
document patients’workflows electronically from admis-sion to discharge. This includes computerized provider orders entry and results [24]. In fact, the adoption of comprehensive HIT systems at United States non-federal hospitals has increased 11-fold since 2009 [25]. Consid-ering this wide adoption, HIT systems have the potential to automate the data collection process in QIMs. How-ever, it is uncertain whether or not the utilization of HIT systems can improve QIM efficiency, throughput and financial outcomes at healthcare organizations in the United States.
Methods
This retrospective observational study started in January of 2014 and ended in April of 2015. The study relied on three data sources to evaluate healthcare organizations’ experiences of HIT utilization in QIMs over the last 10 years. The database provided by the Dorenfest Institute for Health Information was used to obtain demographi-cal information about healthcare organizations. This included the organizations’size, type, location, HIT sta-tus, and the contact information of the organization’s representatives. The Electronic Medical Record Adop-tion Model (EMRAM) of HIMSS was used as one of the data sources to attain information about whether or not the healthcare organization has reached a closed-loop HIT implementation, which involves capturing data from admission to discharge, including orders, results and medication administration. The “basic HIT in-stalled” measure was obtained from the Dorenfest data-base, by identifying the three basic HIT applications for hospitals. The three - application benchmark has been set based on HIMSS EMRAM, which specifies that the basic installation of HIT consists of those three applica-tions, as mentioned in stage 1 of the model [26]. How-ever, in the case of physician practices, the only application that was checked is the “Ambulatory EMR” and the“Practice Management”systems in the Dorenfest database, which both represent Stage 1 of the HIMSS Ambulatory Electronic Medical Record Adoption Model [27]. It is important to highlight that“Practice Manage-ment” is a system that provides schedule management, patient demographics, medical billing management, claims scrubbing, and reporting capabilities [28].
questionnaire can be referred to in the Additional file 1. The questionnaire included three key measures: efficiency, throughput and financial. The efficiency measure is defined as the performance of processes with the minimum resources required. The throughput meas-ure is the number of processes that can be completed. The financial measure indicates the monetary cost needed to conduct a process.
The contact information of the surveyees were ob-tained from the Dorenfest Health Information database. The questionnaire invitations had only been submitted to specific job roles that are related to the study scope. The targeted job roles are C-suite, executives, clinical department heads, quality improvement specialists and management and medical informatics personnel.
The study focused on eight QIMs that have been proven effective [8–10]: Lean Six Sigma (LSS), Lean Management (LM), Six Sigma (SS), Clinical Pathways (CP), Business Process Reengineering (BPR), Continuous Improvement (CI), Total Quality Management (TQM) and Benchmarking.
The “hospital bed size”measure was derived from the hospital bed number. The values were categorized based on the Healthcare Cost and Utilization Project (HCUP) bed size categorization method [29]. The method takes into consideration the hospital’s teaching status as well as metropolitan and geographical location aspects.
To determine the metropolitan status of hospitals, the 2010 United States Census Bureau classification for urban and rural areas was used [30]. The United States Census Bureau’s urban-rural classification defines geographical areas, identifying both the individual urban areas and the rural areas of the United States. The Bur-eau’s urban areas represent densely developed territory, and encompass residential, commercial, and other non-residential urban land uses. Rural areas encompass all population, housing, and territory not included within an urban area.
The United States region measure was derived from the United States Census Bureau regional divisions [31], which divide the country into four regions: Northeast, Midwest, South and West.
Statistical methods
SPSS version 22.0.0.0 software was used to conduct the statistical analyses. Descriptive statistics was used to assess the condition of the data. This involved the utilization of Box-Whisker plots to visualize the data shape, outliers and variations. The Gamma correlation analysis method was used to evaluate the statistical relationship between the QIM outcomes, efficiency, throughput and financial outcomes, and the employment of HIT systems in QIMs.
Results
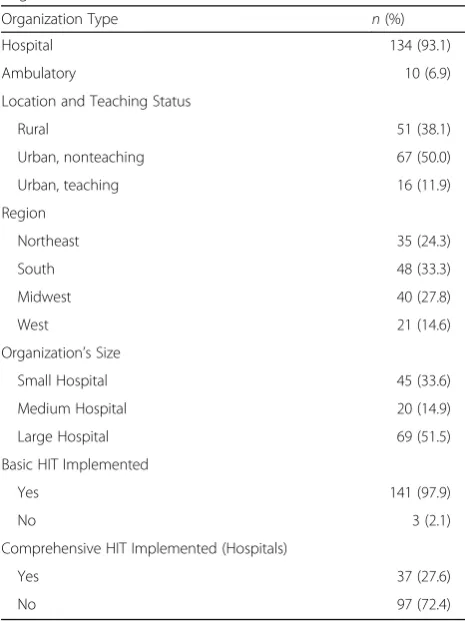
The submitted questionnaire invitations yielded 144 responses from 134 hospitals and 10 physician practices, representing 2.3% of the 5723 hospitals that exist in the United States [32]. The locations and teaching statuses of the participating hospitals are classified as 50% urban non-teaching, 38.1% rural and 11.9% urban teaching (Table 1).
The geographical locations of the responding health-care organizations included the four main regions of the United States, as defined by the United States Census Bureau. The participation shares of the Northeast, Mid-west, South, and West regions were 24.3, 27.8, 33.3 and 14.6%, respectively. Figure 1 illustrates the geographical locations of the healthcare organizations that responded to the questionnaire.
The QIM data sources used during the implementa-tions in the participating healthcare organizaimplementa-tions are presented in Fig. 2. It is important to highlight that in many cases, multiple data sources had been used by the healthcare organization as part of a QIM implementa-tion. It is also imperative to mention that ToC had a very low number of reported utilization of data sources; one manual data collectin and one CPOE. Therefore, this QIM was removed from Fig. 2 in order to improve
Table 1Descriptive Summary of the Participating Healthcare Organizations (n= 144)
Organization Type n(%)
Hospital 134 (93.1)
Ambulatory 10 (6.9)
Location and Teaching Status
Rural 51 (38.1)
Urban, nonteaching 67 (50.0)
Urban, teaching 16 (11.9)
Region
Northeast 35 (24.3)
South 48 (33.3)
Midwest 40 (27.8)
West 21 (14.6)
Organization’s Size
Small Hospital 45 (33.6)
Medium Hospital 20 (14.9)
Large Hospital 69 (51.5)
Basic HIT Implemented
Yes 141 (97.9)
No 3 (2.1)
Comprehensive HIT Implemented (Hospitals)
Yes 37 (27.6)
Fig. 1The responses from hospitals and physician practices have covered the four main regions of the United States
the appearance of the other significant categories in the graph.
Although several types of HIT systems had been used as data sources in many of the QIM implementations, manual data collection was the most common method, with the highest utilization score in six out of the eight QIMs and a total number of 387 reported utilization instances. It was also observed that the Electronic Health Record (EHR) system was the second most common data collection method in QIM implementations. The EHR scored the second highest utilized data source in six out of the eight QIMs, while it ranked the highest utilized in the remaining two. The total number of EHR utilization cases was found to be 352. This is higher than the utilization instances total number of Lab Informa-tion Systems (LIS’s), Computerized Provider Order Entry (CPOE), Pharmacy Information Systems (PIS’s) and Radiology Information Systems (RIS’s), in which they had total utilization numbers of 205, 185, 180 and 158, respectively.
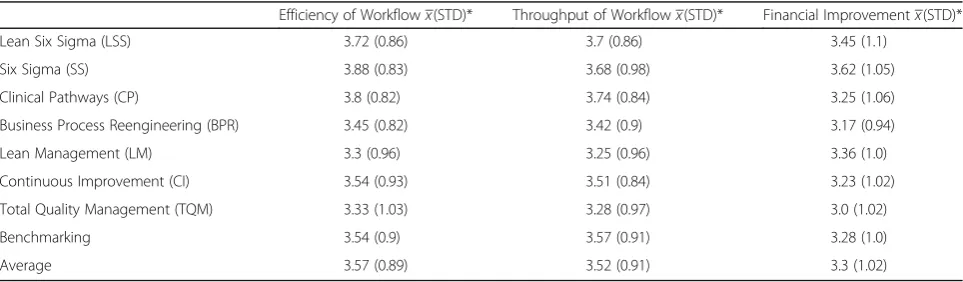
The reported overall outcomes of all main QIMs were found to be at around the middle level in all three out-come areas: efficiency, throughput, and financial im-provement. The majority of the Standard Deviation (STD) values were below one, which indicated that the variations in the outcome data were low, and that most of the reported outcome values were generally at the moderate level. Table 2 displays the overall outcomes of each of the common QIMs that were included in the study.
In order to explore the influence of HIT utilization on QIMs, the dataset was filtered to eliminate the observa-tions that did not have a complete reliance on the HIT data sources. The results have shown noticeable differ-ences in the outcomes between the two groups; the QIM implementations that relied on all data sources, Table 2, and the HIT-based QIM implementations, Table 3.
The results of the descriptive statistics, revealed in Tables 2 and 3, have shown that the mean values for
efficiency, throughput and financial outcomes were 3.57, 3.52 and 3.3. Correspondingly, they were lower com-pared to QIM implementations that involved the exclu-sive use of HIT systems, 3.96, 3.83 and 3.45. It was also important to highlight that there was a very high consistency in the reported outcomes, as the STDs were lower than one on all outcomes.
Throughput outcomes
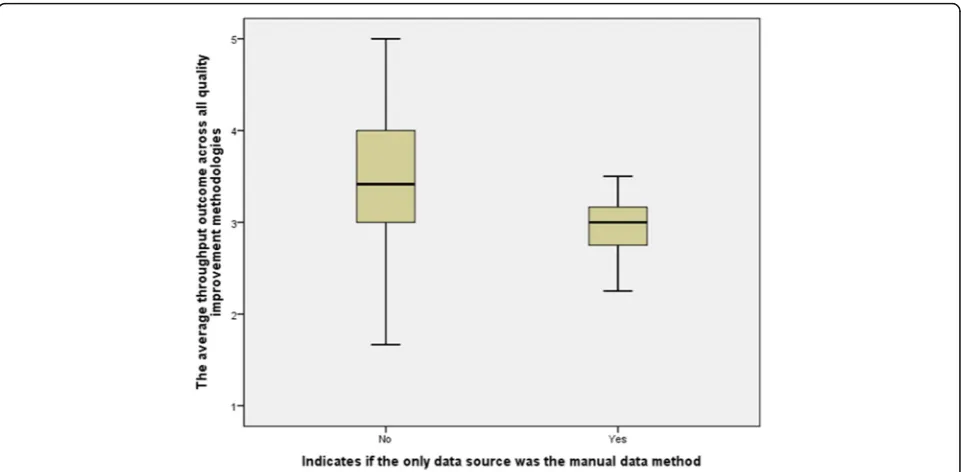
To further evaluate the impact of the manual data collection practice on throughput outcomes, correlation analysis was performed on the variable “Only Manual Data Collection Was Used”. This flagged the observation when QIM was implemented without relying on HIT data sources, and the variable that showed the QIM im-plementation throughput outcomes, “Average Through-put Outcome”.
The results of the basic statistics for the two groups; the group that relied completely on manual data collec-tion in QIM implementacollec-tions and the group that did not, have revealed a number of findings. Both, the throughput outcome mean and median were lower for the group that exclusively utilized the manual data col-lection method in QIM, 2.95 and 3.00, compared to 3.48 and 3.41 for the group that used HIT data sources. The Box-Whisker plot, presented in Fig. 3, also confirms the findings that were revealed through the descriptive statistics. Although the group that did not rely exclu-sively on the manual data collection method had a wider value range than the group that did, its median, 1st quantile and 3rd quantile were higher.
The correlation result of the Gamma test shows a statistically significant association between the two vari-ables,p-values = 0.012 (95% Confidence Limit). The dir-ection of the correlation analysis demonstrated an inverse, or negative, correlation between the manual data collection and throughput outcomes, Gamma =−0.593, which also indicated a moderate degree of inverse correlation. This reveals that when manual data
Table 2Overall outcomes of QIM implementations
Efficiency of Workflowx(STD)* Throughput of Workflowx(STD)* Financial Improvementx(STD)*
Lean Six Sigma (LSS) 3.72 (0.86) 3.7 (0.86) 3.45 (1.1)
Six Sigma (SS) 3.88 (0.83) 3.68 (0.98) 3.62 (1.05)
Clinical Pathways (CP) 3.8 (0.82) 3.74 (0.84) 3.25 (1.06)
Business Process Reengineering (BPR) 3.45 (0.82) 3.42 (0.9) 3.17 (0.94)
Lean Management (LM) 3.3 (0.96) 3.25 (0.96) 3.36 (1.0)
Continuous Improvement (CI) 3.54 (0.93) 3.51 (0.84) 3.23 (1.02)
Total Quality Management (TQM) 3.33 (1.03) 3.28 (0.97) 3.0 (1.02)
Benchmarking 3.54 (0.9) 3.57 (0.91) 3.28 (1.0)
Average 3.57 (0.89) 3.52 (0.91) 3.3 (1.02)
collection is used, throughput outcomes of QIMs de-crease and vice versa. Additionally, it implies that the utilization of HIT systems in QIMs improve throughput outcomes, because the absence of the manual data col-lection method entails the utilization of HIT systems as data sources.
To identify the QIMs that yielded throughput im-provements when HIT systems are used, correlation tests have been performed on all of the selected com-mon QIMs. However, the only QIMs that had a statisti-cally significant correlation with the utilization of HIT systems were LSS and CP.
The Gamma correlation test between the manual data collection and LSS throughput outcomes yielded a p -value of 0.032, which suggests rejecting the null hypoth-esis (H0) and accepting the alternative hypothesis (HA),
based on 95% confidence limit. This points to the
statistically significant correlation between the manual data collection and throughput outcomes of LSS imple-mentations. The direction and strength of the correl-ation is indicated by the Gamma value, −0.505, which points to a moderate negative correlation. This suggests that there is statistically significant evidence that throughput outcomes go down when the manual data collection method is used solely in the implementation of LSS and vice versa.
The correlation test of CP throughput outcomes and the utilization of HIT systems resulted in a significance value of 0.01, suggesting the rejection of the null hypoth-esis(H0)and the acceptance of the alternative hypothesis
(HA), based on a 95% confidence limit. This infers to the
statistically significant correlation between the manual data collection and throughput outcomes of CP imple-mentations. The direction and strength of the Table 3Outcomes of HIT-based QIM implementations
Efficiency of Workflowx(STD)* Throughput of Workflowx(STD)* Financial Improvementx(STD)*
Lean Six Sigma (LSS) 4.2 (0.84) 4.2 (0.84) 3.6 (1.14)
Six Sigma (SS) 4.0 (0.00) 3.33 (0.58) 3.67 (0.58)
Clinical Pathways (CP) 4.13 (0.64) 4.0 (0.54) 3.63 (1.19)
Business Process Reengineering (BPR) N/A N/A N/A
Lean Management (LM) 3.86 (1.07) 3.71 (0.95) 2.86 (1.22)
Continuous Improvement (CI) 4.0 (0.63) 4.33 (0.54) 3.33 (1.21)
Total Quality Management (TQM) 3.83 (0.75) 3.67 (0.52) 3.17 (0.98)
Benchmarking 3.67 (0.5) 3.6 (0.53) 3.89 (0.6)
Average 3.96 (0.74) 3.83 (0.64) 3.45 (0.99)
*The measurement scale is from 0 to 6, and the averages are in the table
correlation is specified by the Gamma value, −0.45, which points again to a moderate negative correlation. This proposes that there is a statistically significant evidence that throughput outcomes decrease when the manual data collection method is used solely in the implementation of CP and vice versa.
Efficiency outcomes
In relation to efficiency outcomes, descriptive statistics revealed that the efficiency outcome mean and median were lower for the group that exclusively utilized the manual data collection method in QIM, 3.10 and 3.17, compared to 3.48 and 3.50 for the group that utilized HIT data sources. The data variation in both groups was very minimal, as the STD values were found to be below 1 in both groups.
Figure 4 is a Box-Whisker plot that shows the impact of manual data collection on efficiency outcomes of QIMs. The plot also confirms the findings that were revealed through the descriptive statistics. Although the group that did not rely exclusively on the manual data collection method had a wider value range than the group that did, its median, 1st quantile and 3rd quantile were higher.
The efficiency outcomes variable also has shown a statistically significant association with the manual data collection method. The p-value was 0.047, lower than 0.05 based on 95% confidence limit. Therefore, the null hypothesis (H0) was rejected and the alternative
hypothesis (HA) was accepted. The correlation was
found to be inverse with moderate strength, Gamma =
−0.388, suggesting that the overall efficiency outcomes decrease when the manual data collection method is utilized in QIMs.
However, when each QIM efficiency outcome variable was tested individually against the variable of the manual data collection method, the only QIMs that showed statistically significant correlations were LSS and CP.
The correlation between the manual data collection method and LSS efficiency outcomes has been found to be statistically significant. With the p-value = 0.035, lower than 0.05 based on 95% confidence limit, the null hypothesis (H0)was rejected and the alternative
hypoth-esis (HA) was accepted. The correlation was found to be
moderate with an inverse direction, Gamma =−0.494, suggesting that the LSS efficiency outcomes decrease when the manual data collection method is utilized. This assumption also inversely applicable on the utilization of HIT systems in LSS implementations, as not using the manual data collection exclusively would imply the utilization of one or more HIT systems as data sources in the LSS implementation. Consequently, the finding here suggests that the utilization of HIT systems would have a positive impact on LSS efficiency outcomes.
For CP efficiency outcomes and the utilization of the manual data collection method, the significance test of the CP efficiency outcomes and manual data collection suggested that there is a correlation between the two variables. Thep-value was found to be 0.007, lower than 0.05 based on 95% confidence limit. Therefore, the null hypothesis (H0) was rejected and the alternative
hypoth-esis (HA) was accepted. The Gamma value has shown a
strong moderate negative correlation, Gamma =−0.456, suggesting that the CP efficiency outcomes decrease when the manual data collection method is utilized in QIMs.
Financial outcomes
The association between the average financial outcomes and the manual data collection method was also tested with correlation analysis. Descriptive statistics revealed that both, the financial outcome mean and median were lower for the group that exclusively utilized the manual data collection method in QIM, 3.03 and 3.00, compared to 3.25 and 3.25 for the group that utilized HIT data sources. Moreover, the data variation in both groups was very minimal, as the STD values were found to be below 1 in both groups. Besides the close mean and median values, the findings indicate that the data within the groups were relatively normally distributed.
Box-Whisker plot, Fig. 5, shows the impact of manual data collection on financial outcomes of QIMs. The plot also confirms the findings that were revealed through the descriptive statistics. Although the group that did not rely exclusively on the manual data collection method had a wider value range than the group that did, its median, 1st quantile and 3rd quantile were higher.
However, the overall financial outcome variable did not show a statistically insignificant association with the manual data collection. The p-value was 0.159, which suggests accepting the H0, based on 95% confidence
limit. Nonetheless, CP was the only QIM that was found to individually have a statistically significant correlation with the financial outcomes when HIT systems are used as data sources.
The Gamma correlation test showed that the financial outcome variable had a statistically significant associ-ation with the manual data collection method. The p -value was 0.015, lower than 0.05 based on 95% confi-dence limit. Therefore, the null hypothesis (H0) was
rejected and the alternative hypothesis (HA) was
accepted. The correlation was also inverse at a moderate level, Gamma =−0.4, suggesting that the overall effi-ciency outcomes decrease when the manual data collec-tion method is utilized in QIMs.
Discussion
Although the study has found that the manual data collection method negatively affects QIM efficiency out-comes, it is unclear whether or not an automatic data collection method, based on HIT, can show a positive correction. A further study should evaluate this hypoth-esis by developing a HIT-integrated QIM module that collects the data directly from the HIT systems. The module should then be implemented and studied to evaluate the hypothesis.
LSS, one of the key QIMs [8, 9] that has been proven to be effective [33, 34], can be used as the QIM that will be implemented in the prototype. LSS consists of two main parts: Lean and Six Sigma. Lean, which was largely developed by Toyota Motor Corporation [12], is designed around the customer requirements to ensure the delivery of products or services in the most effective, timely and safe manner possible [35]. Six Sigma is mainly about reducing variations in processes. Both of these parts can benefit from the implemented HIT sys-tems in healthcare organizations. Nowadays, many
healthcare organizations in the United States are capable of capturing the necessary LSS data through HIT sys-tems. According to HIMSS, 52.9% of the surveyed 5458 hospitals in the United States are now using HIT to elec-tronically document patients’workflows from admission to discharge, including the different orders and results that get placed and documented during the encounter [36]. This current high level of HIT adoption makes the HIT-integrated LSS module relevant to a majority of the healthcare organizations. In fact, the average adoption rates of basic EHRs in the last 4 years [37] indicates that the adoption percentage will reach 90% in the next few years.
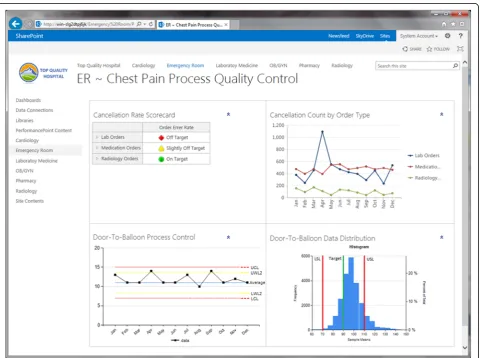
An HIT-integrated LSS module can be developed based on a Clinical and Business Intelligence (CBI) framework. While HIT systems deliver the clinical data, CBI automates the implementation of the various LSS tools. This can be facilitated through the different CBI components, including the data transformation, analysis and presentation functionalities. After the data is
formatted properly for analytics, CBI tools can be con-figured to perform LSS analyses for the Define, Measure, Analyze, Improve and Control (DMAIC) phases. For in-stance, the dashboard component of the module can fa-cilitate the control phase and help the quality improvement team members maintain the positive changes over the long-term. Figure 6 shows an example of the module’s dashboard.
Study limitations and future research
The study was limited to evaluating QIM experiences based on general understanding of the QIMs’definitions, processes and implementation methods. However, these elements are not well established and standardized in the quality improvement field and this results in varia-tions among QIM implementavaria-tions. To avoid the imple-mentation variation issue and to better control the constant variables, a cohort study is recommended to evaluate the outcomes of QIM with and without utiliz-ing HITs as data sources.
Conclusions
The healthcare system in the United States is faced with major quality challenges. QIMs have been proven to be effective in many industries. Nevertheless, it is important to implement QIMs in a manner that suites the health-care environment and integrates with its processes. HIT, with its current wide deployment, can provide an ideal platform that integrates QIMs into healthcare work-flows. However, it was unclear whether the reliance on HIT systems as data sources can improve QIM out-comes. This study has found that 99.3% of the healthcare organizations have implemented at least one of the com-mon QIMs mentioned in the questionnaire. It was also revealed that collecting quality improvement data manu-ally was the most common technique used in QIMs. The study has identified statistically significant negative impacts on QIMs’ efficiency and throughput outcomes when the manual data collection is the sole method used in QIM implementations. It also indicates a positive cor-relation between the QIMs’ efficiency and throughput outcomes and the utilization of HIT systems in QIM implementations.
Additional file
Additional file 1:Survey instruments. (PDF 242 kb)
Abbreviations
BPR:Business process reengineering; CBI: Clinical and business intelligence; CI: Continuous improvement; CP: Clinical pathways; DMAIC: Define measure, analyze, improve and control; EHR: Electronic health record;
EMRAM: Electronic medical record adoption model; HCAI: Health care-associated infection; HCUP: Healthcare cost and utilization project; HIMSS: Healthcare information and management systems society; HIT: Health information technologies; IOM: Institute of medicine; LM: Lean management; LSS: Lean Six Sigma; QIM: Quality improvement methodologies; SS: Six Sigma; STD: Standard deviation; TQM: Total quality management; WHO: World health organization
Funding
This work has not been funded by any entity.
Availability of data and materials
The study’s data is not shared in order to protect participant anonymity. Access to the Dorenfest database can be obtained from the Dorenfest Institute for Health Information (http://apps.himss.org/foundation/ histdata.asp). The HIMSS EMRAM data is available publicly and can be referred to at http://www.himssanalytics.org/stage7.
Authors’contributions
Contributed to the conception and design, collection of data: RA, SH; analyzed and interpreted the data: RA, SH; drafted the article or revised it critically for important intellectual content: RA, SH, HW, AR. All authors read and approved the final version of the manuscript.
Competing interests
The authors declare that they have no competing interest.
Consent for publication
Surveyees have been notified in the survey’s invitations that the provided information will be used for research purposes and will eventually be published in a scientific journal.
Ethics approval and consent to participate
This study has been ruled by Rutgers University’s Institutional Review Board (IRB) to be exempted from the need for ethics approval. The consent to participate in the study was implicit. The participation in the study’s survey was voluntarily. In the survey’s invitations, surveyees were explicitly informed that the collected information will be used for research and publication purposes. The second data source, the Dorenfest database, had been accessed with a permission from the Dorenfest Institute for Health Information. The third data source, HIMSS EMRAM (http:// www.himssanalytics.org/stage7), is available publicly.
Author details
1Department of Health Informatics, Rutgers University, School of Health Related Professions, Newark, NJ 07107, USA.2College of Osteopathic Medicine, Biomedical Informatics Program, Nova Southeastern University, Ft Lauderdale, FL 33314, USA.3College of Osteopathic Medicine, Public Health Program, Nova Southeastern University, Ft Lauderdale, FL 33314, USA.
Received: 8 May 2016 Accepted: 25 November 2016
References
1. Bernanke BS. Challenges for health-care reform. 2008. http://www. federalreserve.gov/newsevents/speech/bernanke20080616a.htm. Accessed 2 Feb 2014.
2. Robbins J, Garman AN, Song PH, McAlearney AS. How high-performance work systems drive health care value: an examination of leading process improvement strategies. Qual Manag Health Care. 2012;21(3):188–202. 3. The Institute of Medicine. To err is human: building a safer health system.
Washington, DC: The National Academies Press; 2000.
4. The Institute of Medicine. Preventing medication errors. Washington, DC; 2006
5. The Institute of Medicine. Best care at lower cost. Washington, DC: The National Academies Press; 2012.
6. World Health Organization. Report on the burden of endemic health care-associated infection worldwide. Geneva: World Health Organization; 2011. 7. van Lent WAM, Sanders EM, van Harten WH. Exploring improvements in
patient logistics in Dutch hospitals with a survey. BMC Health Serv Res. 2012;12:232.
8. Chassin MR. Improving the quality of health care: what’s taking so long? Heal Aff. 2013;32(10):1761–5.
9. Nicolay CR, Purkayastha S, Greenhalgh A, Benn J, Chaturvedi S, Phillips N, et al. Systematic review of the application of quality improvement methodologies from the manufacturing industry to surgical healthcare. Br J Surg. 2012;99(3): 324–35.
10. Mosadeghrad AM. Essentials of total quality management: a meta-analysis. Int J Health Care Qual Assur. 2014;27(6):544–58. doi:10.1108/IJHCQA-07-2013-0082.
11. Ho SJ, Chan L, Kidwell Jr RE. The implementation of business process reengineering in American and Canadian hospitals. Health Care Manag Rev. 1999;24(2):19–31.
12. Toyota OT. Production system: beyond large-scale production. Portland: Productivity Press; 1988.
13. Pande PS, Neuman RP, Cavanagh RR. The Six Sigma way. New York: McGraw-Hill; 2000.
14. Chand DV. Observational study using the tools of lean six sigma to improve the efficiency of the resident rounding process. J Grad Med Educ. 2011;3(2): 144–50.
15. Lin SY, Gavney D, Ishman SL, Cady-Reh J. Use of lean sigma principles in a tertiary care otolaryngology clinic to improve efficiency. Laryngoscope. 2013;123(11):2643–8.
16. Gayed B, Black S, Daggy J, Munshi IA. Redesigning a joint replacement program using lean six sigma in a veterans affairs hospital. JAMA Surg. 2013; 148(11):1050–6.
17. Black J. Transforming the patient care environment with Lean Six Sigma and realistic evaluation. J Healthc Qual. 2009;31(3):29–35.
18. Swanson R. The quality improvement handbook: team guide to tools and techniques. Boca Raton: CRC Press LLC; 1995.
20. Parks JK, Klein J, Frankel HL, Friese RS, Shafi S. Dissecting delays in trauma care using corporate lean six sigma methodology. J Trauma. 2008;65(5): 1098–104. discussion 104–5.
21. Arthur J. Lean Six Sigma for hospitals. New York: McGraw-Hill; 2011. 22. David Balestracci J, Barlow JL. Quality improvement: practical applications
for medical group practice. 2nd ed. Englewood: Center for Research in Ambulatory; 1998.
23. Sollecito WA, Johnson JK. McLaughlin and Kaluzny’s continuous quality improvement in health care. 5th ed. Burlington: Jones & Bartlett Learning; 2013. 24. Healthcare Information and Management Systems Society. Electronic
Medical Record Adoption Model (EMRAM): Healthcare Information and Management Systems Society. 2015
25. Charles D, Gabriel M, Searcy T. Adoption of Electronic Health Record Systems among U.S. NonFederal Acute Care Hospitals: 2008–2014: The Office of the National Coordinator for Health Information Technology (ONC). 2015.
26. Analytics H. U.S. EMR Adoption Model Trend. 2013. https://www. himssanalytics.org/docs/EMRAM%20Criteria%20Sheet%202014%20v2.pdf. Accessed Apr 2014.
27. HIMSS Analytics. Ambulatory EMR Adoption Model. HIMSS Analytics. 2014. http://www.himssanalytics.org/emram/AEMRAM.aspx. Accessed 29 Sept 2014. 28. eClinicalWorks. Practice Management. eClinicalWorks. http://www.
eclinicalworks.com/products-practice-management.htm. Accessed Sept 2014. 29. Healthcare Cost and Utilization Project (HCUP). HOSP_BEDSIZE - Bedsize of hospital. Healthcare Cost and Utilization Project (HCUP). 2008. http://www. hcup-us.ahrq.gov/db/vars/hosp_bedsize/nisnote.jsp. Accessed 29 Sept 2014. 30. U.S. Census Bureau. 2010 Census Urban and Rural Classification and Urban
Area Criteria. U.S. Census Bureau. 2010. https://www.census.gov/geo/ reference/ua/urban-rural-2010.html. Accessed 29 Sept 2014. 31. U.S. Census Bureau. Census Regions and Divisions of the United States.
United States Census Bureau. http://www.census.gov/econ/census/help/ geography/regions_and_divisions.html. Accessed 29 Sept 2014.
32. The American Hospital Association. Fast Facts on US Hospitals. 2014. http:// www.aha.org/research/rc/stat-studies/fast-facts.shtml. Accessed 22 July 2014. 33. van den Heuvel J, Does RJ, Bogers AJ, Berg M. Implementing Six Sigma in
the Netherlands. Jt Comm J Qual Patient Saf. 2006;32(7):393–9. 34. Deckard GJ, Borkowski N, Diaz D, Sanchez C, Boisette SA. Improving
timeliness and efficiency in the referral process for safety net providers: application of the Lean Six Sigma methodology. J Ambul Care Manage. 2010;33(2):124–30.
35. Eaton M. The lean practitioner’s handbook. London: Kogan Page Limited; 2013. 36. Analytics H. Current EMRAM Scores 2013. https://www.himssanalytics.org/
emram/scoreTrends.aspx. Accessed Apr 2014.
37. HealthIT.Gov. Hospital Adoption of EHRs. 2013. http://dashboard.healthit. gov/hitadoption/. Accessed Apr 2014.
• We accept pre-submission inquiries
• Our selector tool helps you to find the most relevant journal • We provide round the clock customer support
• Convenient online submission • Thorough peer review
• Inclusion in PubMed and all major indexing services • Maximum visibility for your research
Submit your manuscript at www.biomedcentral.com/submit