RAILWAY BALLAST CONDITION ASSESSMENT USING GROUND-PENETRATING RADAR – AN EXPERIMENTAL, NUMERICAL SIMULATION AND MODELLING DEVELOPMENT
Andrea BENEDETTO1, Fabio TOSTI2, Luca BIANCHINI CIAMPOLI1, Alessandro CALVI1, Maria Giulia BRANCADORO1, Amir M. ALANI2
1Department of Engineering, Roma Tre University, Via Vito Volterra 62, 00146, Rome, Italy
e-mail: [email protected]; [email protected]; [email protected]; [email protected]
2School of Computing and Engineering, University of West London (UWL), St Mary's Road, Ealing, London
W5 5RF, UK
e-mail: [email protected] (*Corresponding author); [email protected]
keywords: ground-penetrating radar, GPR, railway ballast; ballast fouling; volumetric mixing formula; random-sequential adsorption paradigm; finite-difference time-domain (FDTD) simulation; gprMax
1. INTRODUCTION
The structure of a traditional railway is typically constituted of steel rails fastened to the sleepers, and laid on a coarse rocky material, i.e., the ballast. Railway ballast can be defined as a homogeneously graded material coming from the crushing of hard rocks or, seldom, of coarse gravel with small-sized particles sieved out. A railway track bed structure made of ballast aggregate particles is typically laid on the subgrade directly. In
some configurations, a filter layer between the ballast and the subgrade, i.e., the sub-ballast, is also included. This is manufactured by smaller-sized soil materials, such as sand or gravel. Typically, the thickness of a track bed structure ranges between 0.45 m and 0.75 m. From a structural and operational point of view, the ballast/sub-ballast system accomplishes the tasks of dissipating the vertical, lateral and longitudinal stresses induced by the loads (i.e., trains passing on the rails), and draining the meteoric water by means of the high percentage of air-filled voids [1].
The proper operation of a ballast track bed is ruled by the friction between the aggregate particles, which in turn is granted by their own angularity. This strength mechanism may be undermined by the presence of fine-grained material which can fill progressively the voids between the ballast aggregates. This occurrence is typically defined as “fouling” and may be related to three main factors, i.e., i) the segregation of the ballast aggregates under load, ii) the production of metal dust from the wheel/rail contact and iii) the rise of fine-grained materials from the subgrade by means of capillary actions. This last factor affects greatly the strength properties of the entire railway track bed, mostly in the case of clayey soil material which flows from the foundation level [2].
and mechanical properties of the ballast/sub-ballast system and, accordingly, the effective detection of fouling. This operation is carried out traditionally in the laboratory environment according to international standard test methods [3-12]. It is extremely time-consuming, although the information retrieved are highly reliable. Similarly, the collection of ground-truth data by digging test pits has drawbacks in terms of time-efficiency and data representativeness. In view of the above, the use of time-efficient and cost-effective technologies may be an added value within the context of the effective management of railway infrastructures.
Within this framework, ground-penetrating radar (GPR) represents an extremely powerful tool, which is being increasingly used for the rapid and non-intrusive assessment and health monitoring of railways. This method relies on the electromagnetic (EM) theory and it has found major application in differing areas, such as civil and environmental engineering [13], archaeology [14], planetary explorations [15] and forensics [16]. According to Roberts et al.[17], the first GPR application in railway engineering dates back to 1985 [18] and involved the use of a low-frequency antenna system mounted over the interaxis of the rails. The low resolution of the system caused uncertainty in the interpretation of the results; thereby, later applications have focused more on the use of higher frequency antenna systems [19-21]. Several GPR-based models for the assessment of the railway ballast condition and prediction of fouling can be found in the literature [22-24]. These models are mostly based on the processing of the actual GPR data collected in the real life/laboratory environment. In this paper, differing configurations of ballast/fine-grained pollutant mixes were first evaluated electromagnetically in the laboratory environment using different signal processing techniques. Subsequently, a numerical-simulation-based methodology was introduced for the validation of the results.
simulation domain of the rail track bed as well as reliable validation of the results. In addition, the use of differing antenna systems and frequencies of investigation allowed to demonstrate the actual applicability of the discussed methodology as well as to select antenna frequencies suited for the purpose.
2. OBJECTIVES AND METHODOLOGIES
This paper reports on the EM assessment of railway ballast in both clean and fouled conditions using different signal processing methods. A new numerical simulation methodology was also introduced. Four configurations of ballast aggregate particles and pollutant fine-grained silty soil material were manufactured within a
square-based methacrylate tank representing a railway track bed structure. At each step of the fouling process, the data were collected using several GPR systems equipped with different air-coupled antennas and central frequencies of 1000 MHz and 2000 MHz. Various processing methods were performed for the computation of the dielectric permittivity of the ballast system. The results were obtained by using several models available in the literature. In addition, a new numerical simulation methodology based on the combination of the random-sequential adsorption (RSA) and the finite-difference time-domain (FDTD) paradigms is discussed. The remainder of this paper is organized as follows. In Section 3, the EM basics and the main working principles behind the GPR technique are discussed. Section 4 describes the experimental design, the laying out of the laboratory setup, and the main standard test methods followed for the assessment of the main geometric, physical and mechanical properties of the investigated materials. The results of the GPR surveys are presented in Section 5, where the values of the relative dielectric permittivity achieved by the time-domain signal picking (TDSP) technique, the surface reflection method (SRM) and the volumetric mixing formula (VMF) approaches within the various scenarios are compared each to one another. The outcomes of the aforementioned simulation-based methodology using the 1000 MHz antenna frequency are therefore analysed. Conclusions and future perspectives are discussed in Section 6.
3. THE GPR METHOD
(e.g., the interface between two geological formations or road pavement layers), part of the energy gets reflected, whereas the remaining part gets transmitted and travels throughout the material before being absorbed. Therefore, it is possible to retrieve information non-destructively about the subsurface by the interpretation of the back-reflected signal.
From a theoretical point of view, the EM behaviour of the surveyed material is ruled by its dielectric and magnetic properties, i.e., the relative dielectric permittivity ε, the electric conductivity σ, and the magnetic permeability μ [25]. In more detail, the values of ε and σ greatlyinfluence the velocity and the attenuation of the wave propagation, respectively, whereas μ does not affect the EM behaviour in the case of non-magnetic targets.
With regard to the case of a multi-phase material (such as the ballast aggregate/air mix in a railway track bed), the overall EM behaviour is influenced by the dielectric properties of each phase. In particular, as the air and the free water components represent opposite edge values in terms of conductivity and permittivity, their rates within the mixed material affect highly the overall dielectric behaviour of the multi-phase medium. In view of this, the grain size distribution and the void index of the mix are crucial at determining the values of the dielectric parameters, as they are directly related to the presence of air and free water.
With regard to the hardware structure of a pulsed GPR system, it is broadly constituted by a control unit generating a fixed EM impulse and one or more antennas containing the transmitter (Tx) and the receiver (Rx) units. A radar system is configured as mono-static when a unique antenna operates as both Tx and Rx. In the case of separated Tx and Rx, the GPR system is defined as bi-static. In addition, the GPR systems can be sorted in ground-coupled and air-coupled according to the type of antenna. In ground-coupled systems, the antenna is directly in contact with the ground and allows a deeper penetration in the medium. Central frequencies available for this configuration usually range from 80 MHz to 2000 MHz. In the case of air-coupled systems, the antenna is typically kept at a constant height above the surface, which can range from 0.15 m to 0.50 m. The most common air-coupled GPR systems are pulsed systems operating in the range 500÷2500 MHz, with a central frequency typically of 1000 MHz. The resolution of the collected signal and the depth of the signal penetration mainly depend on the frequency of investigation.
4. EXPERIMENTAL FRAMEWORK
4.1 Experimental design
The experimental design was aimed at assessing the main geometric, mechanical, physical, and the EM properties of the investigated railway ballast and the pollutant soil material using traditional standard test methods and differing GPR antenna systems. To this purpose, a laboratory setup was developed at the Department of Engineering of Roma Tre University, Rome, Italy. A methacrylate tank with dimensions reproducing a typical railway ballast layer (full scale) was filled up with limestone-derived ballast, with a growing percentage in weight of pollutant material. At each pollution level, GPR tests were carried out by using the available set of air-coupled antenna systems in order to investigate the influence of fouling on the EM behaviour of the reproduced ballast layer.
4.2 Materials: assessment of the main geometric, mechanical, and physical properties
The assessment of the main geometric, mechanical, and physical properties of the investigated materials was performed in compliance with three principal objectives: i) classifying and verifying the consistency of these materials with the main international standards and regulations of laying out in railway track beds, ii) assessing and controlling the geometric, mechanical, and physical properties of the ballast aggregates which can be relevant in EM inspections and iii) ensuring the repeatability of the tests for future comparisons of the results.
4.2.1 Railway ballast
results, such as the content of voids [8] and water [9], were also evaluated. Both of these latter parameters have a key role in affecting the value of the relative dielectric permittivity of a multi-phase medium. This is much more evident in the case of coarse-grained material, such as the railway ballast, where the index of voids is a relevant component. The values found for all the above parameters are listed in Table 1.
Table 1 Geometric, mechanical, and physical properties of the ballast aggregates assessed in the laboratory environment.
Ballast property Regulation Reference
unit Value Class
Geometric Grain size EN 13450:2013 [3] EN 933-1:2012 [4]
% passing vs. sieve size (mm): 80 -63 -50 -40 -31.5
– 22.4
100 – 100 -79.9 – 30.6 – 1.2 –
0.3 A Fine particles content EN 933-1:2012 [4]
% passing vs. sieve size (mm): 0.063
0.5 A
Particle length EN 933-4:2008
[5] % 5.5 B
Shape index - SI -
EN 933-4:2008
[5] % 20.0 SI20
Mechanical & physical
Resistance to fragmentation
- LARB -
EN 1097-2:2010
[6] % 20.0 LARB 20
Particle density - ρs -
EN 1097-6:2013
[7] g/cm
3 2.8 /
Percentage of voids - φ -
EN 1097-3:1998
[8] % 39.0 /
Water content - w -
CEN ISO/TS 17892-1:2005
[9] % 0.2 /
With regard to the geometric properties, the grain size of the ballast was classified as the finest-grained class out of the six identified by the EN 13450:2002/AC:2004 standard [3], i.e., class A within the main category of the aggregate dimensions 31.5 mm ÷ 50 mm. The content of fine particles passing the 0.063 mm sieve size was calculated according to the sieving procedures described in the EN 933-1:2012 standard [4]. This parameter turned out to be equal to 0.5%; hence, it fell within very low values. Tests for the classification of the particles length [5] returned an amount of 5.5% by weight of aggregates with length ≥ 100 mm. To this effect, 40kg of ballast material were sampled. The shape index SI was evaluated according to the EN 933-4:2008 standard [5] as follows:
where M1 is the weight of the whole ballast sample [g], made of minimum 100 aggregates, and M2 is the weight
of the non-cubic ballast samples [g] (i.e., where the ratio between the particle length L and the particle thickness E is greater than 3). This index was found to be 20%, thereby proving an average amount of too long particles as well as an average level of heterogeneity in the aggregate particle shapes of the ballast.
With regard to the assessment of the main mechanical and physical properties, two further parameters are provided in the EN 13450:2002/AC:2004 standard [3]: the resistance to fragmentation 𝐿𝐴𝑅𝐵 and the particle
density ρs. The technical procedures for the above standards are described within the EN 933-4:2008 [5] and
the EN 1097-6:2013 [7] documents, respectively. The resistance to fragmentation was assessed by the Los Angeles test method using the relevant equipment indicated in the EN 1097-2 standard [6] and following the changes to the test method included in the EN 13450:2002/AC:2004 standard [3]. This was due to the larger grain size of the ballast aggregates with respect to the fine-grained soil material which is usually tested by this method. The Los Angeles abrasion index LARB was evaluated as follows:
𝐿𝐴𝑅𝐵 =
10000−𝑚
100 (2)
where m [g] measures the mass of material segregated, as indicated by Eq. (3):
𝑚 = (𝑚50÷31.5)10 𝑘𝑔_𝐵− (𝑇1.6)𝐴 (3)
being (𝑚50÷31.5)10 𝑘𝑔_𝐵 the 10kg mass of the material sieved before running the Los Angeles test with grain
size comprised between 31.5 mm and 50 mm, and T1.6 the material retained on the 1.6 mm sieve, after running
the Los Angeles test. The LARB index turned out to be 20% (i.e., LARB20).
The particle density ρs was evaluated according to both the wire basket (Fig. 1) and the pycnometer methods
Fig. 1. Test procedure for the wire basket method [7]: (a) sampling and measurement of the aggregates by calibre; (b) cleaning and removal of fine particles within a number of aggregates retained on the 63 mm and
the 31,5 mm test sieves; (c) water-soaking of the sampled ballast aggregates; (d) measurement of the apparent weight of the material soaked in water by a hydrostatic weighing table; (e) drying of the sampled material by absorbent paper; (f) drying of the sampled material by oven at 110 C° until the achievement of a
constant weight of the aggregates.
a function of the room temperature), it was found a value of 39% for the voids parameter. This value agrees with the benchmark values indicated by Sussmann et al. [27] in the case of loose ballast aggregates.
Fig. 2. Distilled water filling the inter-particle voids of ballast aggregates within a test formwork as part of the laboratory procedures for the evaluation of the percentage of voids.
Furthermore, the value of the water content parameter w was determined according to the CEN ISO/TS 17892-1:2005 standard [9]. This standard was used for the assessment of the moisture of the ballast aggregates taken from the quarry and the evaluation of the time required for drying the materials and performing the experimental tests at controlled room conditions. The water content w [%] was calculated as follows:
𝑤 =𝑚1−𝑚2
𝑚2−𝑚𝑐× 100 =
𝑚𝑣
𝑚𝑑× 100 (4)
where m1 [g] is the mass of the container and the moist test specimen, m2 [g] is the mass of the container and
the dried test specimen, mc [g] is the mass of the container, mv [g] and md [g] are, respectively, the water and
4.2.2 Pollutant soil material
A fine-grained loose soil material was used for pollution of the clean ballast aggregates in order to reproduce various fouling conditions. The most important geometric (i.e., the grain size), mechanical and physical properties (i.e., plasticity, particle density, water content at room temperature) were determined in the laboratory environment (Fig. 3). The relevant values are listed in Table 2.
Fig. 3. Tests performed in the laboratory environment for the assessment of the pollutant soil material: (a) samples preparation;(b)soil particles sieving under water flow (grain size analysis) [4]; (c) cutting of a standard groove into the molded material with a test-specific knife (soil plasticity test) [10]; (d) boiling of the
immersed specimen for deaeration (particle density evaluation test) [12].
Table 2 Geometric, mechanical and physical properties assessed in the laboratory environment for the pollutant soil material.
Soil loose material property Regulation Reference unit Value Class
Geometric
Grain size EN 933-1:2012 [4]
% passing vs. sieve size (mm):
4.75 2 0.425 -0.075
100 – 99.6 -99.4 – 84.7
A4 - AASHTO -
Mechanical &
physical
Liquid limit - LL -
ASTM D4318-10e1 [10] % 24.6 Plastic index - IP -
7.6
Particle density - ρs -
EN ISO 17892-3:2015
[12]
g/cm3 2.5 /
Water content - w (θ) -
CEN ISO/TS 17892-1:2005
[9]
% (cm3/cm3) 2.5 (4.0) /
Grain size analyses [4] (Fig 3(a-b)) and plasticity tests [10] (Fig. 3(c)) were performed to identify the class of the material within the framework of the American Association of State Highway and Transportation Officials (AASHTO) soil classification [11]. To this purpose, the percentage of soil particles passing the 0.075 mm sieve size greater than 35% along with the liquid limit LL and the plastic index IP of, respectively, 24.6% and
7.6%, allowed to classify the pollutant as a silty soil material within the A4 AASHTO group.
The particle density ρs of the pollutant material is an important parameter for the investigation of the EM
response of the soil [28, 29]. Furthermore, it was also used in the literature for identifying various indexes of fouling [30, 31]. The particle density was determined according to the EN ISO 17892-3:2015 standard [12] (Fig. 3(d)) and evaluated as follows:
𝜌𝑠= 𝑝
𝑝+𝑝2−𝑝1∙ 𝜌𝑤 (5)
being p the dry mass of the specimen, p1 the mass of the pycnometer, completely filled with the saturated
specimen and the control liquid; p2 the mass of the pycnometer, completely filled with the control liquid; ρw
the density of the control liquid (whose values are given in the norm as a function of the temperature T). The average of the results obtained from three tests has returned a value of 2.5 g/cm3 for ρ
s.
The environmental water content of the silty soil w was determined after oven drying all the material and leaving it at room temperature and ambient humidity for seven days. The soil moisture has been then evaluated according to the CEN ISO/TS 17892-1:2005 standard [9], and turned out to be 2.5% (i.e., θ = 4 cm3/cm3).
4.3 GPR equipment
MHz systems, respectively. With regards to the 2000 MHz radar systems, one ordinary (i.e., 2000 MHz EU) and one low-powered (i.e., 2000 MHz NA) version of the horn antennas for the European (EU) and the North-American (NA) markets, respectively, were used for testing purposes. Nominal resolutions (quarter of wavelength criteria) of 7.5 × 10⁻² m and 3.75 × 10⁻² m can be reached by the 1000 MHz and 2000 MHz central frequency antennas, respectively. This complies satisfactorily with the aggregates particle size, roughness, voids content as well as with the fouling scenarios that will be described in the following Sections.
Fig. 4. Air-coupled radar systems used for the experimental surveys.
4.4 Laboratory setup and testing 4.4.1 Testing equipment
suitable manufacturing material (i.e., methacrylate) and the dimensions of the tank, in order to i) provide data consistent with real-life scenarios and the arrangement of railway ballast aggregates; ii) reproducing effectively the action of relevant physical agents which may affect the mechanical behaviour of the railway ballast layer; iii) avoiding any edge effects which may cause noise disturbances on the EM signal; iv) allowing direct observation of both the aggregates/pollutant-soil arrangement and the evolution of the physical-mechanical occurrences inside the tank.
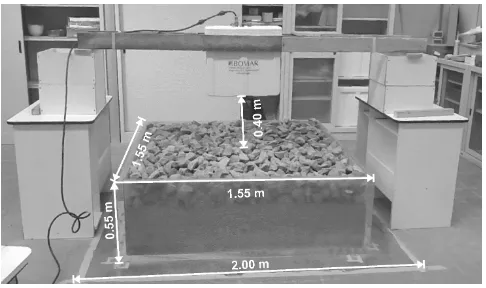
The height of the tank was chosen according to typical design thicknesses of the granular ballast layer. These usually range between 0.45 m and 0.75 m [33]. In addition, the average dimension and roughness of the used aggregate particles along with the reference size of the inter-particle voids were taken into account for design purposes. The width and depth of the tank were established after the evaluation of the antennas’ footprints as per the information provided by the manufacturer. Further experimental tests were carried out to confirm the given data. To this purpose, analyses of the boundaries of noise effects to the signal were performed and a reference GPR standard on air-coupled radar systems [34] was followed. The tank dimensions (width and depth) also comply with the planimetric dimensions of common track beds, when considering the distance between the rails and the length of the sleepers [35].
The tank was laid above a 2m × 2m copper-made perfect electric conductor (PEC) sheet, which allowed to reflect completely the waves propagating through the investigated material [36]. Indeed, the use of a PEC avoids the propagation of the EM wave through the floor and prevents to illuminate possible sources of noise such as the structural concrete or the reinforcement bars embedded in the ground of the laboratory.
Fig. 5. Laboratory setup used for the GPR tests.
4.4.2 Procedures for materials layout
The considerable size of the investigation domain and the relevant amount of ballast aggregates (~1500 kg) and pollutant soil material (from ~250 kg to ~800 kg, depending on the fouling level) to manage, have led to developing small-scale laboratory procedures. These have favoured standardizing the mechanical and physical conditions reproduced for the material within the volume of the tank.
Fig. 6. Equipment for ensuring the effective distribution of the pollutant material within the railway ballast inter-particle voids: (a) wooden square grid mesh of 16 quadrants with 0.35m sides; (b) 4mm-size sieving grid.
Fig. 7. Compaction procedures carried out on a small-scale formwork: (a) hammer drill equipped with a square-shaped drill bit; (b) placement and levelling of the dry silty soil material within the test formwork; (c) addition of the extension collar and connection to the formwork by means of a metal connector to prevent material waste during compaction; (d) induction of 10s steps of vibration by resting the square-shaped drill bit to the formwork cover cap; (e) removal of the cover cap and (f) measurement of the induced subsidence.
Modified Proctor test for mixes compacted with a 4.5 kg rammer in the large Proctor mould [37]. The overall compaction energy per unit volume spent with the hammer amounts to 1.04 × 10⁶ J/ m3, whereas values of 0.59 × 10⁶ J/ m3 and 2.68 × 10⁶ J/ m3 were found for the Proctor and the Modified Proctor tests, respectively. In view of the obtained values of energy, it can be therefore argued how the compaction procedure here proposed ranks between the Standard and the Modified Proctor test.
4.4.3 Test scenarios
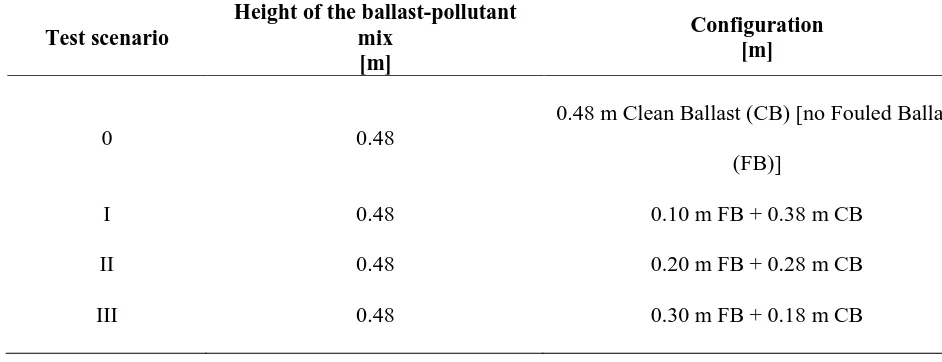
Four main configurations (Table 3) were manufactured in the laboratory environment. In all of these scenarios, the material investigated filled the entire inner tank height h of 0.48 m.
Table 3 Configurations of ballast-pollutant mixes investigated in the laboratory.
Test scenario
Height of the ballast-pollutant mix
[m]
Configuration [m]
0 0.48
0.48 m Clean Ballast (CB) [no Fouled Ballast (FB)]
I 0.48 0.10 m FB + 0.38 m CB
II 0.48 0.20 m FB + 0.28 m CB
III 0.48 0.30 m FB + 0.18 m CB
Starting from clean ballast conditions (i.e., Test scenario 0), the fouling was reproduced by layers of a mix between the pollutant A4 silty soil and the ballast aggregates. The height of this mix was progressively increased by steps of 0.10 m. Mixing and compaction of the materials were performed according to the procedures discussed in Section 4.4.2. The above-fouled configurations were set to be representative of low (i.e., 0.10 m of fouled ballast (FB) – Test scenario I), medium (i.e., 0.20 m of FB– Test scenario II) and high (i.e., 0.30 m of FB– Test scenario III) levels of fouling within the ballast layer of a railway track bed.
mixing and compaction procedures were carried out. Afterwards, the clean ballast aggregates was placed again above the compacted fouled layer of ballast up to filling the entire height of the tank. The above “emptying and filling” loop was repeated until the conditions of scenario III were reached. The GPR surveys with the three aforementioned air-coupled antenna systems were performed at each scenario.
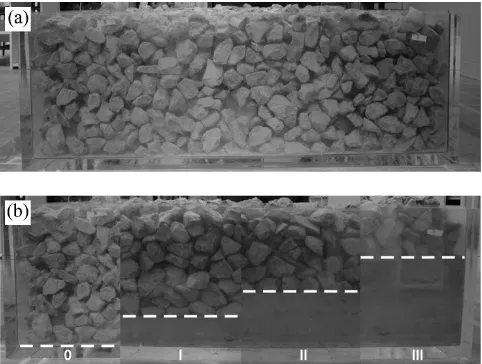
Fig. 8 shows the tank filled with clean ballast (Fig. 8(a)) and an all-in-one image of the above four configurations merged together (Fig. 8b)).
Fig. 8. (a) Methacrylate tank filled with clean ballast aggregates; (b) all-in-one image of the four scenarios merged together (the dashed lines separate the clean (top) from the uniformly-fouled (bottom) ballast layer).
5. RESULTS
In order to minimize the stochastic variability of the signals, a number of 100 traces were collected at each reproduced scenario and the average trace was taken. In view of this, one unique (average) A-scan was related to each tested configuration. The average traces representative of the four investigated scenarios are depicted in Fig. 9. Thereby, the value of the relative dielectric permittivity εr of the ballast/air/pollutant mix was inferred
from each of these traces using differing processing techniques.
Fig. 9. Average traces obtained for the four tested scenarios. Line styles indicate the different scenarios, whereas the markers point out the position of the reflection peaks at the interfaces between the air-ballast and the ballast-metal plate.
The time-domain signal picking (TDSP) technique [38] accounts for the time interval between the reflection peaks of the first (air/ballast) and the last interface (ballast/PEC), i.e., the two-way travel time t taken by the EM wave for propagating through the material. Since the thickness h of the tank is known, it is possible to infer the propagation speed v=2h/t, hence, the relative dielectric permittivity as follows:
2 0
) (
v c
r
(6)
The surface reflection method (SRM) [39] is based on the comparison between the amplitude A0 of the
reflection peak from the air/surface interface, and the reference amplitude APEC reflected by a metal plate
(perfect electric conductor (PEC)) larger than the GPR footprint. The relevant relationship is expressed as follows: 2 0 0 ) 1 ( ) 1 ( PEC PEC r A A A A (7)
In order to reach the maximum accuracy in the estimation of the permittivity, both the amplitudes must be recorded at the same height from the reflector. In this regard, it is worth to emphasize on the difficulty to reach a stable value for the height during the operations. This is due to the size and the rough shape of the ballast aggregates which cannot provide a smooth reflection interface.
5.2 Relative dielectric permittivity estimate by theoretical models
The volumetric mixing formula (VMF) approach [40] was performed to compute the dielectrics using a theoretical multi-phase modelling of the scenarios investigated. This method requires the knowledge of both the relative dielectric permittivity εr,iand the corresponding volumetric fraction fi of each ith component of the
mix. These parameters are arranged in the linear combination given by Eq (8):
i i ir f (8)
with α being a geometric fitting parameter, whose values were investigated in the literature [41-44]. In this study, a value of 0.5 was used for the α factor. Table 4 lists the parameters set in Eq. (8).
Table 4 Values of the parameters set in Eq. (8).
ith Component ε
r,i fi (FL 0)* fi (FL I) fi (FL II) fi (FL III)
Ballast 6.50 0.53 0.53 0.53 0.53
A4 Soil 5.03 0.00 0.08 0.16 0.24
Air 1.00 0.39 0.31 0.22 0.14
*FL – Fouling Level
The values of the dielectric permittivity of the ballast (i.e., the dielectrics of the source limestone-derived rock) and the methacrylate were derived from the literature [45]. The dielectric permittivity of the A4 silty soil was assessed by the application of the TDSP technique on the GPR data collected within a 0.10 m height layer of this material (laid out within the (same) empty methacrylate tank).
5.3 Methods comparison
Comparisons between the outcomes of each of the two signal processing-based methods and the VMF are given in Fig. 10. The results obtained from the full set of used antenna frequencies are depicted.
With regard to the permittivity estimates by the TDSP technique (Fig. 10(a)), it is worth noting the overall good agreement between the dielectrics achieved in all the case-scenarios across the full set of used frequencies. Values of permittivity comprised between 3.51 and 5.35, which raise consistently with the increasing levels of fouling, were observed. This behaviour accords with the theoretical assumptions of increasing rates of air voids (εr,a = 1) that get progressively filled with the pollutant material, which is
characterized by a higher permittivity value (i.e., εr = 5.03). Thereby, the relative dielectric permittivity of the
Fig. 10. Relative dielectric permittivity estimates for the acquisitions made with the 1000 MHz, 2000 MHz EU, and 2000 MHz NA antenna systems using the TDSP and the VMF (a), and the SRM and the VMF (b).
values of permittivity with respect to both the VMF and the TDSP techniques and proved to be not suitable to assess both the clean and the fouled ballast condition across all the investigated scenarios. A possible motivation for this mismatching falls within the amplitude-based nature of the own method and the coarse grain size and rough shape of the ballast aggregates. Indeed, the SRM relies on the value of the first-peak amplitude of the collected signal, which in turn depends on several factors including the configuration of the air-surface interface. In this regard, it is worth mentioning that the surface configuration of the four scenarios (i.e., the arrangement of the clean ballast aggregates at the top of the tank) has changed in all the investigated cases, due to the requirements of the testing protocol for laying out the material (i.e., Section 4.4.3). In addition, it is well-known how the wavelength of the signal is a critical survey parameter in the case of railway ballast, due to the variability of the dimension and shape of the aggregates, as well as of the volume of the air-filled voids (which can vary according to the fouling level). The consistency between the wavelength of a GPR signal and the dimension of the targets in a railway track bed (e.g., the ballast aggregates or the air voids) generates considerable scattering patterns and affects, amongst the other, the first-peak amplitude of the signal. As a rule of thumb, the lower is the frequency of investigation, the longer is the signal wavelength, the smaller will be the scattering generated by the ballast aggregates and the air voids. In such a case, the energy extracted to the signal will be lower [24, 46]. According to the wavelengths of the two central frequencies used in this study, it can be seen how the highest permittivity values closer to the above VMF (and TDSP) permittivity estimates (which are both expected to well approximate the searched dielectrics), were reached by the 1000 MHz GPR system (Fig. 10(b)). Indeed, this is due to the longer wavelength and the lower sensitivity of this antenna frequency towards the rough shape of the surface aggregates and the dimensions of the air voids. This fact generates less scattering and lower impact on the first-peak amplitude of the signal. Thereby, permittivity estimates much closer to the expected ones were reached.
5.4 Validation through the numerical simulation
A new simulation-based methodology was introduced for generation of the synthetic GPR response from the investigated experimental scenarios and the validation of the results discussed in Section 5.3.
RSA paradigm was first used for generating random bi-dimensional (2-D) distributions of the compacted ballast aggregates, which were schematically represented by a comprehensive set of circumferences with different diameters. The RSA algorithm follows two main steps. As a first mandatory selection condition, the grain size distribution of the circumferences needs to comply with the experimental (actual) one (i.e. Table 1). As a result, the algorithm returned an amount of 200 circumferences, on the average, with diameters ranging from 2.5·10-2 m and 8·10-2 m. The second step of the RSA algorithm allows compacting the circumferences along the vertical axis for ensuring the contacts between the aggregates and reaching a content of voids equal to 39%. This value was constrained to the one obtained from the standard test methods in the laboratory. Afterwards, the generated 2-D scenario was simulated using the FDTD technique implemented in the gprMax 2D simulator [51]. The physical structure of the GPR antenna was not included in the model. The real test environment was reproduced by positioning a source of a line of current in the free space at a height from the target equals to the actual height of the antenna source. The exact test domain was accurately designed with respect to the size of the tank, the layers composing the investigated multi-phase system (ballast/methacrylate/PEC) and the dielectric properties of the materials involved (Fig. 11). Detailed information about the simulation can be found in Benedetto et al. [52].
Fig. 11. The simulation domain.
Fig. 12. Comparison between measured (dashed line) and simulated data (solid line) for the investigated scenarios: 0.48 m of clean ballast –Scenario 0 - (a); 0.10 m of fouled ballast beneath 0.38 m of clean ballast – Scenario I - (b); 0.20 m of fouled ballast beneath 0.28 m of clean ballast–Scenario II - (c), 0.30 m of fouled ballast beneath 0.18 m of clean ballast –Scenario III - (d).
6. CONCLUSION AND FUTURE PERSPECTIVES
This work reports on the GPR-based assessment of railway ballast which was progressively “polluted” with a fine-grained silty soil material. The experimental setup was designed to represent a real-life scenario of a railway track bed. To this purpose, a methacrylate square-based tank sized 1.47 m × 1.47 m × 0.48 m height was manufactured and filled with clean ballast aggregates. The air-filled inter-particle voids were progressively “polluted” with a fine-grained silty soil, classified as A4 according to the AASHTO soil classification. Four
dielectric permittivity by the TDSP technique were further confirmed by the numerical-based simulation method implemented by the combination of the random-sequential (RSA) paradigm and the finite-difference time-domain (FDTD) technique. Indeed, the time position of the two main peaks of reflection (i.e., the peaks relative to the reflections from the air/ballast and the ballast/PEC interfaces) matched relatively well in both the simulated and the measured data.
It is important to emphasize on the significance of the RSA paradigm coupled with the FDTD technique used for the data processing. This was proved to be crucial and effective for the simulation of the GPR signal as well as in generating synthetic GPR responses close to the experimental data. The relatively good agreement between the measured and the simulated GPR data paves the way for future research at investigating more complex multi-phase configurations of ballast/air/fouling components.
ACKNOWLEDGEMENTS
The authors express their thanks to Mr. Spartaco Cera, from Roma Tre University, for the technical assistance and the invaluable help provided during the laboratory surveys. Special thanks to IDS Georadar for supplying part of the GPR antenna systems and Clax Italia s.r.l. for manufacturing the methacrylate tank. This work has
also benefited from the network activities carried out within the EU funded COST Action TU1208 “Civil
Engineering Applications of Ground Penetrating Radar.”
REFERENCES
1. M.R. Clark, R. Gillespie, T. Kemp, D.M. McCann, M.C. Forde, Electromagnetic properties of railway ballast, NDT
& E Int. 34 (2001) 305–311.
2. E.T. Selig, B.I. Collingwood, S.W. Field, “Causes of fouling in track”, AREA Bulletin, 71, 1998
3. EN 13450:2002/AC:2004. Aggregates for railway ballast. European Committee for Standardization, 2004.
4. EN 933-1:2012. Tests for geometrical properties of aggregates - Part 1: Determination of particle size distribution -
Sieving method. European Committee for Standardization, 2012.
5. EN 933-4:2008. Tests for geometrical properties of aggregates - Part 4: Determination of particle shape - Shape
6. EN 1097-2:2010. Tests for mechanical and physical properties of aggregates - Part 2: Methods for the determination
of resistance to fragmentation. European Committee for Standardization, 2010.
7. EN 1097-6:2013. Tests for mechanical and physical properties of aggregates - Part 6: Determination of particle
density and water absorption. European Committee for Standardization, 2013.
8. EN 1097-3:1998. Tests for mechanical and physical properties of aggregates - Part 3: Determination of loose bulk
density and voids. European Committee for Standardization, 1998.
9. CEN ISO/TS 17892-1:2014. Geotechnical investigation and testing - Laboratory testing of soil - Part 1:
Determination of water content (ISO 17892-1:2014). European Committee for Standardization, 2014.
10. ASTM D4318-10e1. Standard Test Methods for Liquid Limit, Plastic Limit, and Plasticity Index of Soils, ASTM
International, West Conshohocken, PA, 2010.
11. American Association of State Highway and Transportation Officials (AASHTO) 2011. Roadside Design Guide, 4th
edn. AASHTO, Washington, DC.
12. EN ISO 17892-3:2015. Geotechnical investigation and testing - Laboratory testing of soil - Part 3: Determination of
particle density (ISO 17892-3:2015, Corrected version 2015-12-15). European Committee for Standardization, 2015.
13. A. Benedetto, L. Pajewski, Civil Engineering Applications of Ground Penetrating Radar, Springer Transactions in
Civil and Environmental Engineering Book Series, 2015.
14. D. Goodman, Ground-penetrating radar simulation in engineering and archaeology, Geophysics, 59 (2) (1994)
224-232.
15. F. Tosti, L. Pajewski, Applications of radar systems in Planetary Sciences: an overview, Chapt. 15 – Civil
Engineering Applications of Ground Penetrating Radar, Springer Transactions in Civil and Environmental
Engineering Book Series, pp. 361–371, 2015.4-232, 1994.
16. J.J. Schultz, M.E. Collins A.B. Falsetti, Sequential monitoring of burials containing large pig cadavers using
ground-penetrating radar, J. Forensic Sci. 51 (3) (2006) 607-616.
17. R. Roberts, A. Schutz, I.L. Al-Qadi, E. Tutumluer, Characterizing railroad ballast using GPR: recent experiences in
the United States, in Proc. of the 2007 4th International Workshop on Advanced Ground Penetrating Radar (IWAGPR
2007), Naples, Italy, Jun. 2007.
18. Railway Track and Structures Magazine, June 1985.
19. J. Hugenschmidt, Railway track inspection using GPR, Journal Appl. Geophys., 43 (2-4) (2000) 147–155.
20. G.R. Olhoeft, E.T. Selig, Ground penetrating radar evaluation of railroad track substructure conditions, in Proc. 9th
21. Z. Leng, I.L. Al-Qadi, Railroad ballast evaluation using ground-penetrating radar, Transp. Res. Rec. 2159 (2010)
110–117.
22. F. De Chiara, Improvement of railway track diagnosis using Ground Penetrating Radar, PhD Thesis, 2014.
23. I.L. Al-Qadi, S. Zhao, P. Shangguan, Railway ballast fouling detection using GPR data: introducing a combined
time–frequency and discrete wavelet techniques, Near Surf. Geophys. 14 (2) (2016) 145-153.
24. I.L. Al-Qadi, W. Xie, R. Roberts, Scattering analysis of ground-penetrating radar data to quantify railroad ballast
contamination, NDT & E Int. 41 (6) (2008) 441-447.
25. H. Jol, “Ground Penetrating Radar”, Book, Ed. Elsevier, 2009.
26. D. Li, J. Hyslip, T.R. Sussmann, S. Chrismer, Railway geotechnics, Ed. Taylor and Francis, 2015.
27. T.R. Sussmann, M. Ruel, S. Christmer, Sources, influence, and criteria for ballast fouling condition assessment. In:
Proceeding of the 91st Annual Meeting of the Transportation Research Board, 11 pp, 2012.
28. F. Tosti, C. Patriarca, E.C. Slob, A. Benedetto, S. Lambot, Clay content evaluation in soils through GPR signal
processing, J. Appl. Geophys. 97 (2013) 69–80.
29. F. Tosti, A. Benedetto, L. Bianchini Ciampoli, S. Lambot, C. Patriarca, E.C. Slob, GPR analysis of clayey soil
behaviour in unsaturated conditions for pavement engineering and geoscience applications, Near Surf. Geophys. 14
(2) (2016) 127-144.
30. B. Indraratna, L.J. Su, C.A. Rujikiatkamjorn, A new parameter for classification and evaluation of railway ballast
fouling, Can. Geotech. J., 48 (2) (2011) 322-326.
31. N. Tennakoon, B. Indraratna, C. Rujikiatkamjorn, S. Nimbalkar, T. Neville, The role of ballast-fouling characteristics
on the drainage capacity of rail substructure, Geotech. Test. J., 35 (4) (2012) 1-12.
32. L. Pajewski, F. Tosti, W. Kusayanagi, Antennas for GPR Systems, Chapter 2 - Civil Engineering Applications of
Ground Penetrating Radar, Springer Transactions in Civil and Environmental Engineering Book Series, 41–67, 2015.
33. R. Roberts, I. Al-Qadi, E. Tutumluer, J. Boyle, and T.R. Sussmann, Advances in Railroad Ballast Evaluation Using
2 GHz Horn Antennas, in Proc. 11th International Conference on Ground Penetrating Radar, Columbus, OH., USA,
2006.
34. ASTM D6087-08, “Standard Test Method for Evaluating Asphalt-Covered Concrete Bridge Decks Using Ground
Penetrating Radar,” ASTM International, West Conshohocken, PA, 2008.
35. J.S. Mundrey, Railway track engineering, Tata McGraw-Hill Education Ed., 2009.
36. F. Benedetto, F. Tosti, A signal processing methodology for assessing the performance of ASTM standard test
37. EN 13286-2:2005, “Unbound and hydraulically bound mixtures - Part 2: Test methods for the determination of the
laboratory reference density and water content - Proctor compaction. European Committee for Standardization, 2015.
38. R.Wu, J. Li, Z.S. Liu, Super resolution time delay estimation via MODEWRELAX. IEEE Aero. Elec. Sys. 35 (1)
(1999) 294–307.
39. J. Redman, J. Davis, L. Galagedara, G. Parkin, Field studies of GPR air launched surface reflectivity measurements
of soil water content, in Proc. of the 9th International Conference on Ground Penetrating Radar (GPR 2002), Santa
Barbara, California, USA, 2002, art. no. 4758, pp. 156-161.
40. J.R. Birchak, C.G. Gardner, J.E. Hipp, J.M. Victor, High dielectric constant microwave probes for sensing soil
moisture. Proceedings of the IEEE 62, (1974) 93–102.
41. K., Lichtenecker, K. Rother,: Die herleitung des logarithmischen mischungsgesetzes aus allgemeinen prinzipien der
stätionaren strömung. Phys. Z. (1931) 32 255–260.
42. K. Roth, R. Schulin, H. Fluhler, W. Attinger, Calibration of time domain reflectometry for water content
measurement using composite dielectric approach, Water Resour. Res. 26 (1990) 2267–2273
43. A. Brovelli, G. Cassiani, Effective permittivity of porous media: a critical analysis of the complex refractive index
model, Geophys. Prospect. 56 (2008) 715–727.
44. C. Patriarca, F. Tosti, C. Velds, A. Benedetto, S. Lambot, E.C. Slob, Frequency dependent electric properties of
homogeneous multi-phase lossy media in the ground-penetrating radar frequency range, J. Appl. Geophys. 1(97)
(2013) 81–88.
45. W. E. Fensler, E. F. Knott, A. Olte, K. M. Siegel, The electromagnetic parameters of selected terrestrial and
extraterrestrial rocks and glasses, The moon, (Kopal, Z., and Mikhailov, Z.K., Ed) IAU Symposium 14, 545-565.
46. M.C. Forde, R. De Bold, G. O’Connor, J.P. Morrissey, New analysis of Ground Penetrating Radar testing of a mixed
railway trackbed, Transportation Research Board Annual Meeting, 2010.
47. A. Benedetto, A. Umiliaco, Evaluation of hydraulic permeability of open-graded asphalt mixes using a full numerical
simulation, J. Mater. Civil Eng. 26 (4) (2014) 599-606.
48. K.S. Kunz, R.J. Luebbers, The Finite Difference Time Domain Method for Electromagnetics”, CRC Press, 1993.
49. A. Taflove, Computational Electrodynamics: The Finite-Difference Time-Domain Method, Artech House, 1995.
50. K.S. Yee, Numerical solution of initial boundary value problems involving Maxwell’s equations in isotropic media,
IEEE T. Antenn. P. 14 (1966) 302-307.
52. A. Benedetto, F. Tosti, L. Bianchini Ciampoli, L. Pajewski, D. Pirrone, A. Umiliaco, M.G. Brancadoro, A
simulation-based approach for railway applications using GPR, in Proceedings of the 2016 International Conference of Ground

![Fig. 1. Test procedure for the wire basket method [7]: (a) sampling and measurement of the aggregates by](https://thumb-us.123doks.com/thumbv2/123dok_us/999263.1599715/9.595.57.541.67.476/fig-test-procedure-basket-method-sampling-measurement-aggregates.webp)