Queensland Coastal Wetland Resources: Cape Tribulation to Bowling Green Bay
95
0
0
Full text
(2) QI01064 ISSN 0727-46273 This report may be cited as: Bruinsma, C (2001). Queensland Coastal Wetland Resources: Cape Tribulation to Bowling Green Bay. Information Series QI01064. Department of Primary Industries, Queensland, Brisbane.. General disclaimer Information contained in this publication is provided as general advice only. For application to specific circumstances, professional advice should be sought. The Department of Primary Industries, Queensland has taken all reasonable steps to ensure that the information contained in this publication is accurate at the time of production. Readers should ensure that they make appropriate inquiries to determine whether new information is available on the particular subject matter.. ©. The State of Queensland, Department of Primary Industries, 2001. Copyright protects this publication. Except for purposes permitted by the Copyright Act, reproduction by whatever means is prohibited without prior written permission of the Department of Primary Industries, Queensland. Inquiries should be addressed to: Manager, DPI Publications Department of Primary Industries GPO Box 46 Brisbane Qld 4001. Acknowledgments Funding provided by Environment Australia supported the research and collation of information presented in this report. The project was undertaken for the Marine Protected Areas Program, Coast and Clean Seas, Natural Heritage Trust. The views and opinions expressed in this report are those of the author and do not reflect those of the Commonwealth Government, the Minister for the Environment or the Director of National Parks and Wildlife. Landsat TM satellite imagery was acquired by the Australian Centre for Remote Sensing (ACRES), a business unit of the Australian Surveying and Land Information Group (AUSLIG), Australia's national mapping agency. http://www.auslig.gov.au. Copies of the report may be borrowed from the library: Environment Australia, GPO Box 787, CANBERRA ACT 2601 Australia.
(3) EXECUTIVE SUMMARY This report provides key resource data for the ongoing assessment of the requirement for additional Marine Protected Areas (e.g. FHAs under the Queensland Fisheries Act 1994) in regions of high fish habitat value in northern Queensland from Cape Tribulation to Bowling Green Bay (hereafter referred to as the Study Area). The study also provides baseline information on the coastal wetlands within this Study Area for consideration in the Ramsar site nomination process. The project aimed to: 1. document and map the coastal wetland communities of the Study Area; 2. document levels of existing disturbance to and protection of the wetlands; 3. examine existing recreational, indigenous and commercial fisheries resources in the region; 4. evaluate the conservation values of the areas investigated from the viewpoint of fisheries productivity and as habitat for important and/or threatened species for future FHA/MPA declaration. The mapping of Queensland’s coastal wetland environments by the Queensland Department of Primary Industries (QDPI), Queensland Fisheries Service (QFS) has been an ongoing process, underway since the mid-1990s. The current mapping of the region from Cape Tribulation to Bowling Green Bay marks the completion of the spatial assessment of the coastal wetland resources of the entire Queensland coastline. This systematic exercise has been undertaken using a standard protocol that was developed by the QFS (Danaher 1995a) and has been recognised (Ward et al. 1998) as an appropriate model for a national approach to coastal wetland mapping. The QFS Queensland Coastal Wetland Mapping Project has been supported by funding from the Cape York Peninsula Land Use Strategy (CYPLUS), the Great Barrier Reef Marine Park Authority (GRBMPA) through Ocean Rescue 2000 and Environment Australia through the Natural Heritage Trust Coasts and Clean Seas Marine Protected Areas Program. The project has been undertaken in a number of phases. The current study forms the last stage of a three-year phase that has been supported by funding from Environment Australia through the Natural Heritage Trust Coasts and Clean Seas Marine Protected Areas Program. Table I summarises the details of this project. Figure 1, Section 1 displays the project areas. Project Effectiveness and Limitations The method of investigating and mapping coastal wetland communities of relatively large coastal regions, utilised in this study, has proven to be cost effective at this scale with a high degree of accuracy (90%). The information presented in the report has been provided to the QDPI Queensland Fisheries Service, Marine Habitat Unit staff responsible for FHA declaration, for the purpose of incorporation into FHA planning processes relevant to the Study Area. It has been demonstrated, in this and previous departmental studies (see Table 1), that this technique developed for broad scale coastal wetlands mapping is transferable to similar coastal wetland systems. Landsat TM data is widely available. However, the spatial and spectral resolutions of the Landsat TM sensor result in some limitations. The smallest community that can be detected by the Landsat TM sensor is a community equal to or larger than a pixel (that is, 25 x 25 m). The spectral resolution of the data is too low (seven wide bands of information collected) to be able to distinguish spectrally similar species. Additionally, polygons of less than 0.5 ha are eliminated in the mapping process. The Queensland Coastal Wetland Resources: Cape Tribulation to Bowling Green Bay. i.
(4) mapping technique is generally more accurate in areas where clear zonation in coastal wetland communities occurs. The resolution of the satellite imagery and the mapping process used results in a product that should not be interpreted at more detailed scales, that is larger than 1: 100 000. An overall evaluation of the project is included in Appendix 7. TABLE I Details of the Queensland coastal wetland resources project supported by funding from Environment Australia through the Natural Heritage Trust Coasts and Clean Seas Marine Protected Areas Program. SPECIFIC FUNDING FUNDING MPA PROJECT AGENCY REPORT DECLARATION? DETAILS AREA CONTRIBUTION A) Stage 1 Noosa to Town of Seventeen Seventy (southern Queensland) (1998-1999) Baffle Creek – FHA Bruinsma, C and Danaher, K declared Sep 2001. (2000). Queensland Coastal Elliott River – initial Wetland Resources: Round Round Hill MPA FHA consultation $56 985 Hill Head to Tin Can Inlet. Head to Tin 97/98 nearing completion, QI99081. Department of Can Inlet funding FHA declaration Primary Industries, proposed for early Queensland, Brisbane, 101 pp. 2002. B.1) Stage 2 Fitzroy River to St Helens (Central Queensland) (1999-2000) Bruinsma, C (2000). Narrows / Fitzroy Queensland Coastal Wetland Sand Bay to Delta – seeking Resources: Sand Bay to MPA Keppel NHT funding, FHA $64 504 (= total Keppel Bay. QI00100. Bay, 98/99 for Stage 2) consultation to Department of Primary funding Central commence early Queensland Industries, Queensland, 2002. Brisbane, 94 pp. B.2) Stage 2 Flinders River to the Northern Territory Border (Gulf of Carpentaria) (1999-2000) Bruinsma, C and Duncan, S The (2000). Queensland Coastal Recommendations Northern for additional FHAs Wetland Resources: the NT MPA Territory border to Flinders River. 98/99 to regional AS ABOVE Border to QI00099. Department of implementation funding Flinders Primary Industries, staff. River Queensland, Brisbane, 72 pp. C.1) Stage 3 Whitsundays to Edgecumbe Bay (2000-2001) Cape Bruinsma, C and Danaher, K Gloucester (2001). Queensland Coastal Recommendations to Conway for additional FHAs Wetland Resources: The MPA $61 478 (= total Inlet Whitsunday region. QI01065. to regional 99/00 for Stage 3) (does not Department of Primary implementation funding include staff. Industries, Queensland, Edgecumbe Brisbane. Bay) C.2) Stage 3 Cape Bowling Green to Cooktown (North Queensland) (2000-2001) Bruinsma, C (2001). Queensland Coastal Wetland Recommendations Cape for additional FHAs Resources: Cape Tribulation MPA Tribulation to Bowling Green Bay. 99/00 to regional AS ABOVE to Bowling implementation QI01064. Department of funding Green Bay Primary Industries, staff. Queensland, Brisbane, 85 pp.. QFS CONTRIBUTION. $79 949. $77 908 (= total for Stage 2). AS ABOVE. $59 152 (= total for Stage 3). AS ABOVE. Coastal Wetland Communities of the Study Area The coastal wetland communities of the Study Area are characterised by high species diversity and a general absence of Saltpans. The warm climate and large volume of freshwater entering the estuaries due to high rainfall within the catchments support a large number of mangrove species and mangrove associates throughout the intertidal zone. Drier catchments at the southern extent of the Study Area, such as the Black, Ross and Haughton, have a larger proportion of Saltpan within the intertidal zone. Hypersaline ii. Queensland Coastal Wetland Resources: Cape Tribulation to Bowling Green Bay.
(5) conditions within these coastal wetland systems inhibit the growth of mangrove species and allow a greater area of Saltpan development. The two largest contiguous areas of coastal wetland vegetation within the Study Area can be found in the Hinchinbrook Channel region and Bowling Green Bay. However, these two coastal wetland systems are considerably different in the species assemblages that are present. High rainfall in the Hinchinbrook region promotes the growth of many mangrove species and communities that reach heights of up to 30 m. In contrast, the coastal wetland vegetation in Bowling Green Bay area is characterised by low communities (generally less than 10 m) and large areas of Saltpan. Within the entire Study Area, Closed Rhizophora is the dominant community type in terms of area, followed by Saltpan, Closed Ceriops and Closed Mixed. However, within individual estuaries the dominance of these community types may be quite varied. Diverse Closed Mixed communities dominate some areas, particularly those coastal wetland systems in high rainfall catchments (e.g. Tully catchment). Although a single species (e.g. Ceriops tagal) may be quite common throughout the intertidal zone in these areas, mappable monospecific communities consisting of just this species (e.g. Closed Ceriops) are rare.. TABLE II Areas of coastal wetland communities within the Study Area. AREA (ha) Closed Rhizophora Closed Avicennia Open Avicennia Closed Ceriops Open Ceriops Closed Rhizophora/Avicennia Closed Avicennia/Ceriops Open Avicennia/Ceriops Closed Mixed Closed Bruguiera Saline Grassland Saltpan Samphire-dominated Saltpan TOTAL. 20 974 2 037 113 14 885 237 76 98 5 11 340 1 769 1 219 20 216 3 030 75 999. % OF TOTAL 27.60 2.68 0.15 19.59 0.31 0.10 0.13 0.01 14.92 2.33 1.60 26.60 3.99. Threats to Coastal Wetland Communities Current threats to coastal wetland communities in the Study Area range from local threats due to coastal development to catchment-wide threats due to poor land management practices. Grazing and agricultural cultivation are the dominant land uses within the catchments of the Study Area. These land uses can potentially have a detrimental impact on water resources and habitats in the catchment. The focus of this study has been tidal coastal wetland systems. The area of tidal coastal wetland vegetation in many catchments in the Study Area has remained relatively static over the past few decades. However, a general trend in freshwater wetland habitat loss in the Study Area has been identified. This trend is current throughout Queensland. State of Environment Queensland reporting has identified loss of freshwater wetlands as a key issue in the coastal zone with only freshwater wetlands on the more Queensland Coastal Wetland Resources: Cape Tribulation to Bowling Green Bay. iii.
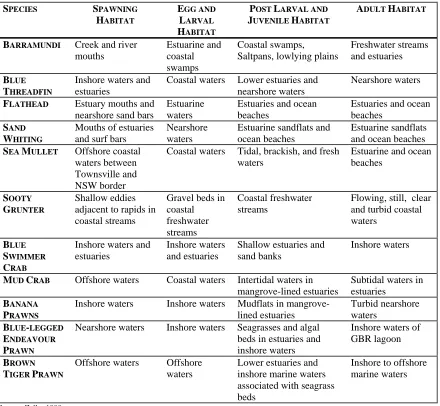
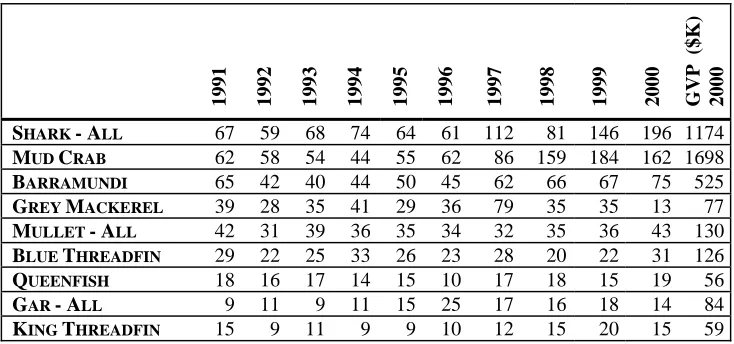
(6) remote coasts escaping some degree of modification or loss (EPA 1999a). Increasing usage of coastal plains for urban and agricultural landuses creates a pressure on these important fish habitats. To date, efforts for fish habitat protection (through FHAs) have focused on tidal coastal wetland habitats and adjacent freshwater habitats have been largely excluded. Freshwater coastal wetlands provide habitat for fisheries species at various life cycle stages and contribute nutrients to the other tidal habitats, particularly in periods of high freshwater flow. Protection of Coastal Wetland Communities Important fish habitats within this Study Area are well represented in existing declared FHAs, Marine Parks and National Parks. Of the approximately 76 000 ha of coastal wetland vegetation in the Study Area, 15 175 ha is currently protected within declared FHAs. The Bowling Green Bay coastal wetlands are also recognised as wetlands of international importance under the Ramsar Convention. Recommendations to extend the current protected area network in areas where important habitats are not protected are made below. Fisheries Resources of the Study Area The coastal wetland habitats of the Study Area support productive commercial, recreational and indigenous fisheries. In 2000, the gross value of production of the main species of the inshore and estuarine commercial fishery alone was close to $4 million. The main species contributing to this fishery in the Study Area include shark, mud crab, barramundi, grey mackerel, mullet, blue and king threadfin, queenfish and gar. The trawl fishery, targeting prawns and saucer scallops is also very productive in the Study Area. In particular, the catch of banana prawns in the Study Area represents a significant proportion of the statewide catch of banana prawns. Recommendations The current study confirms the fisheries value for the declared FHAs in this Study Area and identifies the need for expansion of the existing marine protected area network (Section 9.4). The following recommendations for new FHAs in the Study Area should be considered: ♦. ♦. ♦. iv. No FHAs have been declared north of Half Moon Creek FHA in the Wet Tropic Coast IMCRA region. In this region, the coastal wetland vegetation of Alexandra Bay and the Daintree River are important fish habitat, suitable for consideration for FHA status. • Consideration should be given to establishing a FHA in the Daintree catchment to cover tidal and adjacent freshwater wetlands currently excluded from Marine Parks. • The fish habitat values of the coastal wetland vegetation of Alexandra Bay, as well as the biodiversity and naturalness values of this estuary should be recognised and management measures to protect these values investigated. Within the Study Area, a large gap in the FHA network exists from the Trinity Inlet FHA to the Hull River FHA. • In this region, the estuaries of the Mulgrave–Russell Rivers, Moresby River and Maria Creek should be considered for inclusion in FHAs. The fish habitats of Cleveland Bay, including a large area of coastal wetland vegetation, which is currently tenured as State Land, should be considered for inclusion in a FHA. Queensland Coastal Wetland Resources: Cape Tribulation to Bowling Green Bay.
(7) Extension of some existing FHAs is also recommended: ♦. ♦. ♦. Of a high priority is the extension of the Tully River FHA to include the diverse coastal wetland vegetation in this estuary that is not currently protected by either a Marine Park or a National Park. The current Tully River FHA does not include a large proportion of coastal wetland vegetation. Extension of the Bowling Green Bay FHA to include both freshwater and tidal wetlands should be considered as a priority. In particular, fish habitat along the Haughton River, upstream of the existing Marine Park should be considered. This area is currently recognised as wetland of international importance (Bowling Green Bay Ramsar site). However, this area is excluded from protection in the Bowling Green Bay FHA, National Park and Marine Park. The Hull River, Palm Creek and Cattle Creek FHAs contain only a very small area of the coastal wetland vegetation in these estuaries. Consideration should be given to extending these FHAs to include coastal wetland vegetation adjacent to the current boundary. In particular, both tidal and freshwater wetlands in the Halifax Bay area (adjacent to the Palm Creek and Cattle Creek FHAs) should be considered for inclusion in FHAs.. The focus of this study has been tidal coastal wetlands, namely mangrove and saltmarsh communities. However, the study has highlighted the need for protection of freshwater coastal wetlands. Within the Study Area, freshwater coastal wetlands have decreased significantly in area over the past few decades. Protection of any remaining freshwater wetlands in the Study Area is recommended as a priority, in order to provide protection for a wide variety of habitats necessary for the life cycles of fisheries species and maintain the connectivity between these habitats.. Queensland Coastal Wetland Resources: Cape Tribulation to Bowling Green Bay. v.
(8) TABLE OF CONTENTS Executive Summary Project Effectiveness and Limitations Coastal Wetland Communities of the Study Area Threats to Coastal Wetland Communities Protection of Coastal Wetland Communities Fisheries Resources of the Study Area Recommendations. i i ii iii iv iv iv. Table of Contents. vi. Section 1 Introduction. 1. 1.1 Project Scope 1.2 Project Rationale and Status. Section 2 Background. 1 2. 4. 2.1 The Study Area 2.2 Coastal Wetland Environments Fish Habitats Mapped in this Study Mangroves Saltmarshes Other Fish Habitats not Mapped in this Study Seagrasses Intertidal Flats, Rocky Foreshores and Coral Reefs Freshwater Coastal Wetlands Connectivity. 4 7 7 7 9 10 10 11 11 11. Section 3 Methods. 12. 3.1 Data 3.2 Mapping Methods 3.3 Field Methods 3.4 Classification Details 3.5 Accuracy Assessment 3.6 Overview Map of Fish Habitats 3.7 Assessment of Coastal Wetlands for Fish Habitat Area Nomination. Section 4 Results 4.1 Description of the Mapping Units 4.2 Accuracy Assessment 4.3 Limitations of the Mapping Technique. Section 5 Distribution and Significance of the Coastal Wetlands 5.1 General Distribution 5.2 Coastal Wetland Distribution by Catchment Daintree Catchment Mossman Catchment Barron Catchment Mulgrave–Russell Catchment Johnstone Catchment Tully Catchment Murray Catchment vi. Queensland Coastal Wetland Resources: Cape Tribulation to Bowling Green Bay. 12 13 14 14 15 15 16. 17 17 23 24. 25 25 27 27 28 29 30 31 32 34.
(9) Herbert Catchment Black Catchment Ross Catchment Haughton Catchment 5.3 Comparison of Coastal Wetland Communities in IMCRA regions 5.4 Mangrove Species Diversity. 35 36 37 38 39 40. Section 6 Disturbance of and Threats to Coastal Wetland Vegetation in the Study Area 42 6.1 Disturbance of Coastal Wetland Vegetation in the Study Area Changes to Coastal Wetland Vegetation Buffer Zones as a Management Tool 6.2 Current Threats to Coastal Wetland Vegetation General Threats to Coastal Wetland Vegetation Catchment-wide Threats to Coastal Wetland Vegetation. Section 7 Existing Conservation Measures and Conservation Values 7.1 Fish Habitat Areas 7.2 Ramsar Sites 7.3 Marine Parks The Great Barrier Reef Marine Park and World Heritage Area Cairns Marine Park Townsville Whitsunday Marine Park 7.4 National Parks 7.5 Directory of Important Wetlands in Australia. 42 42 43 43 43 44. 46 46 46 47 47 47 47 48 48. Section 8 Fisheries Resources in the Study Area. 50. 8.1 Fisheries Resources and their Habitat Requirements 8.2 Commercial Fishing Activities Trawl Fishery Tropical Inshore and Estuarine Fishery Other studies 8.3 Recreational and Indigenous Fishing Activities. 50 52 52 52 53 54. Section 9 Application of the Dataset to Fish Habitat Area Planning 9.1 FHA Declaration Process 9.2 Coastal Wetland Characteristics 9.3 Coastal Wetland Communities Currently Included in FHAs 9.4 Representative Areas to be Considered as Potential FHAs. 56 56 57 59 60. Section 10 Recommendations. 63. Section 11. References. 66. List of Appendices Appendix 1: Declared FHAs in Queensland Appendix 2: FHA Declaration Process and Management Options Appendix 3: Criteria for Ramsar Site Nomination Appendix 4: Satellite Remote Sensing Appendix 5: Metadata Listing Appendix 6: Distribution of Coastal Wetland Communities in the Study Area Appendix 7: Project Evaluation Appendix 8: Field Data Queensland Coastal Wetland Resources: Cape Tribulation to Bowling Green Bay. 70 71 76 78 79 80 81 83 vii.
(10) List of Tables and Figures TABLE I TABLE II FIGURE 1 TABLE 1 FIGURE 2.1 TABLE 2.1 TABLE 3.1 TABLE 3.2 FIGURE 3.1 TABLE 3.3 FIGURE 4.1 FIGURE 4.2 FIGURE 4.3 FIGURE 4.4 FIGURE 4.5 FIGURE 4.6 FIGURE 4.7 FIGURE 4.8 FIGURE 4.9 TABLE 4.1 TABLE 4.2 TABLE 5.1 FIGURE 5.1 TABLE 5.2 TABLE 5.3 TABLE 5.4 TABLE 5.5 TABLE 5.6 TABLE 5.7 TABLE 5.8 TABLE 5.9 TABLE 5.10 TABLE 5.11 TABLE 5.12 TABLE 5.13 TABLE 6.1 TABLE 6.2 TABLE 7.1 TABLE 8.1 TABLE 8.2 FIGURE 8.1 TABLE 8.3 FIGURE 8.2 TABLE 9.1 TABLE 9.2 TABLE 9.3 FIGURE 9.1. viii. Details of the Queensland coastal wetland resources project supported by funding from Environment Australia. ii Areas of coastal wetland communities within the Study Area. iii Queensland coastal wetland mapping regions. 2 Details of Queensland Fisheries Service Queensland coastal wetland mapping projects. 3 The Study Area: stretching from Cape Tribulation to Bowling Green Bay in tropical north Queensland. 5 Hydrology and catchment characteristics of estuaries within the Study Area. 6 Landsat TM satellite imagery utilised in this study. 12 Historical mapping used to aid the current mapping exercise. 12 Distribution of reference data utilised in this study. 13 Details of digital datasets used in the overview map of fish habitats. 16 Closed Rhizophora in the Moresby River. 18 Closed Avicennia at Half Moon Creek. 18 Closed Ceriops at Seymour River. 18 Closed Rhizophora/Avicennia on the bank of Alligator Creek. 20 Closed Mixed on the bank of Endeavour River. 20 Closed Bruguiera at Mosquito Creek. 20 Saline Grassland near the mouth of Ross River. 22 Saltpan at Blacksoil Creek. 22 Samphire-dominated Saltpan at Barramundi Creek. 22 Error matrix for the accuracy assessment of the coastal wetlands coverage. 23 Accuracy assessment of the coastal wetlands coverage. 24 Area of coastal wetland communities within the Study Area. 25 Overview of fish habitats in the Study Area. 26 Area (in hectares) of coastal wetland communities within the Daintree Catchment. 28 Area (in hectares) of coastal wetland communities within the Mossman catchment. 29 Area (in hectares) of coastal wetland communities within the Barron catchment. 30 Area (in hectares) of coastal wetland communities within the Mulgrave–Russell catchment. 31 Area (in hectares) of coastal wetland communities of the Johnstone catchment. 32 Area (in hectares) of coastal wetland communities of the Tully catchment. 33 Area (in hectares) of coastal wetland communities of the Murray catchment. 34 Area (in hectares) of coastal wetland communities of the Herbert catchment. 36 Area (in hectares) of coastal wetland communities of the Black catchment. 36 Area (in hectares) of coastal wetland communities of the Ross catchment, including Magnetic Island. 37 Area (in hectares) of coastal wetland communities in the Haughton catchment. 39 Coastal wetland communities by IMCRA region. 40 Development proposals that may impact upon coastal systems. 44 Major landuses and catchment management issues in the Study Area. 45 Conservation significance of important wetlands in Australia. 49 Habitat requirements for selected species of importance to the fisheries of the Study Area. 50 Fisheries values and major habitat types protected within FHAs in the Study Area. 51 Commercial catch in tonnes of banana and tiger prawns by 30 minute grid, 2000. 52 Total catch and Gross Value of Production (2000) of the main species of importance to the tropical inshore and estuarine fishery in the Study Area. 53 Commercial catch in tonnes of barramundi, mud crab, shark and threadfin by 30 minute grid, 2000. 55 Summary of characteristics of coastal wetlands of the Study Area. 57 Details of the coastal wetland significance assessment 58 Area of coastal wetland communities within FHA’s in the Study Area. 59 FHAs in the Wet Tropic Coast and Lucinda–Mackay Coast IMCRA regions. 62. Queensland Coastal Wetland Resources: Cape Tribulation to Bowling Green Bay.
(11) SECTION 1 INTRODUCTION 1.1 Project Scope Marine, estuarine and freshwater systems in Queensland are managed under the provisions of the Queensland Fisheries Act 1994 and Fisheries Regulation 1995. This legislation provides for the ‘management, use, development and protection of fisheries resources and fish habitats’. All marine plants throughout Queensland are specifically protected under this legislation. Key fish habitats are further protected through the declaration of Fish Habitat Areas (FHAs). The FHA concept focuses on the inclusion, linkage and management of all available habitat types within an area as a single unit, rather than simply protecting individual specific habitat types (McKinnon and Sheppard 2001). FHAs are part of the on-going management of fisheries resources within Queensland and are specifically declared to ensure continuation of productive recreational, indigenous and commercial fisheries in a region through habitat protection. Declaration publicly proclaims the value of the area from a fisheries viewpoint, and increases the statutory level of protection of the wetlands for community benefits. Appendix 1 displays the current distribution of declared FHAs of both Management A and B status in Queensland. Appendix 2 gives further details on the FHA declaration process and management options. Coastal wetland environments are important habitat for many species of birds, reptiles and marine life, which depend on these habitats for the provision of food, shelter, breeding and nursery areas. Different types of Marine Protected Areas have been established to protect and manage the various ecological, aesthetic, economic, social and cultural values of wetland habitats. FHAs fall within Category IV of the World Conservation Union (IUCN) categories for protected areas. Significant wetland areas are also protected through the declaration of Ramsar sites. Formal listing of Ramsar sites was the result of the Convention on Wetlands of International Importance. Coastal wetland resources are an important consideration in the nomination of these Ramsar sites. Further details of the criteria for the assessment of wetlands for Ramsar nomination can be found in Appendix 3. This report provides key resource data for the ongoing assessment of the requirement for additional Marine Protected Areas (e.g. FHAs under the Queensland Fisheries Act 1994) in regions of high fish habitat value in northern Queensland from Cape Tribulation to Bowling Green Bay (hereafter referred to as the Study Area). The study also provides baseline information on the coastal wetlands within this Study Area for consideration in the Ramsar site nomination process. The project aimed to: 1. 2. 3. 4.. document and map the coastal wetland communities of the Study Area; document levels of existing disturbance to and protection of the wetlands; examine existing recreational, indigenous and commercial fisheries resources in the region; evaluate the conservation values of the areas investigated from the viewpoint of fisheries productivity and as habitat for important and/or threatened species for future FHA/MPA declaration.. Queensland Coastal Wetland Resources: Cape Tribulation to Bowling Green Bay. 1.
(12) 1.2 Project Rationale and Status The mapping of Queensland’s coastal wetland environments by the Department of Primary Industries, Queensland Fisheries Service (QFS) has been an ongoing process, underway since the mid-1990s. The current mapping of the region from Cape Tribulation to Bowling Green Bay marks the completion of the spatial assessment of the coastal wetland resources of the entire Queensland coastline. This systematic exercise has been undertaken using a standard protocol that was developed by the QFS (Danaher 1995a) and has been recognised (Ward et al. 1998) as an appropriate model for a national approach to coastal wetland mapping. The results of other mapping exercises are summarised by mapping region in Table 1. Mapping regions are illustrated in Figure 1. There is a need to identify and map fish habitat for the management and conservation of fisheries resources through the declaration of MPAs (FHAs) and Ramsar sites, as well as a requirement for conducting further research into the interactions between fauna and the habitat. Studies combining data on habitat primary productivity, fish species associated with these habitats and feeding strategies of fish species will contribute to a better understanding of the relationships of particular habitats to fisheries productivity.. Project Areas (completion date) Current Study Area NT Border to the Flinders River (2000) SE Gulf of Carpentaria (1994) Cape York Peninsula (1993) The Burdekin Region (1994) The Bowen Region (1999) The Whitsunday Region (2001) Sand Bay to Keppel Bay (2000) The Curtis Coast Region (1998) Round Hill Head to Tin Can Inlet (1999) The Moreton Region (2000). QLD coastline data: Commonwealth of Australia, AUSLIG.. FIGURE 1 Queensland coastal wetland mapping regions.. 2. Queensland Coastal Wetland Resources: Cape Tribulation to Bowling Green Bay.
(13) NEW MPA DECLARATION?. REPORT REFERENCE. AREA. DATA CURRENCY (=DATE OF IMAGERY USED). PROJECT FUNDING. TABLE 1 Details of the Queensland Fisheries Service Queensland coastal wetland mapping projects.. Marine Protected Areas Program, Coast and Clean Seas, Natural Heritage Trust (1998-2001) A) ROUND HILL HEAD TO TIN CAN INLET. MPA 97/98. 1997. B.1) NT BORDER TO FLINDERS RIVER. MPA 98/99. 1995. B.2) CENTRAL QLD. MPA 98/99. 1995 1997. C.1) CAPE TRIBULATION TO BOWLING GREEN BAY. MPA 99/00. 1997 1998 1999. C.2) THE WHITSUNDAY REGION. MPA 99/00. 1997. Bruinsma, C and Danaher, K (2000). Queensland Coastal Wetland Resources: Round Hill Head to Tin Can Inlet. QI99081. Department of Primary Industries, Queensland, Brisbane, 101 pp. Bruinsma, C and Duncan, S (2000). Queensland Coastal Wetland Resources: the NT border to Flinders River. QI00099. Department of Primary Industries, Queensland, Brisbane, 72 pp. Bruinsma, C (2000). Queensland Coastal Wetland Resources: Sand Bay to Keppel Bay. QI00100. Department of Primary Industries, Queensland, Brisbane, 94 pp. Bruinsma, C (2001). Queensland Coastal Wetland Resources: Cape Tribulation to Bowling Green Bay. QI01064. Department of Primary Industries, Queensland, Brisbane, 85 pp. Bruinsma, C and Danaher, K (2001). Queensland Coastal Wetland Resources: The Whitsunday region. QI01065. Department of Primary Industries, Queensland, Brisbane.. Baffle Creek – FHA declared Sep 2001. Elliott River – initial FHA consultation nearing completion, FHA declaration proposed for early 2002.. Recommendations for additional FHAs to regional implementation staff.. Narrows / Fitzroy Delta – seeking NHT funding, FHA consultation to commence early 2002.. Recommendations for additional FHAs to regional implementation staff.. Recommendations for additional FHAs to regional implementation staff.. Marine Protected Areas Program (1996/1997) Project Number GO19/96. THE CURTIS COAST REGION. MPA G019/96a. 1997. THE BOWEN REGION. MPA G019/96b. 1994 1995. SE GULF OF CARPENTARIA. OR2000 G007/93. 1987 1988 1991 1992. Danaher, K, Bruinsma, C, Treloar, P and O’Neill, M (unpublished report). Queensland Coastal Wetland Resources of the Curtis Coast Region: Raglan Creek to Round Hill Head. Department of Primary Industries, Queensland, Brisbane. Bruinsma, C, Danaher, K, Treloar, P and Sheppard, R (1999). Coastal Wetland Resources of the Bowen Region: Cape Upstart to Gloucester Island. Department of Primary Industries, Queensland, Brisbane. Danaher, K and Stevens, T (1995). Resource Assessment of the Tidal Wetland Vegetation of Western Cape York Peninsula, North Queensland, Report to Ocean Rescue 2000. Department of Primary Industries, Queensland, Brisbane.. Narrows / Fitzroy Delta – as above.. Edgecumbe Bay – seeking NHT funding, FHA consultation scheduled to commence Jan 2002.. Recommendations for additional FHAs to regional implementation staff.. Other Mapping Projects. CAPE YORK PENINSULA. CYPLUS. 1986 1987 1988 1991. Danaher, K (1995a). Marine Vegetation of Cape York Peninsula. Cape York Peninsula Land Use Strategy, Office of Co-ordinator General of Queensland, Brisbane, Department of the Environment, Sport and Territories, Canberra, and Department of Primary Industries, Queensland, Brisbane.. Annan River – consultation complete. FHA declaration scheduled for late 2001. Kirke River – FHA consultation (NHT funded) is ongoing. Starke River – first round of FHA consultation (NHT funded) complete, FHA declaration during 2002. Margaret Bay – preliminary FHA consultation commenced.. Danaher, K (1995b). Coastal Wetlands Resources Investigation of the Burdekin Delta for Declaration as Fisheries Reserves: Report to Ocean Rescue 2000. Department of Primary Industries, Queensland, Brisbane.. Burdekin FHA declared in August, 1999.. Duncan, S and Bruinsma, C (in progress). Queensland Coastal Wetland Resources: South East Queensland. Department of Primary Industries, Queensland, Brisbane.. N/A - confirmation of the fisheries conservation values of existing extensive FHAs only.. THE BURDEKIN REGION. OR2000 G006/93. 1991. REPULSE BAY. Queensland Fisheries Service. 1989. MORETON REGION. Queensland Fisheries Service. 1995. Queensland Coastal Wetland Resources: Cape Tribulation to Bowling Green Bay. 3.
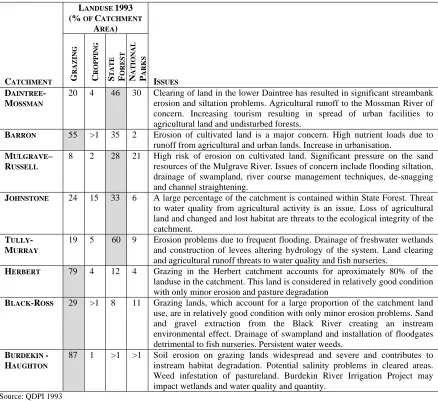
(14) SECTION 2 BACKGROUND 2.1 The Study Area The Study Area extends from Cape Tribulation (16o 6’S, 145o 24’E) to Bowling Green Bay (19o 30’S, 147o 24’E) in tropical north Queensland. Eleven coastal sub-basin catchments (as defined by the Department of Natural Resources) fall within this north Queensland Study Area. Figure 2.1 illustrates the catchments included in this investigation and the main estuarine systems within them. The hydrology and catchment characteristics of estuaries within the Study Area are listed in Table 2.1. In general, tropical north Queensland is characterised by a rich floral and faunal species diversity and high world heritage value. The Study Area is no exception. The Wet Tropics World Heritage Area covers much of the rainforest covered coastal ranges from Cape Tribulation to just south of Ingham. The Great Barrier Reef Marine Park World Heritage Area encompasses coastal waters from Cape York in the north to Baffle Creek in the south, including waters adjacent to the Study Area. Australia’s largest island national park, Hinchinbrook Island, falls within the Study Area and forms the outer barrier island of a unique passage landscape, Hinchinbrook Channel. Within the region, the predominant land-uses along the coast are agricultural production and cattle grazing. Coastal plains in the wetter catchments are largely utilised for sugarcane and banana production. In the drier catchments in the south of the Study Area, cattle grazing is the dominant land-use. Throughout the Study Area, large proportions of the coastal ranges are forested and managed as timber reserves or protected areas. Cairns, in the north, and Townsville, in the south, are the two main urban centres in the Study Area. The population of these centres as calculated in the 1996 census was approximately 92 300 and 109 900 respectively (ABS 1996). The average summer temperature in Cairns ranges from a minimum of 24oC to a maximum of 32oC. In winter, temperatures fall to an average minimum of 18oC and a maximum of 25oC. In Townsville, temperatures range from 20oC to 32oC in summer and 13oC to 27oC in winter. The regions from Cape Tribulation to Lucinda, and from Lucinda to Bowling Green Bay, lie respectively within the Wet Tropic Coast (WTC) region and the Lucinda–Mackay Coast (LMC) region, as defined in the Interim Marine and Coastal Regionalisation for Australia. The section of coastline falling within the WTC region is characterised by a high average annual rainfall (ranging from approximately 1800 mm, to 4000 mm in the Innisfail–Tully area) and a high occurrence of cyclones in the summer season (averaging ~15 cyclones/decade) (IMCRA Technical Group 1998). The region of coastline from Lucinda to Bowling Green Bay lies within a rain shadow and experiences a much lower average annual rainfall than the WTC region (from approximately 900 mm to 1800 mm). The LMC region also experiences approximately 15 cyclones/decade (IMCRA Technical Group 1998). The Study Area lies adjacent to the terrestrial Wet Tropics and Brigalow Belt North Bioregions as defined in the Interim Biogeographic Regionalisation of Australia (Thackway and Cresswell 1995).. 4. Queensland Coastal Wetland Resources: Cape Tribulation to Bowling Green Bay.
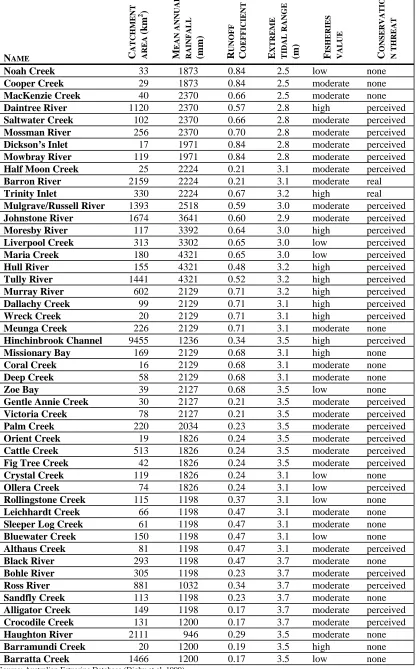
(15) N. The North Queensland Study Area. Alexandra Bay. Cape Tribulation to Bowling Green Bay. Cape Tribulation. Daintree River. DAINTREE. 25. 0 km. Saltwater Creek (1). 25. 50. Catchment boundary. Mossman Creek Dickson's Inlet Mowbray Creek. MOSSMAN. Trinity Inlet Yorkey's Point Mission Bay. Barron River. FITZROY ISLAND. CAIRNS #. Queensland. Saltwater Creek (2) Mulgrave/Russell River BARRON. MULGRAVE -RUSSELL. Johnstone River Moresby River. JOHNSTONE. Liverpool Creek Maria Creek. Hull River. HERBERT. TULLY Tully River. DUNK ISLAND. Murray River MURRAY. Dallachy Creek Wreck Creek Meunga Creek. Hinchinbrook Island Hinchinbrook Channel Herbert River PALM ISLANDS. Bulgaroo Creek Orient Creek Cattle/Elanor Creek. MAGNETIC ISLAND. Crystal Creek Saltwater Creek (3). BLACK. Rollingstone Creek Bohle River. # TOWNSVILLE. Leichhardt Creek Christmas Creek. Bowling Green Bay. ROSS. Bluewater Creek Althaus Creek Ross River Black River. Haughton River. Alligator Creek Crocodile Creek Cocoa Creek. Barramundi Creek Barratta Creek HAUGHTON. FIGURE 2.1 The Study Area: stretching from Cape Tribulation to Bowling Green Bay in tropical north Queensland.. Queensland Coastal Wetland Resources: Cape Tribulation to Bowling Green Bay. 5.
(16) low moderate moderate high moderate moderate moderate moderate moderate moderate high moderate moderate high low low high high high high high moderate high high moderate moderate low moderate moderate moderate moderate moderate moderate low low low moderate moderate low moderate moderate moderate moderate moderate moderate moderate moderate high low. CONSERVATIO N THREAT. VALUE. 2.5 2.5 2.5 2.8 2.8 2.8 2.8 2.8 3.1 3.1 3.2 3.0 2.9 3.0 3.0 3.0 3.2 3.2 3.2 3.1 3.1 3.1 3.5 3.1 3.1 3.1 3.5 3.5 3.5 3.5 3.5 3.5 3.5 3.1 3.1 3.1 3.1 3.1 3.1 3.1 3.7 3.7 3.7 3.7 3.7 3.7 3.5 3.5 3.5. FISHERIES. 0.84 0.84 0.66 0.57 0.66 0.70 0.84 0.84 0.21 0.21 0.67 0.59 0.60 0.64 0.65 0.65 0.48 0.52 0.71 0.71 0.71 0.71 0.34 0.68 0.68 0.68 0.68 0.21 0.21 0.23 0.24 0.24 0.24 0.24 0.24 0.37 0.47 0.47 0.47 0.47 0.47 0.23 0.34 0.23 0.17 0.17 0.29 0.19 0.17. (m). EXTREME TIDAL RANGE. RAINFALL. (mm). 1873 1873 2370 2370 2370 2370 1971 1971 2224 2224 2224 2518 3641 3392 3302 4321 4321 4321 2129 2129 2129 2129 1236 2129 2129 2129 2127 2127 2127 2034 1826 1826 1826 1826 1826 1198 1198 1198 1198 1198 1198 1198 1032 1198 1198 1200 946 1200 1200. RUNOFF COEFFICIENT. 33 29 40 1120 102 256 17 119 25 2159 330 1393 1674 117 313 180 155 1441 602 99 20 226 9455 169 16 58 39 30 78 220 19 513 42 119 74 115 66 61 150 81 293 305 881 113 149 131 2111 20 1466. MEAN ANNUAL. NAME Noah Creek Cooper Creek MacKenzie Creek Daintree River Saltwater Creek Mossman River Dickson’s Inlet Mowbray River Half Moon Creek Barron River Trinity Inlet Mulgrave/Russell River Johnstone River Moresby River Liverpool Creek Maria Creek Hull River Tully River Murray River Dallachy Creek Wreck Creek Meunga Creek Hinchinbrook Channel Missionary Bay Coral Creek Deep Creek Zoe Bay Gentle Annie Creek Victoria Creek Palm Creek Orient Creek Cattle Creek Fig Tree Creek Crystal Creek Ollera Creek Rollingstone Creek Leichhardt Creek Sleeper Log Creek Bluewater Creek Althaus Creek Black River Bohle River Ross River Sandfly Creek Alligator Creek Crocodile Creek Haughton River Barramundi Creek Barratta Creek. CATCHMENT 2 AREA (km ). TABLE 2.1 Hydrology and catchment characteristics of estuaries within the Study Area.. none none none perceived perceived perceived perceived perceived perceived real real perceived perceived perceived perceived perceived perceived perceived perceived perceived perceived none perceived none none none none perceived perceived perceived perceived perceived perceived none perceived none none none none perceived none perceived perceived none perceived perceived none none none. Source: Australian Estuarine Database (Digby et al. 1999). 6. Queensland Coastal Wetland Resources: Cape Tribulation to Bowling Green Bay.
(17) 2.2 Coastal Wetland Environments Mangrove, saltmarsh and seagrass communities are recognised for their value to fisheries production. These marine plants establish habitats that directly support local inshore and offshore fisheries through the provision of food, shelter, breeding and nursery areas. Previous DPI research (Quinn 1992) has established that the estuarine habitats provided by mangroves and seagrasses are critical to many commercially and recreationally important fish and crustacean species during some stage of their life cycle. Species that are estuarine dependent include mud and blue swimmer crabs, prawns, barramundi, threadfins, whiting, flathead, bream and mullet. Mangrove and seagrass communities form only part of a range of coastal habitats (along with unvegetated to samphire-dominated Saltpans, Saline Grasslands, intertidal flats, rocky foreshores and coral reefs) that all provide a diversity of environments maintaining marine and estuarine ecosystems.. Fish Habitats Mapped in this Study For the purposes of this study, environments located between the highest astronomical tide level and the low water mark (i.e. the intertidal communities) are described collectively as coastal wetlands. The coastal wetlands mapped in this study are mangrove and saltmarsh communities. The absence of a universally accepted definition of a mangrove community leads to many different interpretations of areal extents of “mangroves”. Here, the term mangrove community refers to any community within the intertidal zone that is dominated by mangrove trees and shrubs. Saltmarshes are intertidal plant communities that are dominated by salt tolerant herbs and low shrubs, such as samphires and salt couches (Hopkins et al. 1998). Three subsets of this vegetation type are recognised in this study. Saltpans are those hypersaline areas that virtually unvegetated or have a sparse ground cover of samphire vegetation or algae. Samphire-dominated Saltpans are Saltpans that have a dense ground cover of samphire vegetation. Saline Grasslands are those areas that are dominated by Sporobolus virginicus (salt couch). Coastal wetland communities in this study refer to tidal wetlands only. Freshwater wetlands, such as Melaleuca swamp or sedgelands, have not been included. Mangroves Mangroves are a diverse group of predominantly tropical shrubs and trees growing in the marine tidal zone (Duke 1992). These marine plants serve a wide variety of functions (Claridge and Burnett 1993; Ewel et al. 1998) including: ♦ ♦ ♦ ♦. physical protection of the coastal fringe from erosion and flooding; sediment trapping; primary production, nutrient uptake and transformation; provision of food, shelter, breeding and nursery areas for a wide variety of marine and terrestrial animal species.. At a regional scale, the distribution of mangrove species is determined by a number of factors including temperature, rainfall, catchment area and tidal regime. It has been shown that mangrove species are limited in their latitudinal distribution by their physiological tolerance to low temperatures (Duke et al. 1998). The majority of mangrove species are limited to tropical environments where the mean winter temperatures are higher than 20oC. Consequently, mangrove species diversity generally decreases with increasing latitude. Queensland Coastal Wetland Resources: Cape Tribulation to Bowling Green Bay. 7.
(18) Additionally, areas of high freshwater availability (both as rainfall and runoff from riverine catchments) tend to support more species rich estuarine mangrove communities than areas of low freshwater availability. In Queensland this is clearly demonstrated in the north of the state. The relatively dry coastline of the Gulf of Carpentaria supports less than twenty species of mangrove (Bruinsma and Duncan 2000). In comparison, more than thirty species have been recorded for areas of similar latitude (i.e. the Study Area) on the wetter eastern coastline of Australia. Mangrove species are also variable in their tolerance to the variety of environmental parameters experienced in the intertidal zone, including salinity, soil type, frequency of inundation (both tidal and fresh) and wave action. Accordingly, mangrove species distribution within an estuary can generally be related to the variation of these factors and typical mangrove zones often result. For example, Closed Rhizophora zones (or communities) within Queensland generally occur on the waters edge where they receive inundation with every high tide. In contrast, Open or Closed Ceriops communities, which occur towards the landward mangrove edge, are generally only inundated on the spring tides that occur only once or twice per month. The primary production of mangroves varies between different communities. Factors affecting net primary productivity and forest growth include soil nutrient status and redox potential, salinity, temperature, light intensity, associated fauna and tidal flushing (Clough 1992; Amarasinghe and Balasubramaniam 1992). Economically important detrital marine food webs are supported by primary production from mangrove trees. There is a lack of quantitative information regarding the direct benefits to primary productivity gained from the various mangrove community types discussed here. Duke (1997) reports that 31 species of mangroves are found within the Study Area. These are: ♦ ♦ ♦ ♦ ♦ ♦ ♦ ♦ ♦ ♦ ♦ ♦ ♦ ♦ ♦ ♦ ♦ ♦ ♦ ♦ ♦ 8. Acanthus ilicifolius L. Acrostichum speciosum Willd. Aegialitis annulata R.Br. Aegiceras corniculatum (L.) Blanco Avicennia marina (Forsk) Vierh. Bruguiera exaristata Ding Hou Bruguiera gymnorrhiza L. Lam. Bruguiera parviflora (Roxb.) Griffith Bruguiera sexangula (Lour.) Poir. Ceriops australis (C.T.White) Ballment, T.J.Sm. & J.A.Stoddart Ceriops decandra Ding Hou Ceriops tagal C.T.White Cynometra iripa Kostel. Excoecaria agallocha L. Heritiera littoralis Aiton Lumnitzera littorea (Jack) Voigt Lumnitzera racemosa Willd. Lumnitzera X rosea (Gaudich.) C.Presl Nypa fruticans Wurmb Osbornia octodonta F. Muell. Pemphis acidula J.R.Forst. & G.Forst.. holly mangrove mangrove fern club mangrove river mangrove grey mangrove rib−fruited orange mangrove large−leafed orange mangrove small−leafed orange mangrove orange mangrove yellow mangrove yellow mangrove yellow (or spurred) mangrove wrinkle pod mangrove milky mangrove looking−glass mangrove black mangrove (red flowered) black mangrove (white flowered) black mangrove (hybrid) mangrove palm myrtle mangrove pemphis. Queensland Coastal Wetland Resources: Cape Tribulation to Bowling Green Bay.
(19) ♦ ♦ ♦ ♦ ♦ ♦ ♦ ♦ ♦ ♦. Rhizophora apiculata Blume Rhizophora X lamarckii Montr. Rhizophora mucronata Lam. Rhizophora stylosa Griff. Scyphiphora hydrophylacea C.F.Gaertn. Sonneratia alba Sm. Sonneratia X gulngai N.C.Duke Sonneratia caseolaris (L.) Engl. Xylocarpus granatum Koen Xylocarpus moluccensis Pierre. tall−stilted red mangrove stilted mangrove red mangrove red mangrove yamstick mangrove mangrove apple white flower mangrove apple mangrove apple cannonball mangrove cedar mangrove. Lovelock (1993) also lists the following four species as occurring in the Study Area: ♦ ♦ ♦ ♦. Barringtonia asiatica (L.) Kurz Barringtonia racemosa (L.) Spreng. Crinum pedunculatum R.Br. Hibiscus tiliaceus L.. freshwater mangrove freshwater mangrove mangrove lily native hibiscus. For the purposes of this study, H. tileaceus is considered to be a “marginal mangrove species” as in some instances it is found growing in the marine tidal zone, whereas in other locations it may be found growing in terrestrial areas. Saltmarshes Saltmarshes are intertidal plant communities that are dominated by salt tolerant herbs and low shrubs, such as samphires and salt couches (Hopkins et al. 1998). In contrast to mangrove species, saltmarsh species diversity and community complexity in Queensland increases with increasing latitude (Zeller 1998). Although saltmarsh environments are generally only inundated with the high tides they can play an important role as fish habitat. In these environments, interactions of the soil, water and air provide optimal environmental conditions, which under specific circumstances allow fisheries resources to feed, grow and reproduce to complete their lifestyle (Beumer et al. 1997). Specifically, shallow tidal pools within the saltmarshes provide transitory feeding habitat for larval and juvenile fishes, and may support a variety of invertebrates (Zeller 1998). Even unvegetated claypans can be important for the life cycles of certain fishes (eg. barramundi). In the Gulf of Carpentaria, extensive claypans are flooded during the monsoon season. Major spawning of barramundi occurs just before or early in the wet season so that the juveniles can take maximum advantage of this temporary wetland habitat. The inundated claypans also allow extensive, seasonal migrations of juvenile and spawning fish moving along and among stream channels, tidal pools and coastal waters. Connolly (1999) recently studied the use by fish species of subtropical saltmarsh habitat. In this study, it was confirmed that both vegetated and non-vegetated saltmarsh habitats are utilised by surprisingly abundant and diverse communities of both estuarine-resident and estuarine-marine fish species. More than half of the fish species caught on the saltmarsh habitat was of direct economic importance, and several of these species were common without dominating the catch numerically. The distribution of fish on saltmarshes was found to be most strongly influenced by proximity to intertidal, mangrove-lined feeder creeks, with more species and more individuals near to creeks than further away. Queensland Coastal Wetland Resources: Cape Tribulation to Bowling Green Bay. 9.
(20) Other Fish Habitats not Mapped in this Study Seagrasses Seagrasses are productive flowering plants, which are able to complete their life cycle completely submerged beneath marine waters (Mateer 1998). Seagrass communities play an important role in coastal marine and estuarine systems. Previous studies have shown that seagrass beds support large populations of juvenile commercial prawns (e.g. tiger and endeavour prawns) and fish and crab species (Coles et al. 1992). They provide food, habitat and shelter for marine species, act as substrate stabilizers and contribute a large proportion of the primary production of coastal systems. Large seagrass beds mainly occur in sheltered bays and estuaries within the Study Area. Broad scale studies have been conducted of seagrass distribution from Cape York to Cairns in November 1984 (Coles et al. 1985) and Cairns to Bowen in 1987 (Coles et al. 1992). More detailed studies have recently been undertaken in order to complement broad scale studies and contribute further understanding of both the distribution and the variability of seagrass communities. Studies on the distribution of seagrasses in Cairns Harbour and Trinity Inlet in December 1993 (Lee Long et al. 1996), the Hinchinbrook region (from Dunk Island to Cleveland Bay) in October 1996 (Lee Long et al. 1998) and Oyster Point Cardwell between 1995 and 1998 (Lee Long et al. 1999) have been undertaken. Natural seasonal and annual variability in the species composition, density and biomass of seagrass communities results from the different responses of seagrasses to environmental parameters such as temperature, water turbidity, sediment stability and nutrient levels (English et al. 1994). For this reason, distribution patterns from previous studies can only be considered as ‘snapshots’ of seagrass distribution in a window of time. However, as these regions have supported seagrass communities in the past, it is possible that they will do so in the future, provided the environmental conditions for colonisation and maintenance of the meadows remain favourable. The following thirteen species of seagrasses have been recorded in the Study Area (Coles et al. 1992; Lee Long et al. 1998): ♦ ♦ ♦ ♦ ♦ ♦ ♦ ♦ ♦ ♦ ♦ ♦ ♦. 10. Cymodocea rotundata Ehrenb. et Hempr. ex Aschers. Cymodocea serrulata (R. Br.) Aschers. and Magnus Halodule uninervis (wide and narrow leaf) (Forsk.) Aschers. Halodule pinifolia (Miki) den Hartog Halophila decipiens Ostenfeld Halophila ovalis (R. Br.) Hook F. Halophila ovata Gaud. Halophila spinulosa (R. Br.) Aschers. Halophila tricostata (Greenway) Halophila sp. undescribed Syringodium isoetifolium (Aschers.) Dandy Thalassia hemprichii (Enrenb.) Aschers. Zostera capricorni Aschers.. Queensland Coastal Wetland Resources: Cape Tribulation to Bowling Green Bay.
(21) Intertidal Flats, Rocky Foreshores and Coral Reefs Despite their often unrecognised role in primary production, ‘non-vegetated’ habitats such as intertidal flats, rocky foreshores and coral reefs are important fish habitats. Intertidal flats are defined as the zone exposed at low tide and submerged at high tide (Bird 1968), and may be non-vegetated sand or mud or colonised by seagrass or algal beds. Erftemeijer and Lewis (1999) recognised that intertidal mudflats are an important habitat that support a high biodiversity and biomass of benthic invertebrates, sustain productive fisheries and provide important feeding grounds for migratory and other shorebirds. Rocky foreshores provide a hard substrate for the attachment of algal flora as well as the long-term attachment of sessile invertebrates (such as barnacles, oysters and tube worms) (Zeller 1998). Both macro and micro algae, particularly benthic microalgae, play an essential role in primary production and may contribute in total more than half of the total net production (Alongi 1998). The Great Barrier Reef Marine Park Authority has mapped the distribution of intertidal flats and coral reefs within the Great Barrier Reef Marine Park. The coral reefs of this region are recognised globally as ecologically significant and are world heritage listed. They provide shelter and food for a high diversity of reef and pelagic animals that colonise or are attracted to these biological structures (e.g. sponges, coral and fish). Freshwater Coastal Wetlands AUSLIG (1994) defines freshwater coastal wetlands (swamps) as land that is so saturated with water that it is not suitable for agricultural or pastoral use and presents a barrier to free passage. It is often covered with characteristic grass and reed growths, and the degree of wetness may vary with season. These habitats include Melaleuca wetlands, sedgelands and communities in which a mixture of marine plants and freshwater plants grow. Although the direct benefit of freshwater swamps to fisheries productivity has not been quantified, these habitats are important for fish movement and for various stages in the life cycles of many fish species (e.g. barramundi, mullet, bass). In locations where freshwater swamps merge directly with tidal coastal wetland systems, the swamps contribute nutrients to the tidal zone, especially in times of substantial freshwater flow. These communities add to the diversity of environments that support coastal fisheries productivity.. Connectivity Connectivity of fish habitats and water flow between them is an important consideration for fisheries managers. As many fish, crab and shellfish species need to move between different habitats in various life cycle stages, it is important to protect each of the different habitats that are required to allow for this movement. The FHA concept focuses on the inclusion, linkage and management of all available habitat types within an area as a single unit, rather than simply protecting individual specific habitat types (McKinnon and Sheppard 2001).. Queensland Coastal Wetland Resources: Cape Tribulation to Bowling Green Bay. 11.
(22) SECTION 3 METHODS 3.1 Data The distribution of coastal wetland communities in the Study Area was investigated using remote sensing data from the Landsat 5 Thematic Mapper (TM) sensor. Five ‘scenes’ were required to map the Study Area. The scenes required to map each catchment area are listed in Table 3.1. The imagery used in this study was obtained with final radiometric correction and geometric rectification using ground control points already complete. The scenes were rectified to the Map Grid of Australia (Zone 55) using the Australian National Spheroid and the Geodetic Datum of Australia 1994. Images acquired on the same date were not used for this study due to limited availability of data and cloud cover on available images of the same date.. TABLE 3.1 Landsat TM satellite imagery utilised in this study. LANDSAT SCENE Atherton Cairns Ingham Charters Towers Townsville. DATE 7 September 1997 28 June 1997 28 June 1997 14 August 1999 24 June 1998. CATCHMENTS MAPPED Daintree and Mossman Barron and Mulgrave–Russell Johnstone, Tully, Murray and Herbert Black Ross and Haughton. The spatial resolution of Landsat TM data is 25 m x 25 m. The spectral characteristics of the data as well as details of the Landsat satellites are outlined in Appendix 4. Aerial photography was used as reference data to aid in the classification of the coastal wetland vegetation. The photography used in this study was 1: 50 000 Townsville to Cooktown (1993/1994) and St Lawrence to Townsville (1990, 1993) photography flown by the Beach Protection Authority. More recent aerial photography was not available for use in this study. In some areas, the available aerial photography did not provide a complete coverage of the coastal wetlands in the study area. The distribution of reference data in the Study Area, including aerial photography and field data, is illustrated in Figure 3.1. Local scale, historical mapping of particular estuaries within the Study Area was used to complement the information obtained through air photo interpretation and field surveys. The datasets used are listed in Table 3.2.. TABLE 3.2 Historical mapping used to aid the current mapping exercise. REFERENCE Le Cussan, J (1991). A report on the intertidal vegetation of the Daintree, Endeavour, and Russell/Mulgrave Rivers. An internal report for the Queensland National Parks and Wildlife Service, 139 pp. Olsen, HF (1983). Biological resources of Trinity Inlet and Bay, Queensland. Department of Primary Industries, Queensland Bulletin QB83004. Department of Primary Industries, Queensland, Brisbane, 64 pp.. 12. SCALE OF MAPPING 1: 15 000. 1: 25 000. ESTUARIES Daintree Russell/ Mulgrave Trinity Inlet. Queensland Coastal Wetland Resources: Cape Tribulation to Bowling Green Bay.
(23) FIGURE 3.1 Distribution of reference data utilised in this study.. 3.2 Mapping Methods The satellite imagery was processed using ERDAS Imagine® 8.4 on a PC with a Microsoft® Windows NT operating system. Six bands of information (excluding band 6 — the thermal band) were contrast stretched using a linear stretch and breakpoints to highlight the intertidal regions. All water bodies were spectrally masked out using a TM band 4 (near infrared) image. In order to limit the area of the classification to the coastal wetland environments, the terrestrial land features were masked out manually. The upper limit of the intertidal zone was identified using a false colour composite of TM bands 1, 4 and 5 (through blue, green and red colour guns, respectively) in conjunction with colour aerial photography, topographic maps and fieldwork. The use of brightness and wetness bands of a tasselled cap analysis also assisted in defining the tidal boundary. Queensland Coastal Wetland Resources: Cape Tribulation to Bowling Green Bay. 13.
(24) The remaining imagery of the intertidal zone was processed using an unsupervised classification procedure. ERDAS Imagine® uses the Iterative Self-Organising Data Analysis Technique (ISODATA) classification algorithm in order to create clusters of pixels that are spectrally similar. The ISODATA utility repeats the clustering of the image until either a maximum number of iterations has been performed, or a maximum percentage of unchanged pixels (convergence threshold) has been reached between two iterations (ERDAS 1997). A limit of thirty iterations or a convergence threshold of 99% was set in this classification. The resulting classes were labelled according to their dominant cover type with the aid of the aerial photography. Clumps of pixels less than 0.5 ha were eliminated and the image was smoothed using a three by three pixel, moving kernel. The classification was converted from raster to vector format using ARC/INFO® GIS software. To improve cartographic presentation of the data, the jagged vector boundaries were splined and generalised and polygons with areas under 0.5 ha were excluded. Appendix 5 contains the metadata for the resultant coverage. The coastal wetlands coverage was overlaid on a Band 3 (visible red) Landsat TM image for presentation. Maps were produced using ArcView® GIS Version 3.2 software at a scale of 1: 100 000. Further details of these maps are included in Appendix 6.. 3.3 Field Methods The computer-based coastal wetland community classification was validated with fieldwork conducted during April and June 2001. The distribution of 190 sites, which were accessed by boat or four wheel drive vehicle, is illustrated in Figure 3.1. At each site, information on mangrove community floristics and structure was documented. The data recorded included the specific composition of mangroves, dominant genus, estimated density (Projective Foliage Cover − PFC) of each vegetation layer, composition and hardness of substrate, and presence/absence of seedlings, samphires, grasses, algae, leaf litter, roots, ferns, epiphytes, sedges and ponds. A Garmin 4S XL Personal Navigator Global Positioning System (GPS) was used to determine the latitude and longitude of each field site. The estimated errors recorded by the GPS were on average between 15 m and 20 m (less than 1 pixel) with a maximum error of 49 m and a minimum error of 9 m. The time available, budget requirements and accessibility to the mangroves limited the amount of fieldwork. The information collected from the fieldwork was used to aid in the classification of the satellite image and the interpretation of the aerial photography. As the field sites were used to derive the final coastal wetland classification, they were not used to assess its accuracy. Rather a set of random points was generated in order to assess the accuracy of the classification (Section 3.5).. 3.4 Classification Details Mangroves were classified to the community level based on dominant genus present and canopy density of the whole community. The density of the community was determined by estimating the PFC. A canopy cover of greater than 50% was classified as closed, while less than 50% was identified as open. 14. Queensland Coastal Wetland Resources: Cape Tribulation to Bowling Green Bay.
(25) The standard Specht (1987) vegetation categories of ‘forest’ and ‘shrub’, which are based on height, were not included in this classification. This is due to the fact that vegetation height cannot be determined from the Landsat TM data. Only areas subject to tidal inundation were included in this mapping exercise. Excluded classes included permanent pools of water and elevated land containing terrestrial vegetation. Tidally exposed non-vegetated intertidal flats along with seagrass or algal beds were also excluded.. 3.5 Accuracy Assessment A set of 269 random points was generated using ERDAS Imagine® for accuracy assessment. The community present at each of these points was determined from the aerial photography and this was compared to the class assigned on the computer-classified maps. An error matrix using this data was generated and the overall accuracy along with user’s accuracy and producer’s accuracy was calculated. The overall classification accuracy is a measure of the number of correct pixels in the error matrix. User’s accuracy is the probability that a pixel classified on the map actually represents that category on the ground. Producer’s accuracy calculates the probability of a reference pixel being correctly classified (how well a certain area can be classified) (Jensen 1996). An overall evaluation of the project is included in Appendix 7.. 3.6 Overview Map of Fish Habitats An overview map of fish habitats was created from various sources using ARCVIEW ® Version 3.2 GIS software. Along with the mangrove and saltmarsh communities mapped as part of this study, spatial datasets of seagrass meadows, intertidal foreshore flats, reefs and coral cays were obtained. A list of the datasets obtained, their source and currency is included in Table 3.3. The AUSLIG GEODATA product, from which the land subject to inundation and freshwater swamps themes were taken, is primarily sourced from the 1: 250 000 scale National Topographic Map Series, which was completed in 1988. In this series, swamps are defined as land that is so saturated with water that it is not suitable for agricultural or pastoral use and presents a barrier to free passage. It is often covered with characteristic grass and reed growths, and the degree of wetness may vary with season. Land subject to inundation is described as lowlying land usually adjacent to watercourse or waterbody features, which is regularly covered with flood water for short periods either annually or during at least one year in ten (AUSLIG 1994).. Queensland Coastal Wetland Resources: Cape Tribulation to Bowling Green Bay. 15.
(26) TABLE 3.3 Details of digital datasets used in the overview map of fish habitats. TITLE Coral reefs. CUSTODIAN GBRMPA. CURRENCY 13-01-1994. Intertidal foreshore flats Seagrass meadows. GBRMPA Department of Primary Industries, Queensland (QDPI) Australian Land, Survey and Information Group (AUSLIG) Queensland Department of Natural Resources and Mines (QDNRM). unknown 00-11-1984. Freshwater swamps and areas subject to inundation Dams and Weirs. ~1988. 31-12-1994. DESCRIPTION Major coral reef structures in the GBR region Intertidal foreshore areas Seagrass meadows between Cape York and Hervey Bay Themes from the digital GEODATA TOPO-250K topographic map series. Location of major dams and weirs in Queensland.. 3.7 Assessment of Coastal Wetland Characteristics The suitability of various coastal wetland systems for nomination as candidate areas for FHA declaration is currently assessed on the basis of the following criteria: ♦ ♦ ♦ ♦ ♦ ♦ ♦. Size Diversity of or specific habitat features Diversity of or specific marine fauna and flora Level of existing and future disturbances Unique features Existing or potential fishing grounds Protected species. The details of the methods of assessment of these criteria are included in Table 9.2. The results of the assessment are summarised in Table 9.1.. 16. Queensland Coastal Wetland Resources: Cape Tribulation to Bowling Green Bay.
(27) SECTION 4 RESULTS 4.1 Description of the Mapping Units The coastal wetland communities are classified on the basis on the dominant genus present. The actual species mix associated with each class varies from estuary to estuary and even within estuaries. The mapping units used in this study are described in general below. For further specific details of the species found in particular locations, refer to the field data listed in Appendix 8. CLOSED RHIZOPHORA FIGURE 4.1 Occurs along the seaward edge, low in intertidal zone with roots regularly Habitat submerged during high tides. Usually dominated by tall, mature Rhizophora spp. which form a dense canopy Canopy (approximately 10−15 m) with a Projective Foliage Cover (PFC) greater than 50%. Other species that may occur in this community are A. marina (emergent), Bruguiera spp. and Ceriops spp. Poorly developed or completely absent. Shrub layer Ground cover Rhizophora spp. stilt roots with a sparse cover of Rhizophora spp. seedlings.. CLOSED AVICENNIA FIGURE 4.2 Can be found in a diverse range of intertidal environments from the seaward edge Habitat (as a pioneer), to accreting banks (as a fringe), to the landward edge. A. marina, with occasional Ceriops spp. and Rhizophora spp., forming a dense Canopy canopy with a PFC of greater than 50%. Heights vary depending on position within the intertidal zone (taller on seaward edge, shorter on landward edge). Seaward edge communities tend to have no shrub layer. Communities further Shrub layer landward may have other species such as A. corniculatum or C. tagal forming an understorey. Ground cover A. marina pneumatophores and seedlings and samphires often form a sparse ground cover.. OPEN AVICENNIA Found on the seaward edge as a pioneer and on the landward edge that is only Habitat inundated by the highest spring tide. A. marina plants form a canopy that has a PFC of less than 50%. Height varies, Canopy generally <1 m in areas bordering on Saltpans and up to 10 m in pioneering zones. Generally absent. Shrub layer Ground cover Occasional presence of samphires (on the landward edge) and a sparse coverage of A. marina pneumatophores.. CLOSED CERIOPS FIGURE 4.3 Generally occurs on erosion banks and towards the upper intertidal limit, on more Habitat elevated land. Only inundated by the spring tides. Dominated by Ceriops spp., often with A. marina, Bruguiera spp., L. racemosa, Canopy Xylocarpus spp. Height of the canopy across sites varies (from approximately 2– 10 m) however at an individual site is generally remarkably uniform. PFC greater than 50%. More species diverse on creek banks, more monospecific on Saltpan edges. Generally absent. Shrub layer Ground cover Consists of sparse cover of seedlings and roots of the species present.. Queensland Coastal Wetland Resources: Cape Tribulation to Bowling Green Bay. 17.
(28) FIGURE 4.1 Closed Rhizophora in the Moresby River.. FIGURE 4.2 Closed Avicennia at Half Moon Creek.. FIGURE 4.3 Closed Ceriops at Seymour River. 18. Queensland Coastal Wetland Resources: Cape Tribulation to Bowling Green Bay.
(29) OPEN CERIOPS Habitat. Canopy. Shrub layer Ground cover. Occurs on the landward edge of the intertidal zone and is inundated by only the high spring tides. This community often surrounds Saltpans and is rarely on the water’s edge, except on eroding banks. A community dominated by Ceriops spp. with occasional A. marina emergents. The PFC is less than 50%; height varies from <1 m in the extremely saline areas to approximately 3 m. Occasional presence of other species such as A. corniculatum. Consists of seedlings of the species present along with a sparse to open coverage of samphires and grasses.. CLOSED RHIZOPHORA/AVICENNIA FIGURE 4.4 Occurs on the seaward edge, generally within a Closed Rhizophora zone, or on a Habitat riverbank towards the mouth of the estuary. A mixed community of A. marina and Rhizophora spp. together forming a closed Canopy canopy with a PFC of greater than 50%. Heights of between 6–15 m are common. The understorey may consist of A. marina and Rhizophora spp. Shrub layer Roots and seedlings of the canopy species. Ground cover. CLOSED AVICENNIA/CERIOPS Usually surrounded by Saltpans or on the landward edge, in areas only inundated Habitat during spring tides. A mixed community of A. marina and Ceriops spp. forming a canopy with a PFC Canopy of greater than 50%. Generally a low community with a canopy of <4 m. Other species such as A. annulata, A. corniculatum and L. racemosa may be Shrub layer present. Occasional presence of samphires and seedlings of the species present. Ground cover. OPEN AVICENNIA/CERIOPS Uncommon in the Study Area, generally bordering Saltpans in areas only Habitat inundated during spring tides. A mixed community of A. marina and Ceriops spp. forming a canopy with a PFC Canopy of less than 50%. A low community with a canopy of <3 m. Other species such as A. annulata, A. corniculatum and L. racemosa may be Shrub layer present. Occasional presence of samphires and seedlings of the species present. Ground cover. CLOSED MIXED Habitat. Canopy. Shrub layer. Ground cover. FIGURE 4.5 Generally found on the landward edges of mangrove communities and in the upper tidal reaches of creeks and rivers where there is a high freshwater influence. A closed mix (PFC > 50%) in which a variety of the species present in this region may occur without being dominated by one genus in particular. Often reaching heights of 10–20 m. Shrub layer often consists of A. ilicifolius, A. speciosum and C. pedunculatum. Juveniles of the various canopy species may also be present. Epiphytes (including orchids and ferns) on the mangrove plants are common. Seedlings and roots of the various species along with sparse samphires and grasses.. Queensland Coastal Wetland Resources: Cape Tribulation to Bowling Green Bay. 19.
(30) FIGURE 4.4 Closed Rhizophora/Avicennia on the bank of Alligator Creek.. FIGURE 4.5 Closed Mixed on the bank of Enterprise Channel at high tide.. FIGURE 4.6 Closed Bruguiera at Mosquito Creek. 20. Queensland Coastal Wetland Resources: Cape Tribulation to Bowling Green Bay.
(31) CLOSED BRUGUIERA FIGURE 4.6 Commonly occurs in the mid intertidal zone behind Closed Rhizophora Habitat communities or along river banks in upstream locations. Canopy dominated by Bruguiera spp. (mainly gymnorrhiza and parviflora) with Canopy other species such as H. littoralis, Rhizophora spp. and Xylocarpus spp. Generally absent. Shrub layer Knees roots of Bruguiera spp. form a dense ground cover. Ground cover. SALINE GRASSLAND FIGURE 4.7 Occurs along the landward edge of the intertidal zone in a hypersaline Habitat environment that is only inundated by the highest spring tides. Sometimes extends past the upper intertidal limit into open Casuarina communities. Generally absent. Canopy Absent. Shrub layer Ranging from sparse to dense coverage of salt couch (Sporobolus virginicus) Ground cover within which a sparse coverage of samphires and sedges may also occur.. SALTPAN. Habitat Canopy Shrub layer Ground cover. FIGURE 4.8 Occurs along the landward edge of the intertidal zone in a hypersaline environment that is only inundated by the highest spring tides. Sparse stunted (<1 m) individuals of various mangrove species may occur (e.g. A. marina, C. tagal and L. racemosa). Some samphire species may be present as very small shrubs. Commonly an open coverage of samphires. However may be virtually unvegetated or have an algal covering.. SAMPHIRE-DOMINATED SALTPAN FIGURE 4.9 Occurs along the landward edge of the intertidal zone in a hypersaline Habitat environment that is only inundated by the highest spring tides. Generally absent. Canopy Absent. Shrub layer Dense coverage of samphires within which a sparse coverage of salt couch Ground cover (Sporobolus virginicus) and sedges may also occur.. Queensland Coastal Wetland Resources: Cape Tribulation to Bowling Green Bay. 21.
(32) FIGURE 4.7 Saline Grassland near the mouth of Ross River.. FIGURE 4.8 Saltpan at Blacksoil Creek.. FIGURE 4.9 Samphire-dominated Saltpan at Barramundi Creek. Flowering Limonium australe in the foreground. 22. Queensland Coastal Wetland Resources: Cape Tribulation to Bowling Green Bay.
Figure
Related documents
• College students are always hungry; good way to make people stop on the way to class • Preparation doesn’t have to cost a lot of $$ • Probably don’t have to do a lot
This document explains how to install and configure the Net Report for WMI (Microsoft Windows Management Instrumentation, Event Viewer Application, Security and System logs)..
When attempting to radiograph a butt weld made on 4 mm carbon steel plate, which of the following exposure conditions are most likely to be used?. Which of the following
The sets ∅ and M are both open and closed, the family of open sets is closed to finite intersections and arbitrary unions, and for closed sets this holds with the operations
The following abbreviations are used: HW=Head width (maximum width of head, in full-face view behind eyes (excluding eyes)); HL=Head length (maximum length of head, in full-face
Unconditional Positive Regard - Counsellor Rating Scale Example Level 5 continued:.. James:
The influence of radiation, mechanical, and plasma-induced damage on deuterium retention in Tungsten
To check for the presence of trapping sites with low binding energies which are not able to hold deuterium at 450 K and can correspond, for example, to filling of vacancies
Daily forage accumulation (DFA), plant height (PH), number of tillers (NT), forage nitrogen content (FNC) and forage mass (FM) of Marandu grass, in relation to inoculation
