Article
1
Performance Assessment Model for Municipal Solid
2
Waste Management systems: Development and
3
Implementation
4
Hatem Abdulaziz AlHumid 1, Husnain Haider *2, Saleem S. AlSaleem 2, Majed Alinizzi 2,
5
Md. Shafiquzamman 2, and Rehan Sadiq 3
6
1 Project Management Department, Municipality of Unayzah, Unayzah, Qassim, Saudi Arabia;
7
8
2 Civil Engineering Department, College of Engineering, Qassim University, Buraydah, Qassim, Saudi Arabia;
9
[email protected], [email protected], [email protected], [email protected]
10
3 School of Engineering, University of British Columbia (Okanagan), Kelowna, British Columbia, Canada;
11
12
* Correspondence: [email protected] ; Tel: +966 500 574640
13
14
15
Abstract: Most of the municipalities in the Gulf region are facing performance related issues in their
16
municipal solid waste management (MSWM) systems. They lack to possess a deliberate
inter-17
municipality benchmarking processes. Instead of identifying the performance gaps for their key
18
components (e.g., personnel productivity, operational reliability, etc.) and adopt proactive
19
measures, the municipalities primarily rely on an efficient emergency response. A novel hierarchical
20
modeling framework, based on deductive reasoning, is developed for performance assessment of
21
MSWM systems. Fuzzy rule based modeling using Simulink-MATLAB was used for performance
22
inferencing at different levels, i.e., component, sub-components, etc. The model is capable of
23
handling the inherent uncertainties due to limited data and imprecise knowledge base. The model’s
24
outcomes can exclusively assist the managers working at different levels of organizational hierarchy
25
for effective decision-making. Performance of the key component, assists the senior management to
26
assess the overall compliance level of performance objectives. Subsequently, operation management
27
can hone in the sub-components to acquire useful information for intra-municipality performance
28
management. While, individual indicators are useful for inter-municipality benchmarking. The
29
model has been implemented on two municipalities operating in Qassim Region, Saudi Arabia. The
30
results demonstrate the model’s pragmatism for continuous performance improvement of MSWM
31
systems in the country and elsewhere.
32
33
Keywords: Solid Waste Management; Performance Assessment; Fuzzy Rule-based Modeling;
34
Performance Indicators; Simulink MATLAB
35
36
1. Introduction
37
Municipal solid waste generation rate is increasing around the world due to population growth,
38
changing lifestyles of modern societies, and increase use of hard-to-decompose materials. As of 2016,
39
the global average municipal waste generation rate was 0.74 kg/capita-day which is expected to be
40
1.26 kg/capita-day by 2050 [1]. Besides the difficulties in providing a high level of service (LOS) to the
41
public at low cost rates, municipalities are facing challenges to meet the sustainable development
42
goals of 21st century, such as integrated waste management and zero waste management. Similar to
43
other public utilities (e.g., water, roads, electricity, etc.), municipal solid waste management (MSWM)
44
systems also need to improve the performance of their key components, including public service and
45
participation (PSP) [2,3], personnel adequacy and wellbeing (PAW)[2-4], environmental endurance
46
(ENE) [5], physical assets efficacy (PAE) [2,6], operational reliability (OPR) [6], sustainability
47
compliance (SSC) [6,7], and economic and financial viability (EFV)[8]. The performance of each of
48
these key components can be evaluated with the help of suitable performance indicators (PIs).
49
Improving the efficacy of MSWM systems has been recognized as one of the primary objectives
50
in recent sustainable development declarations (e.g., United Nations 2030 Agenda for Sustainable
51
Development, KSA’s vision for year 2030) [9,10]. While existing situation in developing world and
52
the gulf countries needs serious efforts to achieve these objectives. The first steps towards
53
sustainability of MSWM systems is to assess their existing performance with the help of a
well-54
structured (which can deal with the issues related to data inadequacies and absence of benchmarks)
55
and comprehensive (which can cover all the above key components) performance assessment model.
56
PIs are derived from system parameters (i.e., data variables) and inform about the status of
57
achievement of an activity, e.g., waste production per capita per day and percentage of customers
58
not satisfied with waste management service [11]. PIs are the primary inputs to a conventional
59
performance benchmarking process where the participating municipalities detect their
60
underperforming key components through cross-comparison with other municipalities operating in
61
the region that possess similar demographic, geographic, environmental, and financial settings [12].
62
Establishing benchmarks in the absence of an ongoing performance benchmarking process is a
63
challenge for the municipalities in KSA.
64
In conventional benchmarking process, either the individual PIs are compared or their
65
normalized scores are aggregated to assess and compare the performance of the key components
66
[13,14]. Information obtained from inter-municipality benchmarking, performed at local, regional,
67
national, and global levels, provide useful information to the top level management of the
68
municipality for holistic planning of available resources [15]. Operations managers practically
69
develop performance action plans and hold an interest in performance of underlying processes (or
70
sub-components) in each key component [16,17]. The municipalities should have a well-structured
71
intra-municipality performance assessment setup through which they can hone in the lagging
sub-72
components (e.g., staffing level and productivity ratio to assess personnel adequacy) and finally
73
identify the PIs (e.g., employees per ton of daily waste generated and number of collection staff to
74
calculate staffing level) for effective decision-making. Aggregating several PIs at the component level
75
may come out to be a sidestep approach by neglecting the underlying processes and the findings are
76
primarily useful at regional level decision-making.
77
Detailed literature review of performance assessment models for MSWM systems is
out-of-78
scope of this research. Some relevant studies are briefly outlined here. Recently, Coelho et al. [18]
79
carried out a detailed review of different applications of multicriteria decision-making (MCDM) in
80
waste management. According to this review, most of the studies addressed landfill location selection
81
problem [19,20], assessment of social and environmental impacts of different waste treatment
82
technologies [21], and selection of types of waste treatment facilities [22].
83
Preprints (www.preprints.org) | NOT PEER-REVIEWED | Posted: 30 January 2019
Preprints (www.preprints.org) | NOT PEER-REVIEWED | Posted: 30 January 2019 doi:10.20944/preprints201901.0303.v1
Although, the literature on performance assessment of MSWM systems is scarcer as compared to
84
other infrastructure facilities, PIs have been used in past studies to evaluate the performance of
85
MSWM systems [4,13-15]. Mendes et al. [13] applied PIs to evaluate the performance, using simple
86
weighted sum approach, of waste management system in regions with extensive seasonal tourism
87
activities in Portugal. Sequeiros [14] used thirty nine PIs for performance assessment of five key
88
component, including PSP, ENE, EFV, and PAE, of ten urban waste services in Portugal. In this study,
89
the calculated values of PIs were used for cross-comparison amongst the participating municipalities.
90
Armijo et al. [15] selected eighteen PIs to develop a driving force-pressure-state-impact-response
91
model for performance improvement of waste management programs. Simple addition was used to
92
assess the performance (response) for each PI.
93
In some of these studies, the performance of a specific component, based on data obtained from
94
large number of municipalities, was assessed using a set of few PIs for regional or global comparison
95
[26-30]. Guerrini et al. [26] evaluated performance of fourty municipalities in Verona, Italy using
non-96
parametric method based on extensive data requirements. Căilean and Teodosiu [27] evaluated the
97
evolution process of sustainable development of MSWM systems, between 2004 and 2013, in
98
Romania. Anestina et al. [28] assessed economic productivity performance of 30 companies which
99
adopted private sector participation approach for solid waste management in Nigeria. Huang et al.
100
[29] performed performance assessment of 307 MSWM systems in Taiwan using only five key
101
indicators. Lohri et al. [30] evaluated financial sustainability, using cost-revenue analysis, of MSWM
102
systems in Ethiopia. Recently, Abbondanza and Souza [31] estimated the e-waste generation from
103
residential sector in Brazil.
104
In contrast, an overwhelming number of PIs were developed to achieve sustainability objectives
105
for zero waste management systems in developed countries [32]. Zero waste management is
106
relatively a more recent concept in which waste is considered as a resource produces at an
107
intermediate phase of the resource consumption process [6]. The concept requires several PIs for
108
detailed evaluation of different processes, e.g., amount and frequency of each type of organic and
109
inorganic components of waste, etc. Such notion is not valid for the municipalities struggling in
110
gathering basic data for performance assessment and thus, can be difficult to adopt for assessing the
111
performance of MSWM.
112
In past studies, either fewer PIs were used to cover a specific aspect of MSWM systems or
113
extensive data sets of past performance were used for large number of participating municipalities.
114
Moreover, uncertainties due to observational errors and limited data were not taken into account.
115
Defining benchmarks to initiate the performance assessment of MSWM systems in KSA, and other
116
countries with similar situation, is the first challenge. For the quantitative PIs which are supposed to
117
be equal or less than a certain standard value, benchmarks can be established as the desired
118
standards, e.g., noise levels, water quality, ambient air quality, etc [33]. The problem is more
119
significant in case of qualitative PIs or newly developed PIs without any past information. Secondly,
120
establishing desired LOS based on expert knowledge, indigenous know-how, and available literature
121
leads to several possible uncertainties in the performance assessment process, such as vagueness in
122
expert opinion, limited knowledge, site specific needs limiting the use of literature values, variations
123
in data due to limited number of measurements, and possible equipment and human errors [34, 35].
124
To the best of authors knowledge, there is no performance assessment model exist which can
125
answer these questions: i) How to initiate performance assessment process for MSWM systems in the
absence of extensive past data?, How to use PIs for effective decision-making at different levels (top
127
and operational management) of the organizational hierarchy?, and iii) How to address different
128
uncertainties, associated to data limitations, measurement errors, vagueness in expert opinion, and
129
imprecision in indigenous knowledge, exist in the performance assessment process?
130
Performance benchmarking of MSWM systems has not been fully established in several
131
countries, so far, including Saudi Arabia and Gulf region. The main objective of this research is to
132
develop Performance Assessment Model for municipal Solid Waste Management systems
(PAM-133
SWM) to address the above stated issues for sustainability of MSWM systems in the Gulf region.
134
PAM-SWM provides a platform to municipality manager for performance assessment in the absence
135
of an existing benchmarking process. The outcomes of the proposed model can be simultaneously
136
used for inter-municipality benchmarking and intra-municipality performance management.
137
2. Materials and Methods
138
2.1 Performance Assessment Criteria
139
A hierarchical based top-down model is developed to assess the performance of seven key
140
components, including the PSP, PAW, PAE, OPR, ENE, SSC, and EFV. These key components were
141
identified based on the most commonly used classifications in past studies as described in the
142
beginning of the Introduction section. Details of model’s structure are provided in the Section 4.
143
Performance assessment criteria consists of performance objectives of the key components at the top
144
of the hierarchy, followed by performance attributes of subcomponents at level 1 and level 2. At the
145
bottom of the hierarchy, the data variables are used to calculate the PIs. The PIs are the main building
146
blocks which provide inputs to the upper levels of hierarchy. Most of the PIs have been selected
147
through an exhaustive literature review [4,23-25,32]. In the present study, performance objectives,
148
performance attributes (PAs), and some of the PIs with indigenous relevance have also been selected
149
for performance assessment of MSWM systems in the KSA [36].
150
The performance assessment criteria developed in present research are itemized in Table 1. Each
151
level of parent-child-hierarchy corresponds to a specific generation. The first four columns of Table
152
1 present the four generations of performance assessment hierarchy for all the seven key components,
153
including performance objectives, performance attributes (for both the subcomponents level-1 and
154
level-2). Basic inputs consisting of data variables and the decision variables are given in the fifth
155
column while the possible improvement actions are listed in the last column of Table 1. The data
156
variables will be obtained from the participating municipalities for a given assessment period, i.e.,
157
preferably one year. For example, the data variables for the PI of ‘employees per ton of daily waste
158
generated’ (PE1) are ‘total number of full time employees’ and ‘ton of daily waste generated’. The
159
decision variables could be the numerators, denominators, or both, e.g., in case of PE1 both the
160
variables are decision variables that can be improved.
161
The approach developed in this study will systematically facilitate the decision-makers working
162
at various levels in the organizational hierarchy structure of MSWM systems. Top level managers
163
and policy makers are more concerned with the compliance and non-compliance of performance
164
objectives to assess the overall performance of their MSWM systems to obtain financial approvals
165
from government or to establish a rationale for overall performance improvement [37,38].
166
Operational managers will be interested in the performance of their respective sub-component, e.g.,
167
landfill manager, operation and maintenance (O&M) manager, transportation manager, manager of
168
cleaning, environmental and chemical laboratory in charge, etc. In the remaining text, all the
169
performance factors, i.e., objectives, attributes, and indicators, are designated as italics. While the PIs
170
are labeled with their corresponding code stated in the fourth column of Table 1. The performance
171
assessment criteria are discussed in the following sub-sections.
172
173
Preprints (www.preprints.org) | NOT PEER-REVIEWED | Posted: 30 January 2019
Preprints (www.preprints.org) | NOT PEER-REVIEWED | Posted: 30 January 2019 doi:10.20944/preprints201901.0303.v1
174
doi:10.20944/preprints201901.0303.v1
Peer-reviewed version available at
Environments
2019
,
6
, 19;
175
176
Preprints
(www.preprints.org) | NOT PEER-REVIEWED | Posted: 30 January 2019
Preprints
(www.preprints.org) | NOT PEER-REVIEWED | Posted: 30 January 2019
doi:10.20944/preprints201901.0303.v1
Peer-reviewed version available at
Environments
2019
,
6
, 19;
2.1.1 Public Service and Participation (PSP)
177
Two sub-components at level-1, including ‘quality of service’ and ‘level of public participation’
178
assesses the key component of ‘Public Service and Participation’ (Table 1). The former counts the
179
effectiveness of three PIs which are ‘solid waste production per capita’ (PU1), ‘coverage of collection
180
services’ (PU2), and the ‘persons not satisfied with the waste management services’ (PU3). The first PI
181
indirectly reflects the success of sustainable waste practices in the area, i.e., high per capita waste
182
generation shows that the public is not fully informed about these practices or a government’s vision
183
towards waste management. The second PI conveys the evidence about the part of the service area
184
not being covered by the municipality.
185
Customers satisfaction depends on the gap between the level of service (LOS) provided by the
186
municipality and the customers’ expected LOS. It also depends on a certain level of acceptance of the
187
performance gap subject to the cost being paid by the customers for a given LOS. The trust of the
188
customers, i.e., built on the basis of long-term performance of the municipality, also dictates the level
189
of customer satisfaction [36]. LOS can be assessed through interview surveys, but the relationship
190
between the customer and the service provider in the Gulf is exclusive as MSWM is a public service
191
(without any cost) instead being a sold product. The term ‘public’ seems to be more coherent than the
192
conventional terms used, i.e., ‘customers’. The last indicator (PU3) provides the facts about
193
complaints (both the written and oral) reported by the public in a given assessment period. If the data
194
is available, additional sub-components at level-2 can be added to evaluate the response and
195
resolution times of these complaints [39]. Presently, the data is only available about the number of
196
complaints and thus included in this sub-component level-1.
197
The second sub-component (level-1), ‘level of public participation’, is assessed by encompassing
198
three useful PIs, including ‘community involvement in improving existing practices’ (PU4), ‘public
199
acceptance of waste management plans and actions’ (PU5), and ‘community awareness about importance of
200
SWM’ (PU6) [23] (see Table 1). Effective involvement of community in the decision making process
201
improves the LOS [40]. In situations where MSWM is a free service and no economic stakes of the
202
public exist, it might be challenging to motivate a large majority of public to be involved in the
203
improvement process of existing practices. PU4 can be enhanced by promoting awareness (PU6)
204
about environmental consequences of not adopting sustainable practices in future through media
205
and regular education circulars. Better situational awareness will subsequently enhance the
206
performance level of both the PU4 and PU5. Measurability of these PIs will require a structured
207
process of keeping the record of all the public-service provider meetings; for the moment, these PIs
208
are qualitatively calculated based on the practical knowledge of municipality managers.
209
2.1.2 Personnel Adequacy and Wellbeing (PAW)
210
The key component of ‘personnel adequacy and wellbeing’ is evaluated with the help of two
level-211
1 sub-components, including ‘personnel adequacy’, and ‘wellbeing and workplace performance’.
212
The first sub-component level 1 is further built upon two level-2 sub-components, including
213
‘staffing level’ and ‘staff productivity ratio’. ‘Staffing level’ is an aggregated measure of three PIs
214
‘employees per ton of daily waste generated’ (PE1), ‘number of collection staff per 1000 households’ (PE2), and
215
‘number of employees working at landfill per ton of daily waste generated’ (PE3). The first PI is an overall
216
measure of personnel adequacy and is useful for cross-comparison with other municipalities. The
217
other two PIs in this sub-component evaluate the efficacy of personnel to perform two important
218
elements of solid waste management, i.e., collection and disposal. In addition to collection managers
219
and supervisors, PE2 includes the drivers (both the fulltime or part-time). In case of part-time drivers,
220
working hours can be used to calculate the full-time equivalent (FTE) employees in addition to full
221
time employees. Generally, there is an integrated facility at the final disposal point dealing
222
simultaneously with MRF and landfilling operations. PE3 should be calculated for the personnel
223
exclusively responsible for landfill operations.
224
225
It has been reported that due to better opportunities in large cities, hiring and retaining trained
226
personnel in smaller municipalities is more challenging as compared to the large municipalities [39].
In general, different personnel might be responsible for multiple tasks, so the FTE employees should
228
be carefully estimated, particularly for top level management who is taking part of decision-making
229
for other utilities in a municipality. Staffing level is usually kept minimum in large systems to
230
efficiently perform routine operations. This also result in high ‘staff productivity ratio’ (SPR) and is
231
calculated as the ratio between ‘tons of solid waste generated in a year’ and the ‘total number of FTE
232
employees’. A certain number of personnel is indispensable for any municipality to efficiently perform
233
the routine operations. Over-hiring can result in a financial burden; thus the overall numbers of FTE
234
employs need to be optimized rationally. PAM-SWM maintains a balance between minimum ‘staffing
235
level’ and high ‘SPR’, to achieve the attribute of ‘personnel adequacy’.
236
The third level-1 sub-component consists of three PIs, including ‘working accidents during the
237
assessment period’ (PE4), ‘number of sick days taken per field employee’ (PE5), and ‘personnel training hours
238
in the assessment period’ (PE6). The first two PIs measure an overall effectiveness of the health and
239
safety culture in the municipality while training of personnel in inevitable to meet the sustainability
240
objectives of Saudi Arabia’s Vision 2030 [10].
241
2.1.3 Environmental Endurance (ENE)
242
The performance of the key component of ‘environmental endurance’ is appraised from three
level-243
1 sub-components, including ‘condition of environmental aesthetics’, ‘condition of geo-environment’, and
244
‘leachate treatment efficacy’. The first sub-component is assessed with the help of two PIs, including
245
‘visual impact’ (EN1) and ‘odor impact’ (EN2). Movement of vehicles and dumping of waste can
246
produce dust in the landfill area. Littering due to movement of animals and rodents can affect the
247
visual character of the attributes of natural landscape. Landfill operations also generate various types
248
of odorous gases, e.g., ammonia, CO, methane, etc., which can be annoying for the public, particularly
249
living in the nearby settlements. Proper fencing and plantation at the landfill site can reduce these
250
impacts to a certain extent. Keeping the landfill site outside the main city is a planning measure which
251
can minimize these impact on the environmental aesthetics over the long-term operational phase.
252
Impact of leachate on geo-environment is assessed with the help of three level-2 subcomponents,
253
including ‘impacts of physical parameters’, ‘impacts of biochemical parameters’ and ‘impacts of chemical
254
parameters’. The PIs (i.e., parameters) for which the data was available with the participating
255
municipalities were used to evaluate these sub-components. Temperature, total dissolved solids
256
(TDS), and total suspended solids (TSS) were encompassed under the first sub-component as the
257
physical parameters, i.e., EN3, EN4, and EN5. Bio-chemical parameters of leachate included 5-day
258
biochemical oxygen demand (BOD), chemical oxygen demand (COD), and the ratio between BOD
259
and COD (i.e., BOD: COD), i.e., EN6, EN7, and EN8. The third sub-component was comprised of
260
three PIs, including nitrates (NO3) (EN9), phosphorus (EN10), and ammonia (EN11). An efficient
261
leachate collection and treatment system is required to minimize the adverse impacts of these
262
parameters.
263
All the physical, biochemical, and chemical parameters were quantitatively measured in terms
264
of concentrations through laboratory analysis while the aesthetic PIs were qualitatively assessed
265
based on the expert judgment of field staff. Higher values of all these parameters either direct towards
266
the possibility of anaerobic conditions in the landfill, which may lead to adverse impacts on soil and
267
groundwater, or directs towards improper planning, design, and operations of the landfill.
268
2.1.4 Physical Assets Efficacy (PAE)
269
Two sub-components level-1, including ‘self-sufficiency of physical systems’ and ‘efficiency of
270
physical systems’ appraise the key component of ‘physical assets efficacy’. The first sub-component
271
consists of two PIs, including ‘presence of material recovery facility’ (PH1) and ‘lack of appropriate waste
272
recycling facilities’ (PH2) (also see Table 1).
273
A fully automated MRF separates, processes, and stores the solid waste for remanufacturing or
274
reprocessing with additional benefits can be obtained in terms of financial revenues and biogas
275
production [41]. A recovery facility is more desired, particularly for the service areas with inadequate
276
or absence of source separation practices. The second PI selected under the first sub-component, i.e.,
277
(PH2), is included for smaller municipalities relying on manual recovery of recyclables in the absence
278
Preprints (www.preprints.org) | NOT PEER-REVIEWED | Posted: 30 January 2019
Preprints (www.preprints.org) | NOT PEER-REVIEWED | Posted: 30 January 2019 doi:10.20944/preprints201901.0303.v1
of a contemporary facility. Special care is needed to reduce the risk to worker’s health and safety
279
during the manual waste separation process. Inadequate waste recovery processes (i.e., high PH3)
280
may reduce the remaining service life of the landfill due to possible increase in the landfilling rate
281
[42].
282
The performance of the second sub-component depends on ‘equipment cleaning frequency’ (PH3)
283
and ‘inefficient waste collection equipment’ (PH4). Following the best practices, it is mandatory for all
284
the municipalities to follow an inclusive O&M plan for their equipment and vehicles. PH3 calculates
285
the number of times an equipment is cleaned during a given assessment period while PH4 informs
286
about the rusty and aged storage containers. Higher number of such containers may lead to both the
287
operational difficulties (i.e., more time spent at the collection site due to handling of scruffy
288
containers) and the nuisance to public due to blowing litter and spilling of liquid waste from such
289
containers.
290
2.1.5 Operational Reliability (OPR)
291
The key component of ‘operational reliability’ is evaluated with the help of two sub-components
292
(level 1), including ‘efficacy of waste generation, separation, and collection systems’, and ‘efficacy of waste
293
recycling, and disposal systems’.
294
The performance of first level 1 sub-component depends on three level 2 sub-components, i.e.,
295
‘waste categorization rate’, ‘waste handling and separation rate’, and ‘collection / transfer and transport rate’.
296
Waste categorization rate is assessed with the help of two PIs ‘amount of construction and demolition
297
generated per year’ (OP1) and ‘segregation of waste collected for each category’ (OP2). The first PI is included
298
in this sub-component because the municipalities are receiving construction and demolition (C&D)
299
waste from the service areas in the absence of separate facility to deal with this recyclable waste. The
300
entire waste received at the disposal site can be categorized by improving OP2.
301
The second sub-component (level 2) has been evaluated with the help of three PIs, including
302
‘discarded inorganic waste’ (OP3), ‘waste separation rate for recycling’ (OP4), and ‘average distance between
303
collection bins for recycles and the houses’ (OP5). OP3 consists of the percentage of total waste which can
304
neither be recycled nor disposed of in the landfill due to its inorganic nature and can only be
305
incinerated. OP4 reflects the level of separation of recyclables at the source. Through personal
306
communication with the municipality personnel, it was found that some of the households separate
307
the recyclable waste and place it next to the collection bin at the nearest collection point or outside
308
their yards. General public avoids to walk for distances longer than 250m [43] to dispose recyclables
309
in the community containers (which have been placed outside some central locations such as
310
hospitals, malls, etc.); according to others not more than 60m [44]. Therefore, OP5 determines the
311
need of two bin system for individual household.
312
The third sub-component level 2, under the first level 1 sub-component, contains two PIs,
313
including ‘average distance travelled by collection vehicle’ (OP6) and ‘level of collection of recyclables from
314
the containers’ (OP7). Former can facilitate for optimizing the routes of collection vehicles while later
315
identifies the need of additional community bins.
316
Second sub-component level 1 has been assessed with the help of two sub-components at the
317
2nd level of the hierarchy, including ‘recycling efficiency’ and ‘landfill and disposal efficiency’. The first
318
level 2 sub-component consists of two PIs of ‘C&D waste recycled’ (OP8) and ‘municipal solid waste
319
recycled’ (OP9). The second sub-component at the same level evaluates the utilization of landfill and
320
its remaining service life with the help of OP10, OP11, and OP12 (See Table 1).
321
2.1.6 Sustainability Compliance (SSC)
322
For sustainable development, through the life cycle, i.e., planning, design, operation and
323
maintenance, and the end-of-life, a MSWM facility needs to adopt best practices [45]. Sustainability
324
of a MSWM system depends on the level of waste recycling and reuse practices in the service area,
325
implementation of state-of-the-art methods for sustainability assessment, and the dynamics of the
326
waste treatment facilities. Therefore, sustainability performance component has been directly
327
assessed from three PIs, including ‘annual increase in total amount of solid waste’ (SU1), ‘level of
application of life cycle costing (LCC) and life cycle assessment (LCA) tools’ (SU2), and ‘treatment
329
facilities dynamics’ (SU3).
330
SU1 directs towards two important aspects: i) possible expansions in the service area, and ii)
331
increasing rate of per capita waste production due to increasing affluence and technological
332
advances. SU2 expresses the degree of sustainable practices in a municipality, such as LCC and LCA.
333
LCC is more helpful for managing the infrastructure assets. LCA effectively assesses and mitigates
334
the possible environmental impacts during all the phases of a MSWM facility, e.g., climate change,
335
ecotoxicity, respiratory effects, etc. In past studies, integrated waste management options have been
336
identified as the most sustainable practice for minimizing both the cost and environmental impacts,
337
for instance landfilling and composting alone or in combination [46].
338
2.1.7 Economic and financial viability (EFV)
339
The key component of ‘economic and financial viability’ is directly derived from three PIs,
340
including ‘collection cost per ton of waste generated’ (EF1), ‘cost of municipal wastes disposal per metric ton’
341
(EF2), and ‘recycling cost per ton of waste generated’ (EF3). These three PIs were selected to assess the
342
performance of this component based on availability of financial information and recognizing the
343
privacy constraints of the participating municipalities for financial data sharing.
344
2.2 Performance Assessment model for municipal Solid Waste management systems (PAM-SWM)
345
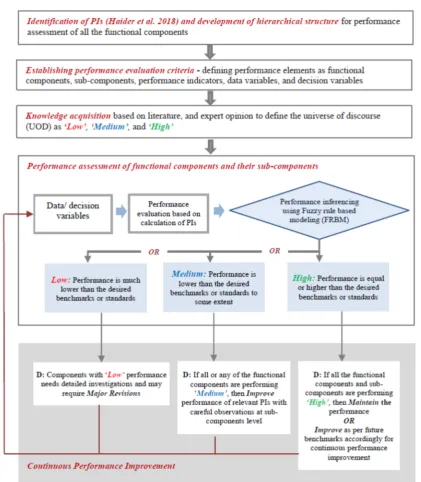
The proposed methodology for development of performance assessment model for municipal
346
solid waste management systems (PAM-SWM) is presented in Figure 1. The step-by-step procedure
347
of model development is given in the following sub-sections.
348
349
Step 1: Select PIs and develop a conceptual hierarchical structure
350
Two approach of reasoning have been used for sustainability performance modeling, including
351
deductive reasoning and inductive reasoning. Top-down approach is based on deductive reasoning
352
where the experts define both the framework as well as the sustainability criteria. Inductive reasoning
353
facilitates in using the bottom-up approach in which different stakeholders provide their inputs for
354
developing the framework and establishing the sustainability criteria [47]. In present research, the
355
performance assessment criteria (developed in Section 2), consisting of performance objectives,
356
performance attributes, and PIs, have been structured using the top-down approach in Figure 2.
357
PIs were identified through an exhaustive literature review and selected through a subsequent
358
screening process. Managers from the two participating municipalities in the Qassim province and
359
experts from academia were involved in the selection process.
360
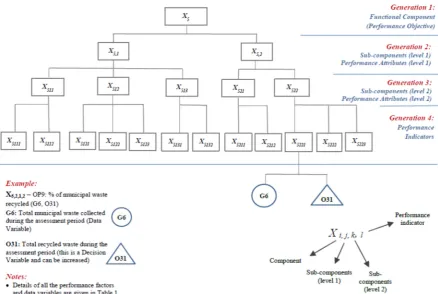
Figure 2 presents the concept of the deductive hierarchical approach used in this research to
361
develop PAM-SWM. The concept is based on a typical ‘family’ structure alike parent-child
362
relationship. Oldest parent in the family correspond to the main key component of MSWM. In the
363
subsequent intermediate levels of hierarchy, sub-components are the ‘children’ of their respective
364
parents in the upper levels of hierarchy. PIs at the bottom of the hierarchy possess no ‘children’ and
365
thus are called as ‘basic performance factors’. Each family may consist of one, two, or three children,
366
and each one of them can have children in the next generation. A parent may have a younger child
367
in lower level of hierarchy, for instance, PIs directly input to the key components of SSC and EFV.
368
369
370
371
372
373
Preprints (www.preprints.org) | NOT PEER-REVIEWED | Posted: 30 January 2019
Preprints (www.preprints.org) | NOT PEER-REVIEWED | Posted: 30 January 2019 doi:10.20944/preprints201901.0303.v1
374
375
Figure 1: Conceptual model for performance assessment of municipal solid waste management
376
(MSWM) Systems
Figure 2: A conceptual hierarchical structure for performance assessment of MSWSs - An example
380
of functional component of Operational Efficiency
381
382
Each member of the family in Figure 2 is essentially a performance factor. The notation Xi,j,k,l
383
denotes a performance factor, where i corresponds to the number of a key component (e.g., OPR, SSC,
384
etc.), j represents the number of sub-components (level 1) in the current generation, k is the
sub-385
component at level 2, and l is the number of the PI in present generation. Data variables are the inputs
386
for calculating the PIs while one of the numerator or denominator (in the PI’s formula) could be a
387
decision variable. For example, ‘cost of municipal waste disposal per metric ton’ (EF2) can be reduced
388
by reducing the ‘waste to landfill’ (O51) with increasing the ‘weight of recycling waste’ (E95) (also see
389
Table 1). Thus, both the data variables O51 and E95 are essentially the decision variables as well.
390
Some data variables are constants during the given assessment period, such as population (G3), total
391
number of collection vehicles (P58), etc. See Column 5 of Table 1 for details about data and decision
392
variables.
393
394
Step 2: Establishing performance assessment criteria
395
Performance assessment criteria established in present research has already been explained in
396
Section 2. Different performance factors have been stated in Table 1.
397
398
Step 3: Knowledge acquisition
399
Data variables calculate the PIs and are listed in column 5 of Table 1. Calculated PIs needs to be
400
compared with the desired performance levels and translated into performance scores ranging from
401
0 to 10 with the help of a rational universe of discourse (UOD) developed through the knowledge
402
attained from literature and the expert judgment. UOD established for all the PIs is attached as
403
Appendix I. Calculated values of the PIs are linguistically fuzzified as ‘low’, ‘medium’, and ‘high’
404
against the performance scores ranges of 0 to 4, 3 to 7, and 6 to 10. The performance objective of a
405
key component and sub-components of the hierarchy (described in Fig. 2 and Table 1) varies between
406
0 and 100.
407
Preprints (www.preprints.org) | NOT PEER-REVIEWED | Posted: 30 January 2019
Preprints (www.preprints.org) | NOT PEER-REVIEWED | Posted: 30 January 2019 doi:10.20944/preprints201901.0303.v1
As the universe of discourse (UOD) to evaluate different performance indicators was established
408
for the municipalities operating in Saudi Arabia, the model may need minor changes for its
409
implementation in a different region.
410
Step 4: Performance assessment using fuzzy rules based modeling (FRBM)
411
After establishing the UOD in Step 3, the next step in Figure 1 is performance assessment. This
412
step initiates with calculating the PIs with the help of data variable for the MSWM system being
413
investigated. The performance of sub-components (attributes) and the key component at the top of
414
the hierarchy are inferred using the deductive approach introduced Step 1.
415
Generally, the fuzzy-based techniques are useful for the situations dealing with inputs (i.e., PIs
416
in this research) which are subjective in nature, i.e., driven from human expertise, judgment, and
417
intuitions [48]. There are various types of uncertainties exist, as already defined in introduction
418
section, to deduce the performance, such as i) vagueness in opinion of experts due to varying level of
419
knowledge, particularly for qualitative PIs, and ii) imprecise information about quantitative PIs due
420
to limited number of measurements such as physico-chemical characteristics of leachate. Therefore,
421
fuzzy rule-based modeling (FRBM) is used to deal with these inherent uncertainties.
422
Zadeh [49] introduced the fuzzy set theory to logically integrate human reasoning in decision
423
making process. Mamdani [50] used if-then rules to develop the linguistically defined model which
424
can deal with the subjective and uncertain knowledge and information. According to the fuzzy rules
425
in FRBM, ‘If antecedent proposition, then consequent proposition’. This interpretation of this
426
expression is that if the fact (premise, hypothesis, antecedent) is known, then the conclusion
427
(consequent) can be inferred [35]. The antecedent proposition is a fuzzy proposition of the type ‘X is
428
A’; where X is a linguistic variable (e.g., personnel training) and A is a linguistically defined constant,
429
for example, ‘low’, medium’, etc. A fuzzy set allows to define membership values between ‘0’ and ‘1’,
430
in contrast to a classical set where the elements have to have a membership of ‘0’ or ‘1’. For details,
431
the readers are referred to Ross [51].
432
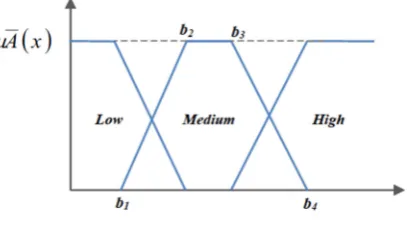
In present research, the UOD has been defined for PIs, performance attributes, and performance
433
objectives using the fuzzy trapezoidal membership functions. In Figure 3, the UODs of different
434
membership functions have be defined with the elements (a, b, c, and d). These membership functions
435
are attached in Appendix I for all the PIs. The fuzzy operator ‘AND’ is used as all the PIs, PAs, and
436
POs are independent and not mutually exclusive. For instance, the desired rule for the
sub-437
component of ‘wellbeing and workplace performance’ (X2,3) can be written as:
438
‘IF working accidents (X2,3,1) are low AND number of sick days taken per field employee (X2,3,2) are low
439
AND personnel training hours (X2,3,3) are high THEN the wellbeing and workplace performance (X2,3) is high.’
440
In the development of PAM-SWM, total of 495 rules were established; keeping in view the space
441
limitations, an example of the rules for X2,3 is presented in Appendix II. Based on the structure of
442
PAM-SWM, 18 sub models were developed for sub-components in the middle of hierarchy. Finally,
443
all these sub-models were integrated using Simulink in MATLAB for inferencing the performance of
444
7 top level key components.
445
Step 5: Performance management of MSWM systems
446
Results of PAM-SWM provide the holistic view of compliance of performance objectives to the
447
top management of the municipality. In case of ‘low’ and ‘medium’ performance levels, top
448
management can consult with the relevant operational management (e.g., landfill manager,
449
transportation manager, etc.) for major revisions or minor improvements respectively (also see Figure
450
1) at the lower levels of hierarchy, i.e., PAs and subsequently the respective lacking PIs. Possibly,
451
‘low’ performance at sub-component level is a result of more than one lacking PI while ‘medium’
452
performance might be a reflection of a single decision variable which needs to be improved. In case
453
of ‘high’ performance the key component or the sub-components needs to be maintained. A ‘high’
454
performing component, sub-component, or indicators may also require further improvements if the
455
benchmarking process also incorporates the concept of continuous performance improvement (CPI).
456
Discussions on integrating the CPI with the performance management of SWMs is presented at the
457
end of Section 4.
460
461
462
463
464
465
466
467
468
469
Figure 3: Trapezoidal membership function; b1, b2, b3 and b4 define the range of ‘Medium’, i.e., a
470
fuzzy number (Source: Haider et al. 2016)
471
2.3 Study Area
472
Qassim province is located in central part of KSA. Due to extensive agricultural activities, the
473
region holds its unique importance in the country. The study area consisting of two main cities in
474
Qassim region is illustrated in Figure 4. Municipalities of both the cities are also located in the figure.
475
City A is the capital and City B, located in the south of City A, is the second largest city of Qassim
476
province. Due to industrialization and relatively moderate climatic conditions, both the cities have
477
been experiencing increase in population and industrialization during the recent past. Reported
478
populations of City A and City B were around 700,000 and 185,000 (as of 2014), respectively, and is
479
likely to increase at a higher rate in future [52]. The reported municipal solid waste generation rate is
480
1.2 to 1.3 kg/person-day for City A and 1.1 to 1.2 kg/person-day for City B service areas [53]. In both
481
the cities, the primary focus of the MSWM systems is on the collection of municipal solid waste with
482
limited source separation. Municipality of City A is encouraging citizens for source separation by
483
providing green colour containers for recyclables; however, the initiative is at early stage. It can be
484
seen in Figure 4 that landfill sites in both the cities are located outside the cities’ boundaries to avoid
485
nuisance of objectionable gasses. Although, City A has a functional planned industrial area, primary
486
land uses of both the cities are residential, commercial, and public.
487
Presently, the government of Kingdom of Saudi Arabia (KSA) is facing challenges of managing
488
large volumes of solid waste due to rapid urbanization, industrialization, and high population
489
growth rate. With present population of around 30.8 million, annually more than 15.3 Mt of solid
490
waste is being generated in the country [54]. Recently, the National Transformation Program (NTP)
491
for the year 2020 aimed to: i) improve the percentage of treated waste to at least 40% of the total waste
492
produced, and ii) establish an organizational framework for integrated waste management in the
493
country by the end of year 2020. These objectives are going to be implemented through stringent
494
controls on financial spending, focusing on high impact projects, aligning strategic priorities to the
495
budget, rigorous auditing, and tough accountability mechanisms. It is expected that proper MSWM
496
facilities would contribute to economy through providing job opportunities and improving waste
497
recycling activities [53,55]. Presently, no comprehensive performance assessment mechanism exists
498
in any of the facilities which can benchmark their existing performance, identify the lacking
499
performance components and sub-components, and identify the possible improvements (e.g., energy
500
recovery potential, maximize reuse, etc.) in future for CPI.
501
502
503
504
Preprints (www.preprints.org) | NOT PEER-REVIEWED | Posted: 30 January 2019
Preprints (www.preprints.org) | NOT PEER-REVIEWED | Posted: 30 January 2019 doi:10.20944/preprints201901.0303.v1
505
506
Figure 4: Study area showing locations of landfill sites in City A and City B
507
508
3. Results
509
With present population of around 30.8 million, annually more than 15.3 million tons of solid
510
waste is being generated in the country. The estimated daily per capita waste generation rate is 1.5 to
511
1.8 kg/capita-day [54] which is higher than the current global average of 0.74 kg/capita-day [1].
512
Municipalities of City A and City B, named as Municipality A and Municipality B, are presently
513
covering service areas of 1400 km2 and 1200 km2, respectively. The conceivable reasons for this minor
514
difference are: i) much lower population density in Municipality B due to less industrial activities,
515
and ii) that the municipality covers some smaller towns located in the proximity up to 25km from the
516
main city center. The land uses in the service areas of both the municipalities are diverse, i.e.,
517
residential, agricultural, commercial, public, and industrial. The ground elevation of the cities above
518
mean sea level is around 650 m and the terrain ranges from flat to rolling.
519
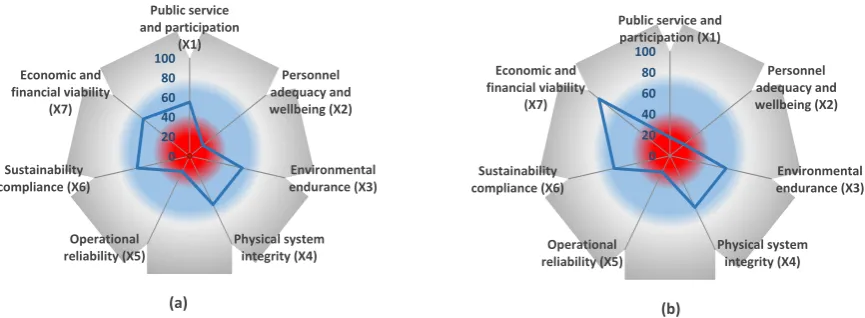
The performance assessment results, for the assessment period between 1st July 2016 to 30th
520
June 2017, obtained by the PAM-SWM for both the municipalities are illustrated with the help of web
521
diagrams in Figure 5a&b. It can be seen in the figure that for the key component of PSP (X1), the
522
performance of Municipality A (Figure 5a) is ‘medium’ while the Municipality B lies in ‘low’
523
performance zone. For the component of PAW (X2), both the municipalities showed ‘low’
524
performance. In case of ENE (X3), PAE (X4), and SSC (X6), both the municipalities lie in ‘medium’
525
performance zone. Likewise, both showed ‘low’ performance for the key component of OPR (X5).
526
However, in case of EFV (X7) component, the Municipality B outperformed the Municipality A
527
showing ‘high’ performance for this key component. The municipalities are supposed to maintain
528
N
City A
their key components only when their performances lie in the light grey region in Figure 5. This
529
colour represents that all the sub-components and the PIs have met or topped the established
530
benchmarks with ‘high’ performance.
531
The results shown in Figure 5 certainly demand to hone in the performance of sub-components
532
and the PIs for performance improvement. Accordingly, the performances of different
533
subcomponents (Level 1) under each key component, except for X6 and X7 which contain no
sub-534
component, are illustrated in Figure 6. It can be observed that the main cause of ‘low’ performance of
535
Municipality B was the lower ‘level of public participation’ (X12) in their service area. According to
536
the manager of the participating municipality, ‘community’s involvement in improving existing
537
practices’ (X1,2,0,1) and ‘public awareness about importance of SWM’ (X1,2,0,3) were essentially
538
negligible. However, both the municipalities either need to revise or improve most of the
sub-539
components under the component of PSP (X1).
540
541
Figure 5: Performance assessment results of all the functional components of participating MSWM
542
municipalities, a) Municipality A, b) Municipality B
543
544
In case of sub-components of PAW (X2), the ‘personnel adequacy’ (X2,1) was found to be
545
‘medium’ in the Municipality B. While for the Municipality A all the other sub-components lie in
546
‘low’ performance zone. Detailed performance scores of all the PIs are presented in Figure 7.
547
‘Personnel training’ (X2,2,0,3) is an important component which both the municipalities need to
548
seriously work on to meet the objectives of 2030 vision of KSA [10]. Providentially, less number of
549
sick days were noticed in the Municipality A. Both the municipalities definitely need to work on their
550
workers’ health and safety regulations and practices to avoid such high number of working accidents,
551
i.e., X2,2,0,1. It should be noted that most of the accidents were of trivial (e.g., slight bruising, self-help
552
recovery, etc.) or minor (e.g., small cut, basic first aid needed, etc.) severity levels and well-mitigated
553
at the time of occurrence; additional pro-active and careful safety measures can further reduce the
554
frequency of such events.
555
556
557
558
559
560
561
562
563
564
0 20 40 60 80 100 Public service and participation (X1)
Personnel adequacy and wellbeing (X2)
Environmental endurance (X3)
Physical system integrity (X4) Operational
reliability (X5) Sustainability compliance (X6)
Economic and financial viability
(X7)
(b) 0
20 40 60 80 100 Public service and participation
(X1)
Personnel adequacy and wellbeing (X2)
Environmental endurance (X3)
Physical system integrity (X4) Operational
reliability (X5) Sustainability compliance (X6)
Economic and financial viability
(X7)
(a)
Preprints (www.preprints.org) | NOT PEER-REVIEWED | Posted: 30 January 2019
Preprints (www.preprints.org) | NOT PEER-REVIEWED | Posted: 30 January 2019 doi:10.20944/preprints201901.0303.v1
565
566
567
568
569
570
571
572
573
574
Figure 6: PAM-SWM results for all the sub-components (Level 1). Light colour bar represents the
575
performance of municipality of City A and dark colour bar corresponds to City B
576
577
578
579
580
581
582
583
584
585
586
587
588
589
590
591
592
593
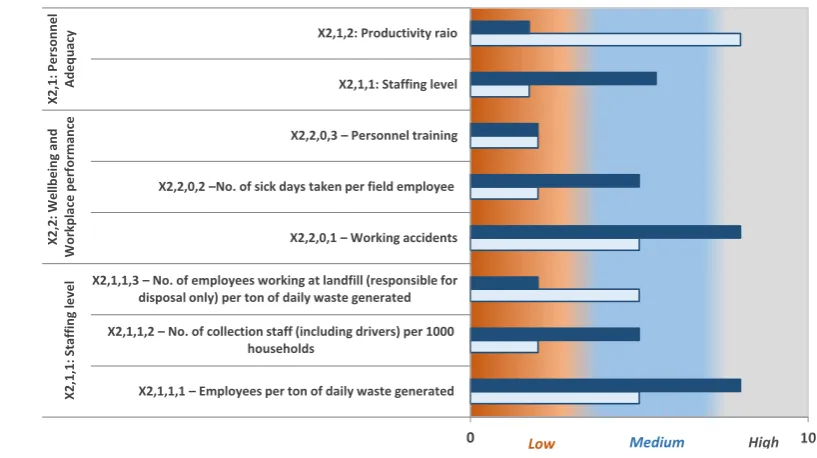
Figure 7: Example of ‘personnel adequacy and wellbeing’ – results for generation 3 (sub-component
594
level 2) and generation 4 (performance indicators). Light colour bar represents the performance of
595
municipality of City A and dark colour bar corresponds to City B
596
597
598
599
600
601
0 100
X1,1 - Quality of Service X1,2 - Level of Public Participation X2,1 - Personnel Adequacy X2,2 - Wellbeing and Workplace Performance X3,1 - Condition of Environmental Aesthetics
X3,2 - Condition of Geo-Environment X3,3 - Leachate Treatment Efficacy X4,1 - Self-Sufficiency of Physical Systems X4,2 - Efficiency of Physical Systems X5,1 - Efficacy of Waste Generation, Separation, and
Collection Systems
X5,2 - Efficacy of Waste Recycling, and Disposal Systems
REVISE IMPROVE MAINTAIN
0 10
X2,1,1,1 – Employees per ton of daily waste generated X2,1,1,2 – No. of collection staff (including drivers) per 1000
households
X2,1,1,3 – No. of employees working at landfill (responsible for disposal only) per ton of daily waste generated
X2,2,0,1 – Working accidents X2,2,0,2 –No. of sick days taken per field employee X2,2,0,3 – Personnel training X2,1,1: Staffing level X2,1,2: Productivity raio
X2,
1
,1: St
affi
ng l
evel
X2,
2
: Well
b
ei
n
g a
n
d
W
o
rk
p
la
ce
pe
rf
or
m
an
ce
X2,
1
: Per
sonn
e
l
Ad
equ
acy
Both the municipalities performed alike under all the sub-components of ENE (X3) component
602
due to identical composition of waste, source separation practices, controls of visual and odor
603
impacts, and level of leachate treatment. Existing odor control measures and bounded landfill
604
operation resulted in ‘high’ ‘condition of environmental aesthetics’ (X3,1). The ‘medium’ ‘condition
605
of geo-environment’ (X3,2) shows that the leachate being generated form the landfill is of
moderate-606
strength . Presently, no appropriate leachate treatment facility exists (i.e., X3,3) in both the
607
municipalities. As per the current leachate treatment practice, the collected leachate from the leachate
608
collection system is sprayed on a media, consisting of mud and rocks, located within the boundaries
609
of landfill site. The dry solids after the natural evaporation process are being incinerated.
610
Being the largest of two, City A has an operational material recovery facility (MRF), i.e., X4,1,0,1.
611
In the absence of the MRF, the Municipality B is facing difficulties for extracting reusable and
612
recyclables, e.g., glass, rubber, paper, steel, etc. In addition to low recycling efficiency (i.e., X4,1,0,2), the
613
manual separation may increase the risk of worker’s health and safety at the sites . It was also found
614
through personal communication that the MRF in the Municipality A is facing few issues which need
615
to be resolved in future, e.g., lack of technical personnel, some materials like metal and glass are not
616
being separated for reuse, etc. Both the municipalities showed ‘high’ equipment cleaning efficiency
617
(X4,2,0,1). However, percentage of inefficient collection vehicles (i.e., X4,2,0,2) was found to be high in the
618
Municipality A.
619
Sub-components of both the municipalities under the component of ‘operational reliability’ (X5)
620
showed ‘low’ performance. The primary reasons of such performance of the sub-component of
621
‘Efficacy of waste generation, separation, and collection systems’ (X5,1) are ‘improper waste storage at
622
landfill site’ (X5,1,2,1), low ‘waste separation rate of recycling’ (X5,1,2,2), large ‘distance between the
623
collection bins for recycling and the houses’ (X5,1,2,3), and low ‘level of collection of recyclables from
624
the containers’ (X5,1,3,2) . Although, fewer households keep the recyclables in separate plastic bags and
625
then place them outside the property next to the collection bins. This practice in rare with a very small
626
contribution and should be enhanced by providing a conventional two-bin system. Currently, some
627
medium-sized containers have been placed outside the large commercial centers located in the
628
municipalities’ service areas. Large amount of construction and demolition waste per capita (i.e.,
629
X5,1,1,1) collected at the landfill site in the Municipality B shows massive development activities in the
630
city. However, this topic has to be dealt with details in a separate study. The purpose of including
631
this PI in present research is the absence of an appropriate mechanism for C&D waste management.
632
At the moment, the municipalities manually sort the salvageable recyclable material from the
633
collected C&D waste at the landfill site and dispose the remaining into the landfill.
634
Both the municipalities performed ‘medium’ for key component of ‘physical systems integrity’
635
(X6) (refer to Figure 6). Presently, the municipalities are following international standards for
636
ensuring workers health and safety and control measures to protect natural environment to a certain
637
degree. Operations managers are depending on corrective maintenance strategies with reasonable
638
effectiveness. However, the municipalities need to implement asset management strategies and
639
sustainable practices based on detailed LCC and LCA studies which have yet to be performed.
640
The key component ‘economic and financial viability’ (X7) of the Municipality B lies in ‘high’
641
performance zone. The reasons for such performance is ‘low disposal cost per metric ton of municipal
642
waste’ (X7,0,2) primarily due to low cost manual operations in comparison to MRF at the Municipality
643
A.
644
4. Discussion
645
The results of PAM-SWM hold dual application for performance management of MSWM
646
systems. The first application is inter-municipality performance benchmarking where the calculated
647
PIs can be compared amongst different participating municipalities at regional or national scale.
648
Performance of overall key components can also be shared for cross-municipality comparison having
649
a consensus on the concept, used in FRBM, that all the PIs have equal importance. In the second
650
application, the municipality managers can correlate the hierarchical arrangement shown in Figure 2
651
to their organizational structure for intra-municipality performance management.
652
Preprints (www.preprints.org) | NOT PEER-REVIEWED | Posted: 30 January 2019
Preprints (www.preprints.org) | NOT PEER-REVIEWED | Posted: 30 January 2019 doi:10.20944/preprints201901.0303.v1
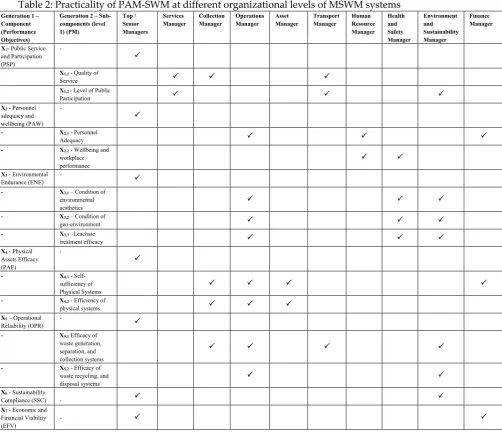
Practicality of PAM-SWM at different organizational levels of MSWM systems is presented in
653
Table 2. It can be observed from table that top/ senior management is interested in the compliance of
654
performance objective at key component level. In case of ‘medium’ or ‘low’ performance results, they
655
can direct the operational managers to hone in the attributes’ performance at the sub-component
656
levels and ultimately identify the lacking PIs at the bottom of hierarchy (also see Figure 1). For
657
example, service manager of Municipality A needs to improve the ‘quality of service’ (X1,1) and ‘level
658
of public participation’ (X1,2), also see Figure 6. Similarly, health and safety manager of Municipality
659
B was able to minimize the ‘number of working accidents’ (X2,2,0,1) in the given assessment period
660
(refer to Figure 7), thus needs to increase number of training hours (X2,2,0,3) to improve the
sub-661
component of ‘wellbeing and workplace performance’ (X2,2). While the manager working at the same
662
position in Municipality A needs to put more focused efforts to reduce X2,2,0,1 as well as ‘number of
663
sick leaves’ (X2,2,0,2) to significantly improve (revise for major revisions) X2,2. Major revisions could be
664
required in case of ‘low’ performance while minor improvements can fix the lacking performance in
665
case of ‘medium’ performance. High performing key components, performance attributes, and PIs
666
need to be maintained. Similarly, other managers can plan improvement actions based on the
667
performance of their corresponding sub-component.
668
For continuous performance improvement (CPI), in addition to appraising the current success,
669
the municipality can further enrich their performance by selecting more resilient technologies to meet
670
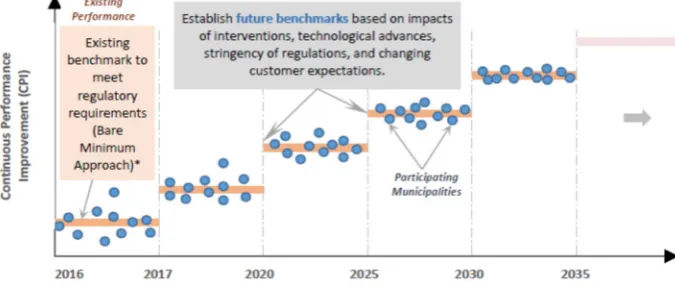
long-term sustainability objectives. The basic principle of CPI, shown in Figure 8, revolves around
671
continuous advancements that can be the result of incremental progression or radical changes
672
brought forth by innovation and/ or technology [56]. Present research advocates towards progression
673
of PAM-SWM integrated with CPI approach.
674
675
676
677
Figure 8: Continuous performance improvement concept for MSWM Systems (modified after
678
Bereskie et al. [56])
679
680
The model results presented in Figure 6 and Figure 7 (for X2 only) should also be used for the
681
CPI process illustrated in Figure 8 for SWMs. Future benchmarks can be established based on: i) the
682
findings of inter-municipality benchmarking process, where all