Article
1
The influence of knowledge and persuasion on the
2
decision to adopt or reject alternative fuel vehicles
3
Amy Campbell 1, Tim Ryley 2,* and Robert Thring 3
4
1 Strategic Consultancy, AECOM, 12 Regan Way, Nottingham. NG9 6RZ. United Kingdom;
5
6
2 Griffith Aviation, School of Engineering & Built Environment, Nathan Campus
7
Griffith University, Queensland, Australia; [email protected]
8
3 Department of Aeronautical and Automotive Engineering, Loughborough University, Leicestershire, LE11
9
3TU, United Kingdom; [email protected]
10
* Correspondence: [email protected]; Tel.: +61 (0)7 3735 5358
11
12
13
Abstract: Alternative fuel vehicles, such as battery electric vehicles and hydrogen fuel cell vehicles,
14
support the imperative to decarbonise the transport sector, but are not yet at a stage in their
15
development where they can successfully compete with conventional fuel vehicles. This paper
16
examines the influence of knowledge and persuasion on the decision to adopt or reject alternative
17
fuel vehicles, underpinned by Rogers’ Diffusion of Innovations theory. A household questionnaire
18
survey was undertaken with respondents in the Sutton Coldfield suburb of the United Kingdom
19
city of Birmingham. This suburb was previously identified as having a strong spatial cluster of
20
potential early adopters of alternative fuel vehicles. The results confirm that among respondents
21
the knowledge of alternative fuel vehicles was limited and perceptions have led to the
22
development of negative attitudes towards them. The reasons largely relate to three problems:
23
purchase price, limited range, and poor infrastructure availability. The majority of respondents
24
have passively rejected alternative fuel vehicles, such that they have never given consideration to
25
adoption. This confirms that a concerted effort is required to inform the general public about
26
alternative fuel vehicles.
27
Keywords: Travel behavior analysis; Cleaner cars; Alternative fuel vehicles; Diffusion of
28
innovations; Adoption; Passive rejection.
29
30
31
32
1. Introduction
33
Alternative fuel vehicles (electric vehicles and hydrogen fuel cell vehicles) have been proposed
34
to reduce the environmental impact of transport and also as a solution to overcome oil dependency.
35
Battery electric vehicles and hydrogen fuel cell vehicles are not yet at a stage in their development
36
where they can successfully compete with conventional fuel vehicles. They face a variety of
37
technological hurdles that include range, performance, cost, and infrastructure.
38
39
40
Uptake of alternative fuel vehicles is occurring at a slower pace than hoped by policy makers
41
and manufacturers, and this is a familiar story globally. In 2012, the time period of the data collection
42
effort reported within this paper, there were 1,500 electric cars sold in the United Kingdom, bringing
43
the total of battery electric car registrations to 4,100 [1] and equating to 0.014% of the total number of
44
vehicles registered. Targets for vehicle numbers have not been set by the United Kingdom, although
45
the Committee on Climate Change made a recommendation of aiming for 1.7 million electric
46
vehicles to be sold in the United Kingdom by 2020 [2]. In September 2013 the cumulative total of
47
electric vehicles (plug-in hybrids and battery electric vehicles) was just over 130,000 vehicles in the
48
United States of America [3], a figure which is below initial targets. One of the most successful
49
countries for alternative fuel vehicle market penetration has been Norway, due to a series of strong
50
incentives for promoting purchase and ownership of Battery Electric Vehicles (BEVs); BEVs had a
51
2% market share of the Norwegian passenger car fleet in 2015 [4].
52
53
The aim of this paper is to examine the influence of knowledge and persuasion on the decision
54
to adopt or reject alternative fuel vehicles, underpinned by Rogers’ Diffusion of Innovations theory.
55
In recognising current attitudes, the paper will conclude with recommendations for developing a
56
more targeted marketing approach that will aid diffusion. Birmingham, the second largest city in the
57
United Kingdom, is used as a case study.
58
59
Initially, Roger’s Diffusion of Innovations theory is presented, before a literature review into the
60
consumer acceptance of alternative fuel vehicles. There is then a description of the data collection
61
effort, a household survey in the Birmingham suburb of Sutton Coldfield, identified as an area with
62
a strong spatial cluster of potential early adopter of alternative fuel vehicles. The analysis covers the
63
factors which influence knowledge and persuasion towards the adoption of an alternative fuel
64
vehicle. In addition to research conclusions, the paper presents some policy recommendations to
65
further increase the uptake of alternative fuel vehicles.
66
67
2. Materials and Methods
68
2.1. Theory of Diffusion of Innovations
69
Alternative fuel vehicles are innovations – they are objects that are perceived as new. It is not
70
unusual for there to be a lengthy time period from when the innovation first becomes available to
71
the point at which it becomes widely adopted [5], but understanding what is influencing the
72
diffusion of alternative fuel vehicles may aid in speeding up the rate of diffusion. In this case it is
73
Rogers’ Theory of Diffusion of Innovations [5] that has been applied to this alternative fuel vehicles’
74
case study, and principally the Innovation-Decision Process model within the theoretical
75
framework. It is the Innovation-Decision Process model that focuses on how an innovation decision
76
is influenced by the perceived newness of the innovation and the associated uncertainty that arises
77
as a consequence [5].
78
79
Figure 1 shows the Innovation-Decision Process involving information seeking and information
80
processing, whereby an individual passes through five stages before adopting or rejecting an
81
innovation [5]: (1) knowledge, (2) persuasion, (3) decision, (4) implementation, and (5) confirmation.
82
‘Knowledge’ and ‘persuasion’ are the two distinct stages that precede the decision. Defined by [5],
83
“knowledge occurs when an individual is exposed to an innovation’s existence and gains an
84
understanding of how it functions” and “persuasion occurs when an individual forms a favourable
85
or unfavourable attitude towards the innovation”. These two constructs of the model are the
86
principal focus of the data analysis within this paper (Sections 3.2 and 3.3), as well as the ‘prior
87
conditions’ that form the setting for the innovation in the first instance.
88
Figure 1. The Innovation-Decision Process [5]
91
92
93
94
Rogers produced adopter categories that form an innovativeness continuum: the earliest to
95
adopt are innovators, followed by early adopters, the early majority, the late majority and finally
96
laggards. This is shown in Figure 2. Innovators are considered to be venturesome risk takers who
97
kick-start the diffusion process of an innovation. Early adopters are the next level of adopter; an
98
adopter who is more integrated in the social system and who, having adopted the innovation, gives
99
the go-ahead to the majority that the innovation is safe to adopt. Identifying the early adopters of
100
alternative fuel vehicles are is of interest to this research in order to recognise how diffusion may be
101
sped up (the second group as shown in Figure 2, suggesting around 13.5% of the general
102
population).
103
104
Figure 2. Normal adoption distribution curve [5]
105
106
107
108
With respect to attitudes and the influence that knowledge and degree of persuasion have, this
109
research paper takes into consideration contextual knowledge and attitudes held by respondents,
110
such as attitudes towards climate change as well as knowledge and degree of persuasion specific to
111
the innovation, in this case alternative fuel vehicles.
112
113
Rogers’ Diffusion of Innovations theory is the most cited of diffusion theories, with first
114
publications appearing in 1963. The theory has continued to be applied to studies for over 50 years,
115
which is likely due to its simplistic and pragmatic applicability across the academic disciplines. In a
116
review of emerging literature between 1990 and 2012, [6] found that there have been 1,024
117
publications that include a reference to Rogers’ theory and between 2008 and 2012 the number of
118
annual publications quadrupled.
119
There are three primary reasons for which the Diffusion of Innovations theory is considered
122
appropriate for this study of alternative fuel vehicles. Firstly, the broad range of applications across a
123
multitude of research disciplines, including eco-innovation diffusion, demonstrates the versatility of
124
the theory. The theory postulates that the characteristics of the technology, the adopter, and the
125
social system are all influential in the adoption decision [5], which makes it a particularly appealing
126
theory in understanding what is impacting alternative fuel vehicle adoption. Other than Englis and
127
[7], there appear to be relatively few studies that have tested the relationship between
128
pro-environmental attitudes and consumer innovativeness using Rogers’ theory. A few studies have
129
explored this relationship in the context of alternative fuel vehicles (e.g. [8]), but research has tended
130
to apply other theoretical approaches such as rational choice theory, the theory of planned
131
behaviour and the value-belief-norm theory [9].
132
133
Secondly, this theory presents a framework with which to consider the reasons for
134
non-adoption of alternative fuel vehicles, which is especially important for marketing purposes in
135
order to reduce the chances of the innovation failing in the market place [10]. Diffusion of electric
136
vehicles is occurring at a relatively slow rate, and it is of interest, both academically and for the
137
purpose of stakeholders involved in new and existing vehicle technologies, to understand consumer
138
acceptance and attitudes, and the reasons for their resistance. The Innovation-Decision Process,
139
therefore, provides a useful framework to identify what is influencing perceptions and attitudes
140
towards alternative fuel vehicles that is stalling their adoption. Non-adoption or rejection is an
141
important part of the diffusion of innovation theory, and a part that often is overlooked in the
142
literature, simply because of the bias towards successful innovations [5].
143
144
Thirdly, most applications of Rogers’ Theory have been undertaken post hoc (having tended to
145
focus only on successful innovations) and Rogers’ suggests there is a need for theoretical
146
contributions that apply the theory at different points in the innovation’s lifetime as a means to
147
understanding more about when an innovation fails or becomes successful in its diffusion. Ideally it
148
would be undertaken as a longitudinal study and followed up over the entire diffusion period of
149
alternative fuel vehicles, however resource constraints prevent that in the case of this research. Few
150
have tested the theory’s versatility of application at a single point in time during the innovation’s
151
diffusion, rather than at the end of the diffusion period. [5] notes that there may be a problem in
152
studying diffusion at a single point in time, rather than as a process, suggesting it will be
153
‘yesterday’s innovativeness. However, with most studies having been undertaken post hoc and
154
therefore reflecting on past innovativeness, it seems there is scope for trying a novel approach to its
155
application, with the potential for it to provide insight into adoption likelihood and so contribute to
156
the understanding of the ‘process’ of alternative fuel vehicle diffusion.
157
158
The analysis in this paper focuses on the ‘early adopters’ i.e. those who adopt an innovation in
159
its early days and who are described by [5] as being innovative in their behaviour. Rogers defines
160
innovativeness as “the degree to which an individual is relatively earlier in adopting new ideas than
161
other members of a (social) system’’ [5] (p. 22). However, [11] criticise Rogers’ definition for failing to
162
offer any real insight into understanding the reasoning prior to the adoption of an innovation and
163
therefore offering no indication as to who might adopt a new innovation prior to its launch. They
164
argue that categorisation of adopters cannot occur until after the diffusion process has taken place.
165
166
A distinction that has been made regarding early adopters is to do with the information source
167
that influences the adoption decision [11]. For example, the adoption decision of some early adopters
168
is influenced by mass media communications, whereas adoption by others is influenced by
169
interpersonal communications, such as word-of-mouth [11]. [12] refers to early adopters as imitators
170
of the innovators. After the innovators, early adopters are the second wave of adopters, and
171
constitute approximately 13.5% of final total of innovation adopters [5].
172
In understanding acceptance of alternative fuel vehicles, the Innovation-Decision Process is of
174
particular interest in this analysis at the point at which an individual undertakes activities that
175
ultimately lead to the adoption or rejection of the innovation [5]. Adoption does not necessarily need
176
to be complete – it may be only partial adoption, such as trialing the innovation before committing to
177
it completely. The alternative to adoption is rejection, which can occur at any of the five stages of the
178
innovation-decision process. Two types of rejection are identified by [5]: active rejection, whereby the
179
individual considers adopting the innovation but then decides not to, and passive rejection, which is
180
where an individual has never considered using the innovation. Passive rejection is also referred to
181
by Rogers as non-adoption.
182
183
2.2 A literature review into the consumer acceptance of alternative fuel vehicles
184
185
This review examines the growing literature into the consumer acceptance of alternative fuel
186
vehicles, with a particular focus on the characteristics of the early adopter group identified by
187
applications of the Theory of the Diffusion of Innovations. For a fuller, wider review on the
188
consumer electric vehicle adoption research, see [9].
189
190
Alternative fuel vehicles have been referred to as ‘eco-innovations’ in recent diffusion literature
191
in this topic area (e.g. [13-15]), due to their ability to contribute to satisfying environmental
192
objectives. The low levels of uptake of electric vehicles are challenged by the difficulties in changing
193
consumer behaviour to adopt more sustainable practices [16-18]. The decision-making process
194
involved in the consideration of pro-environmental innovations is complex [7], making it
195
problematic to identify how consumers can be influenced to adopt alternative fuel vehicles. The
196
decision is likely to be affected by the risk and uncertainty associated with adopting new technology,
197
which concerns financial risk, performance risk, uncertainty of future consequences, image, and the
198
changes to lifestyle that may be required.
199
200
The adoption of an alternative fuel vehicle must not be perceived as requiring sacrifices to be
201
made (e.g. [19]) and must, therefore, have characteristics that will be more highly valued than
202
conventional fuel vehicles, particularly cost-minimisation [20]. Barriers to consumer acceptance tend
203
to be low vehicle awareness, high purchase price, limited vehicle range, poor choice of vehicles,
204
concern about supporting infrastructure, and vehicle safety.
205
206
Following a study of consumer awareness and purchase barriers of vehicle owners in the
207
United States of America, along with interviews with executives from vehicle manufacturers, car
208
dealers and energy companies, [21] pinpointed the characteristics of those most likely to purchase
209
electric vehicles between 2011 and 2020. They identified the profile of early adopters as being young,
210
having a very high household income (in excess of $200,000, equivalent to £120,0001), and already
211
owning more than one vehicle. The early majority, which is those who constitute the early phase of
212
mass adoption, also have a very high household income of around $114,000 (£68,400), are more
213
likely to be male, drive an average of 100 miles per week, and have a garage with power. These
214
people live in urban and suburban locations, perceive electric vehicles to be ‘green and clean’ and
215
they are influenced predominantly by the reliability of the vehicle. According to [21], there is a
216
population of 1.3 million people in the United States of America that fit this profile, with a
217
concentration in California where there is already electric vehicle charging infrastructure to support
218
vehicle use. The study [21] also revealed a predicted profile of ‘non adopters’, constituting those who
219
have low household incomes and are price sensitive. The majority of ‘non adopters’ do not have a
220
garage, creating a challenge for secure home charging. [22] suggest that a lack of charging
221
infrastructure will inhibit market penetration until 2020 at the earliest.
222
223
1
Price is likely to be a major factor in determining who the early adopters of alternative fuel
224
vehicles will be. A survey of 1,000 car owners [23] found that the median car price paid by those who
225
had recently bought a new or nearly-new car was between £11,000 and £15,000 ($18,333-$25,000),
226
which falls significantly below the price of an electric vehicle. The high cost of alternative fuel
227
vehicles was found to be a prohibitive factor for individuals considering plug-in hybrid electric
228
vehicles in research by [24]. They suggest that price premiums need to be significantly reduced to
229
make them commercially viable. Price was also noted as top of purchase criteria in an opinion
230
survey undertaken in Austin, Texas [25]. However, [26] identify income as not being significantly
231
associated with stated intent to purchase a plug-in vehicle.
232
233
[27] undertook a nationwide survey of the United States of America, part of which looked at the
234
demographics of electric vehicle drivers. Variables which increased a respondent’s electric vehicle
235
orientation include: being of a younger or middle-aged age category; having a Bachelor’s or higher
236
degree; expecting higher fuel prices in the next five years; having made a shopping or lifestyle
237
change to help the environment in the last five years; having a place they could install an electric
238
vehicle electrical outlet at home; being likely to buy a small or medium-sized passenger car on next
239
purchase; and having a tendency to buy new products that come on to the market. They note that the
240
number of vehicles per household and the type of residence are important variables in electric
241
vehicle choice. With respect to education, [28] also identified that being highly educated is strongly
242
linked to an individual’s likelihood of having prior knowledge of new vehicle technologies. Being
243
young and well-educated was pin-pointed as an important characteristic by [29] who suggest that
244
such individuals should comprise the target market. Similarly, as education level reduced, the
245
interest in in plug-in vehicles also reduced in a study by [26].
246
247
In the early phase of electric vehicles, [30] suggest targeting three market segments: public
248
sector organisations, eco-conscious companies and multi-car households, constituting an early
249
adopter market of over 2.5%. They argue that multi-car households may offer significant
250
opportunities for electric vehicle sales because the household possesses one or more conventional
251
vehicles that can be used for journeys currently beyond the range of electric vehicles. This research
252
supports the work of [31] who, in their Neighbourhood Electric Vehicle Drive Trials study, found
253
that many households would consider an electric vehicle if they incorporated it into their existing
254
‘household vehicle fleet’, so that there was always an option of an internal combustion engine
255
vehicle for long-range journeys. In a more recent study, [20] found the same attitudes still remain;
256
consumers find the range of current battery electric vehicles too restrictive to have the electric
257
vehicle as the only household vehicle, but rather as a second vehicle that can be used to make short,
258
local journeys. For this reason [29] suggest that marketing strategies should focus on urban
259
consumers.
260
The age characteristics of a hybrid-electric vehicle driver in research undertaken by [32] in
263
collaboration with Toyota, involving a survey of buyers of the Toyota Prius, contrasts with both [21]
264
predicted ‘early adopter’ age profile and the age characteristics identified in a study of electric
265
vehicle drivers by [27]. The majority of Toyota Prius vehicle owners in their survey were men aged
266
50 and over, which was found to be a true representation of Toyota hybrid customers in Great
267
Britain. The survey results also showed household composition of hybrid vehicle owners tends to be
268
retired (couple or single), with a net monthly household income of over £4,000 ($6,667), and owning
269
more than one vehicle. The contrast in findings between [32], [21] and [27] may have been influenced
270
by other factors, such as branding of the Toyota Prius, perhaps leading to it appealing to a slightly
271
older market. Again, there is a contrast in the results of [27] research and that of [32] when it comes
272
to income and car ownership, whereby [27] identify income and owning more than one car as not
273
being significant in increasing electric vehicle orientation. [32] suggest that their survey results may
274
have been affected by the uncertainties associated with the economic climate at the time of the
275
survey (2009), when the respondents’ financial prospects may not have been as good as when they
276
purchased a Toyota Prius in 2007 or 2008.
277
278
With the exception of [33], there has been little research into profiling who the early adopters of
279
hydrogen vehicles are likely to be. [33] conducted a study looking at Californian residents to
280
estimate the early market potential for hydrogen fuel cell vehicles. They identified the consumers
281
most likely to benefit from ‘mobile energy’ innovations, such as vehicle-to-grid technology to create
282
‘mobile electricity’. The authors suggest that consumers will be more likely to make supporting
283
modifications and investments in the required infrastructure if they own their homes and have
284
parking facilities close by. They also recognise the initial price premiums associated with new
285
vehicle and mobile energy technologies, and therefore choose not to consider unemployed
286
households, or households with no income, as target consumers.
287
288
In summary, alternative fuel vehicles have largely been framed in acceptance studies as
289
eco-innovations, focusing on their environmental attributes. There is scope to examine alternative
290
fuel vehicles simply as innovations and the technological attributes should also be a key element.
291
292
Consumer knowledge and awareness of alternative fuel vehicles is recognised as being limited.
293
However, it is likely to evolve as consumers become increasingly aware of climate change and more
294
alternative fuel vehicles become commercially available. On-going research on consumer knowledge
295
and awareness of alternative fuel vehicles is, therefore, necessary. Consumer perceptions and
296
attitudes towards alternative fuel vehicles must be addressed on an on-going basis in the same way
297
as knowledge and awareness. It is possible that perceptions and attitudes will also evolve in time.
298
299
There are limited studies that establish a profile of an early adopter for the purpose of market
300
segmentation. This can be overcome by focusing on individuals who have the early adopter
301
characteristics, as shown in Table 1. The knowledge and perceptions of these individuals towards
302
alternative fuel vehicles are examined in this study to identify what factors are influencing
303
consumers’ adoption of these vehicles.
304
305
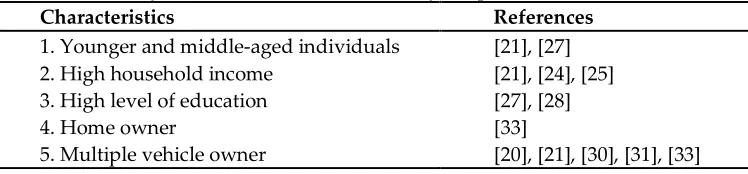
Table 1. Summary of alternative fuel vehicle early adopter characteristics
306
Characteristics References
1. Younger and middle-aged individuals [21], [27]
2. High household income [21], [24], [25]
3. High level of education [27], [28]
4. Home owner [33]
5. Multiple vehicle owner [20], [21], [30], [31], [33]
307
309
2.3 Methodology: Identification of potential early adopters of alternative fuel vehicles
310
This paper builds upon a previous stage of the research that identified the location of potential
311
early adopters of alternative fuel vehicles [34]. Using the city of Birmingham in the United Kingdom
312
as a case study, the socio-demographic characteristics distinguished as being most likely to be
313
present in an early alternative fuel vehicle adopter were applied to Census data. Hierarchical cluster
314
analysis was then used to ascertain the areas of Birmingham that contained the highest proportion of
315
individuals considered most likely to become early adopters of alternative fuel vehicles.
316
317
A strong spatial cluster, constituting 59% of all potential early adopters, that was located across
318
four sub areas (wards) in the suburb of Sutton Coldfield [34], located on the outskirts of the
319
Birmingham Metropolitan area and to the north-east of Birmingham city centre. Sutton Coldfield has
320
the highest levels of employment, the highest percentage of the population with two or more cars
321
and the lowest levels of people living in houses owned by the Local Authority. Within this early
322
adopter cluster were 32,000 households and 85,000 residents (as determined from the 2001 UK
323
Census), equating to nine per cent of the total population of Birmingham Metropolitan District. The
324
proportion of homeowners in the cluster was 94%, with 93% living in detached or semi-detached
325
homes. Over half of the population had two or more cars and 67% of people used their cars for
326
commuting; thirty-nine per cent of people within the output areas were identified as professionals or
327
managers. In contrast, there was a strong spatial cluster of those considered to be ‘unlikely adopters’
328
located in sub areas towards the centre of the city.
329
330
2.4 Survey design and implementation
331
332
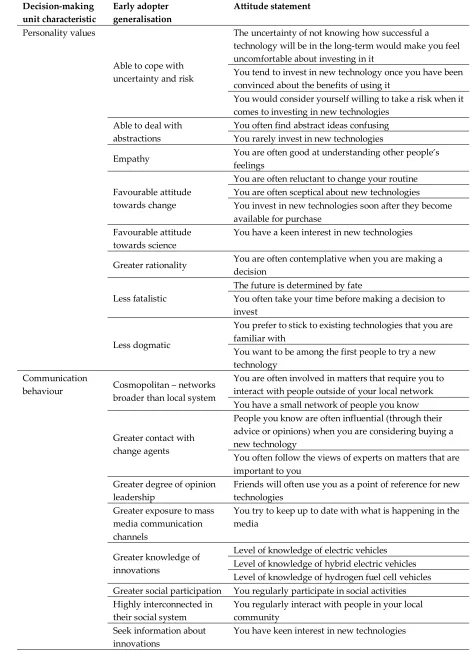
The survey questionnaire was designed according to the Innovation-Decision Process
333
framework, and a series of five-point Likert scale attitudinal statements were incorporated. An
334
example of statements relating to personality values and communication behaviour, in accordance
335
with Rogers’ generalisations, is presented in Table 2.
336
Table 2. An example of questionnaire attitude statements: personality values and communication
339
behaviour
340
341
Decision-making unit characteristic
Early adopter generalisation
Attitude statement
Personality values
Able to cope with uncertainty and risk
The uncertainty of not knowing how successful a technology will be in the long-term would make you feel uncomfortable about investing in it
You tend to invest in new technology once you have been convinced about the benefits of using it
You would consider yourself willing to take a risk when it comes to investing in new technologies
Able to deal with abstractions
You often find abstract ideas confusing You rarely invest in new technologies
Empathy You are often good at understanding other people’s
feelings
Favourable attitude towards change
You are often reluctant to change your routine You are often sceptical about new technologies You invest in new technologies soon after they become available for purchase
Favourable attitude towards science
You have a keen interest in new technologies
Greater rationality You are often contemplative when you are making a decision
Less fatalistic
The future is determined by fate
You often take your time before making a decision to invest
Less dogmatic
You prefer to stick to existing technologies that you are familiar with
You want to be among the first people to try a new technology
Communication
behaviour Cosmopolitan – networks
broader than local system
You are often involved in matters that require you to interact with people outside of your local network You have a small network of people you know
Greater contact with change agents
People you know are often influential (through their advice or opinions) when you are considering buying a new technology
You often follow the views of experts on matters that are important to you
Greater degree of opinion leadership
Friends will often use you as a point of reference for new technologies
Greater exposure to mass media communication channels
You try to keep up to date with what is happening in the media
Greater knowledge of innovations
Level of knowledge of electric vehicles Level of knowledge of hybrid electric vehicles Level of knowledge of hydrogen fuel cell vehicles Greater social participation You regularly participate in social activities Highly interconnected in
their social system
You regularly interact with people in your local community
Seek information about innovations
You have keen interest in new technologies
The survey was undertaken in February and March in 2013, following a pilot survey in
343
December 2012. The households visited were selected from a list of 1,000 addresses (using postcode
344
units) from Sutton Coldfield, identified as being part of the ‘early adopter cluster’. Although guided
345
by a pre-compiled address list, respondents were ultimately selected using two quotas: the house
346
visited must be semi-detached or detached and it must have a driveway. House type was used as a
347
selection criterion in stage one for the reason that a semi-detached or detached house is more likely
348
to have a driveway, which would improve the ability of the household to install an electric-vehicle
349
charging facility (an important factor recognised by [27]). Furthermore, the United Kingdom Census
350
does not collect income data, and with semi-detached and detached homes more often being of a
351
higher value than other home types, this aided the selection of individuals that were therefore likely
352
to have a higher income.
353
354
Two delivery methods were utilised. Face-to-face was the preferred method due to the quality
355
control it allows, while the call-and-collect method was used if the respondent was willing to
356
participate but could not spend the time at the point of contact. In order to achieve a more
357
representative sample, the survey was conducted on weekdays as well as evenings and weekends. It
358
was stipulated that the respondent should be selected on the basis that they would be involved in
359
the household decision-making process when purchasing a new vehicle.
360
361
2.5 Methodology: Analysis of the survey data
362
363
Pearson’s Chi-Square (X2) test and Spearman’s rho (rs) were the two statistical techniques
364
applied to the survey data for testing the effect of socio-demographic characteristics on attitudes.
365
Pearson’s Chi-Square (X2) tests for a dependency between two categorical variables while
366
Spearman’s rho (rs) tests the correlations between continuous or scale data. There are similarities
367
between the tests. Pearson’s correlation coefficient is a product-moment correlation coefficient that is
368
used to indicate the strength of the relationship between the two variables being tested, while
369
Spearman’s rho test first ranks the data before applying Pearson’s correlation coefficient to the
370
ranked scores, indicating the shared variance in the ranked order or the data [35].
371
372
The analysis is focused on validating, where appropriate, the relationship between the
373
socio-demographic characteristics of respondents and the attitudes and perceptions held about
374
alternative fuel vehicles and their contextual environment. In addition to the use of the statistical
375
approaches and descriptive statistics, the research incorporated a qualitative element, through the
376
analysis of two open-format survey questions. Questions to elicit an unprompted response provided
377
the respondent with an opportunity to identify other factors or influences on their attitudes that
378
might not have previously been identified in the research.
379
380
3. Results
381
382
3.1 Summary of the sample
383
384
The survey generated a sample size of 413 households from the Birmingham suburb of Sutton
385
Coldfield. There were 256 (62%) responses completed face-to-face and 157 (38%) using the
386
call-and-collect method.
387
388
The representativeness of the sample in relation to the general population needs to be
389
considered. There is an even split of respondents within the survey according to gender. For age,
390
comparing the representation of the age groups in the survey with those of Sutton Coldfield (from
391
the 2001 Census) it is acknowledged that there is overrepresentation in the older age groups (over
392
64) and underrepresentation in the youngest age group (18-24). Just under half of respondents are in
393
The proportion of survey respondents in employment (just under half) is representative of
395
Sutton Coldfield overall. There is a much higher level of home ownership among respondents,
396
which is 17% higher than for Sutton Coldfield. All homes surveyed were detached or semi-detached,
397
as pre-determined in the survey, which is a proportion that is 27% higher than for Sutton Coldfield.
398
Naturally car ownership among survey respondents is greater than that of Sutton Coldfield, with
399
only 2% of respondents being without a car unlike the 16% of the Sutton Coldfield population, as
400
well as vehicle dependency (91% of those surveyed who work commute by car in comparison to 69%
401
of those in Sutton Coldfield).
402
403
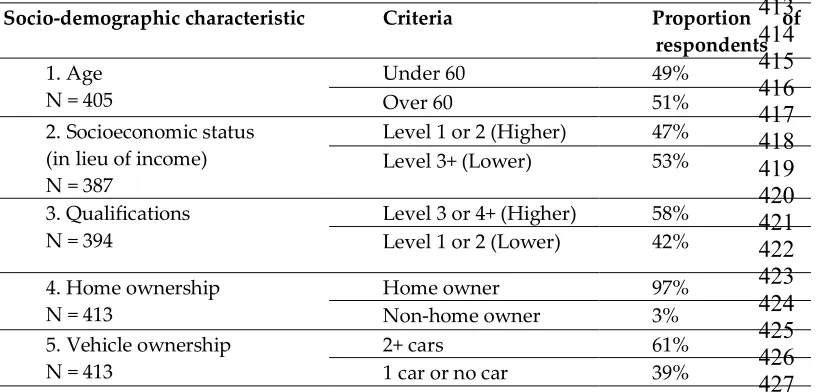
In accordance with the potential early adopter profile from the previous research stage, Table 3
404
shows the proportion of respondents that fit each of the characteristics, aligned with the Table 1
405
categories. The highlighted characteristics are those considered to be important socio-economic
406
characteristics in alternative fuel vehicle adoption. There is a respectable representation among the
407
survey sample fitting the early adopter profile criteria, as shown in Table 3, with 64% of respondents
408
possessing three or more of the socio-demographic characteristics.
409
410
Table 3. Proportion of respondents according to early-adopter profile characteristics
411
412
413
414
415
416
417
418
419
420
421
422
423
424
425
426
427
428
3.2 Knowledge of alternative fuel vehicles and the factors that influence it (Stage I of the Innovation-Decision
429
Process - Figure 1)
430
431
The knowledge characteristics demonstrate that there is a low level of knowledge of alternative
432
fuel vehicles, as perceived by respondents. Across each of the three vehicle types (electric, hydrogen
433
fuel cell and hybrid electric), there are fewer than 16% of respondents who considered that they have
434
a good or very good knowledge of the vehicles (the two highest scores on a five-point scale). There is
435
very little difference in the proportion of those with good or very good knowledge between hybrid
436
vehicles (15%) and electric vehicles (14%). This is rather surprising, considering that hybrid vehicles
437
have been available for purchase over a longer period of time. Hydrogen fuel cell vehicles are even
438
less well understood by respondents; 8% of respondents have good or very good knowledge of these
439
vehicles.
440
441
442
Socio-demographic characteristic Criteria Proportion of
respondents 1. Age
N = 405
Under 60 49%
Over 60 51%
2. Socioeconomic status (in lieu of income) N = 387
Level 1 or 2 (Higher) 47%
Level 3+ (Lower) 53%
3. Qualifications N = 394
Level 3 or 4+ (Higher) 58% Level 1 or 2 (Lower) 42%
4. Home ownership N = 413
Home owner 97%
Non-home owner 3%
5. Vehicle ownership N = 413
2+ cars 61%
3.2.1 Socio-demographic characteristics of responses (socioeconomic characteristics)
443
444
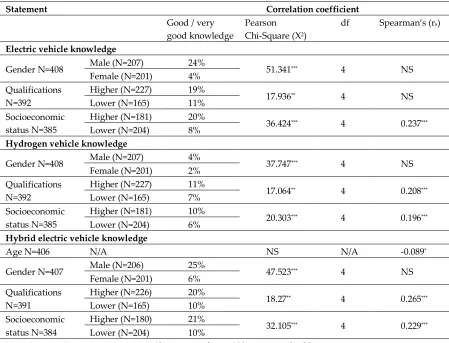
As shown in Table 4, there are significant relationships between the socio-demographic
445
characteristics of the decision-making unit (the first characteristic within Stage I – see Figure 1) and
446
knowledge of alternative fuel vehicles. Male respondents, those with higher level of qualifications,
447
and those with a higher socio-economic status are the most knowledgeable about electric vehicles
448
and contextual factors.
449
450
Table 4. Results for knowledge of alternative fuel vehicles
451
452
Statement Correlation coefficient
Good / very good knowledge
Pearson Chi-Square (X2)
df Spearman’s (rs)
Electric vehicle knowledge
Gender N=408 Male (N=207) 24% 51.341*** 4 NS
Female (N=201) 4%
Qualifications N=392
Higher (N=227) 19%
17.936** 4 NS
Lower (N=165) 11%
Socioeconomic status N=385
Higher (N=181) 20%
36.424*** 4 0.237***
Lower (N=204) 8%
Hydrogen vehicle knowledge
Gender N=408 Male (N=207) 4% 37.747*** 4 NS
Female (N=201) 2%
Qualifications N=392
Higher (N=227) 11%
17.064** 4 0.208***
Lower (N=165) 7%
Socioeconomic status N=385
Higher (N=181) 10%
20.303*** 4 0.196***
Lower (N=204) 6%
Hybrid electric vehicle knowledge
Age N=406 N/A NS N/A -0.089*
Gender N=407 Male (N=206) 25% 47.523*** 4 NS
Female (N=201) 6%
Qualifications N=391
Higher (N=226) 20%
18.27** 4 0.265***
Lower (N=165) 10%
Socioeconomic status N=384
Higher (N=180) 21%
32.105*** 4 0.229***
Lower (N=204) 10%
Note: *p < .05, ** p < .01, *** p < .001. NS = not significant. N/A = not applicable.
453
454
Poor knowledge of electric vehicles is further supported in the open-format responses of the
455
questionnaire. A large proportion of individuals indicated that they did not know of any advantages
456
or obstacles to electric vehicle ownership. There is also poor awareness of the incentives available for
457
their adoption. Some were aware that electric vehicles are exempt from vehicle excise duty but there
458
was little evidence of awareness of other savings that can be made, such as the Plug-In Car Grant2.
459
460
461
2 The Plug-in Car Grant was available since 2011 for vehicles that emitted less than 75g of CO2 per kilometre driven [36]. At
Despite the majority of survey respondents having awareness of the environmental impacts of
462
transport, a relatively high proportion of these individuals stated that they are not concerned about
463
climate change and want to continue with conventional vehicle technology. If such issues are not of
464
concern, then it may be unlikely that such individuals would consider learning about
465
environmentally sustainable innovations like alternative fuel vehicles. Similarly, it is unlikely that
466
they would make behaviour changes to reduce their environmental impact. Many also considered
467
the long-term prospects for electric vehicles to be poor.
468
469
3.2.2 Attitude towards new technologies (personality variables)
470
471
The individual’s attitude towards new technologies is also indicative of their personality, which
472
has been found by [5] to affect individual innovativeness (i.e. how soon an individual will adopt an
473
innovation) e.g. an individual who is able to deal with uncertainty and takes risks is likely to among
474
the earliest adopters of an innovation (‘innovators’ or ‘early adopters’), whereas an individual who
475
is risk averse and sceptical will be among the last adopters of an innovation (‘late majority’ or
476
‘laggards’).
477
478
Table 5. Attitudes towards innovations
479
480
Attitude Statement N Agree strongly
Agree somewhat
Neither agree / disagree
Disagree somewhat
Disagree strongly
Total Agree
Total Disagree
11
You want to be among the first people to try a new technology
406 8% 19% 22% 31% 19% 27% 50%
12
You invest in new technologies soon after they become available for purchase
411 4% 15% 23% 37% 21% 19% 58%
13
You would consider yourself willing to take a risk when it comes to investing in new technologies
409 5% 17% 29% 30% 19% 22% 49%
14
Friends will often use you as a point of reference for new technologies
404 4% 14% 19% 36% 27% 18% 63%
15
You are often sceptical about new
technologies
408 19% 32% 26% 18% 5% 51% 23%
16
The uncertainty of not knowing how successful a
technology will be in the long-term would make you feel uncomfortable about investing in it
411 25% 37% 25% 10% 2% 62% 12%
17
You prefer to stick to existing technologies that you are familiar with
405 17% 33% 27% 20% 4% 50% 24%
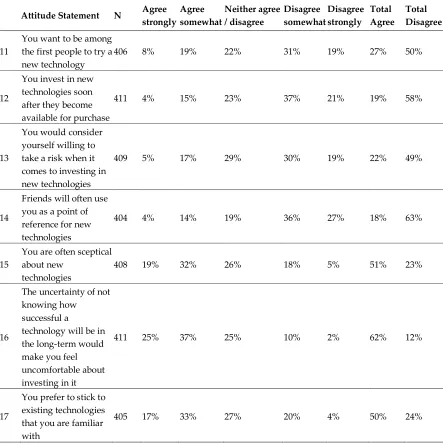
A strongly positive response to Statements 11, 12, 13 and 14 in Table 5 is considered, in this
482
research, to be indicative of an individual who is very innovative, whilst a strongly positive response
483
to Statements 15, 16 and 17 is considered to be indicative of an individual who would likely be a
484
much later adopter, perhaps one of the last to adopt an innovation.
485
486
Attitudes towards new technologies showed that the majority of respondents are risk averse
487
and less likely to among earlier adopters of new technologies. There were 50% who disagreed with
488
the statement “You want to be among the first people to try a new technology”. Uncertainty of its
489
long-term success was considered by 62% of respondents to be a factor that would make them
490
uncomfortable about investing in a new technology. The majority (51%) were also sceptical about
491
new technologies, and half of all respondents stated that they prefer to stick to existing and familiar
492
technologies. These findings are, perhaps, unsurprising given that the majority of adopters of an
493
innovation adopt it later in a product’s lifecycle. In fact, as should be expected, only a small
494
proportion of respondents (4%-8%) were confirmed to be highly innovative when it comes to new
495
technologies. Similarity was recognised between Rogers’ Diffusion of Innovation Curve and the
496
distribution of respondents according to their risk aversion when adopting new technologies.
497
498
Examination of the relationship between personality and socio-demographic characteristics
499
revealed significant correlation between personality statements and gender, age, qualifications and
500
socio-economic status. Those who exhibited greater innovativeness, thus indicating a greater
501
propensity to adopt new technologies, were male, younger (under the age of 60), more highly
502
qualified and had a higher socio-economic status. Despite 27% of respondents stating that they want
503
to be among the first people to adopt a new technology, none of the respondents have adopted an
504
electric vehicle, which may be an indication that not all technologies or innovations can be
505
considered the same. Being among the first to adopt an ‘eco-innovation’ may not be as important as
506
being among the first to adopt a technology of a different sort, perhaps one requiring a lower degree
507
of product involvement (i.e. a lower-cost innovation). This supports an argument made by [13] that
508
an ‘eco-innovation’ is a specific type of innovation and the adoption of which is likely to be
509
influenced by many other determinant that make it difficult to identify a uniform pattern among
510
consumers.
511
512
3.2.3 Communication behaviour of the respondents (knowledge influence)
513
514
[5] make several generalisations about communication behavior, these being that earlier
515
adopters are likely to be more active in seeking information about innovations, they have greater
516
exposure to interpersonal communication channels, greater exposure to mass media communication
517
channels, and have more contact with change agents. The questionnaire statements referred
518
specifically to electric vehicles due to their availability and therefore increased likelihood that some
519
degree of communication may have occurred. Three main influences, media, friends and family,
520
were addressed in this research. However, there was no clear influence when it came to attitudes
521
towards alternative fuel vehicles. The media appears to have a greater influence over interpersonal
522
communication channels, although most respondents stated they neither agreed nor disagreed with
523
statements about what has influenced their attitude. It is unlikely that the respondents had
524
previously been asked to consider their attitudes towards alternative fuel vehicles, and therefore
525
may not yet have formulated an opinion.
526
527
Only 8% of respondents stated they have actively sought information about electric vehicles
528
and a large majority of respondents (80%) indicated they had never had a conversation about electric
529
vehicles. Respondents largely had weak views on alternative fuel vehicles, which is supported by
530
the low levels of knowledge that were shown in Table 4.
531
Table 6. Results for innovativeness in conjunction with communication behaviour
533
534
Statement Correlation coefficient
Agree with statement
Pearson Chi-Square (X2)
Df Spearman's (rs)
18. You have actively looked for information about fully electric vehicles
Gender N=409 Male (N=207) 14% 14.947*** 1 NS
Female (N=202) 3%
19. You have previously had a conversation with someone you know about electric vehicles
Gender N=409 Male (N=207) 27% 11.119** 1 NS
Female (N=202) 13%
20. You often follow the view of experts on matters that are important to you
Qualifications N=391 N/A NS N/A .142**
Socioeconomic status N=384 N/A NS N/A .090*
21. The media has influenced your attitude towards fully electric vehicles
Age N=402 N/A NS N/A -.160**
Qualifications N=391 Higher (N=226) 33% 6.32* 2 .095*
Lower (N=165) 21%
23. Your family has influenced your attitude towards fully electric vehicles
Age N=405 N/A NS N/A -.088*
Note: *p < .05, ** p < .01, *** p < .001, NS = not significant, N/A = not applicable.
535
536
When communication behavior was analysed in conjunction with socio-demographic
537
characteristics, (see Table 6), males were more likely than females to have sourced information on,
538
and also to have previously had a conversation about, electric vehicles. The negative relationship
539
between age and the influence of media and family on attitude towards electric vehicles indicates
540
that the attitudes of younger respondents were more likely to have been affected by these influences.
541
As the level of qualifications increases, so does “follow[ing] the view of experts on matters that are
542
important to you”, and also agreement with the statement “the media has influenced your attitude
543
towards fully electric vehicles”. Apart from socio-economic status, each of the socio-demographic
544
characteristics is significantly correlated with at least two communication behavior variables,
545
suggesting that the communication behaviour of those who are male, are younger, have a higher
546
level of qualifications and a higher socio-economic status is in alignment with those expected to be
547
early adopters.
548
549
3.3 The degree of persuasion towards the adoption of an alternative fuel vehicle and the factors which influence
550
persuasion (Stage II of the Innovation-Decision Process - Figure 1)
551
552
The nature of the data required to capture information about perceptions has led to the
553
inclusion of qualitative analysis, although it also draws on similar techniques to Sections 5.2 and 5.3
554
for examining the relationship between socio-demographic characteristics and perceptions, where
555
applicable.
556
The use of open-format questions concerning the advantages and disadvantages of owning or
558
leasing an electric vehicle provided useful insight into consumer perceptions. The focus was on
559
electric vehicles due to the likelihood that the respondent would be more familiar with this
560
alternative fuel vehicle than a hydrogen vehicle. Several vehicle characteristics are perceived as
561
better for electric vehicles than for conventional vehicles (relative advantage, the first characteristic
562
within Stage II – see Figure 1). These included the ability to refuel at home, fuel economy and
563
environmental impact. Importantly, fuel economy was ranked as one of the most important vehicle
564
characteristics when making a new vehicle purchase. In listing the advantages of ownership of
565
electric vehicles, there was mention of tax exemption as an advantage, but no other Government
566
incentives were mentioned such as the Plug-In Car Grant. It is mentioned by 23 respondents that an
567
advantage of an electric vehicle would be the reduced noise, with some even noting how this would
568
contribute to the relaxation of driving. The noise characteristic could be a useful attribute to focus on
569
in marketing to a segment with a need for a more relaxing driving experience.
570
571
The greatest barriers to the adoption of electric vehicles are technological and include vehicle
572
range, length of charging time, frequency of charging and lack of recharging infrastructure.
573
Economic barriers were mainly related to the cost of the vehicle but also included concerns about the
574
rising costs of electricity and how much it would cost to charge the vehicles. The social obstacles
575
mentioned by respondents emphasised a strong concern for the lack of range of the vehicle and the
576
inability to locate charging stations, a finding that is perhaps akin to ‘range anxiety’.
577
578
A high frequency of responses including ‘no idea’ or ‘not sure’ are indicative of a low level of
579
knowledge of electric vehicles, which further supports the findings in Section 5.2 of poor knowledge
580
of alternative fuel vehicles. A United Kingdom Department for Transport study into attitudes
581
towards electric vehicles also reported that lack of knowledge was a significant factor in deterring
582
drivers from purchasing electric vehicles [37].
583
Figure 2. Vehicle attributes in order of importance (according to frequency)
586
587
588
589
When respondents were asked which specific vehicle attributes they consider most important
590
in the context of making a vehicle purchase (see Figure 2), fuel economy, value for money and fit
591
with lifestyle were the most frequently stated responses. Among the least frequently selected
592
attributes, were vehicle image, resale value, environmental impact, and time to refuel.
593
594
There appears to be a distinct barrier to adoption when it comes to compatibility (the second
595
characteristic within Stage II), with few of the respondents considering an electric vehicle as
596
compatible with their lifestyle. Only 20% of respondents indicated that they would not have to make
597
changes to their lifestyle to accommodate an electric vehicle. ‘Fit with lifestyle’ was also ranked as
598
one of the most important characteristics considered in a new vehicle purchase, inferring that
599
compatibility is of great importance in satisfying consumer needs. This supports the value of this
600
perception in influencing the degree of persuasion towards an innovation [5].
601
602
An opportunity for compatibility is established when respondents were asked to consider the
603
possibility of having an electric vehicle as a second household vehicle. It was noted by [31] that an
604
electric vehicle was more likely to be considered if it was incorporated into the existing household
605
fleet, such that a conventional vehicle is always available for long-range journeys. A relatively large
606
proportion of the sample (just under 40%) recognised this as a possibility, which indicates that
607
compatibility of these vehicles may increase if they are marketed as ‘run-around’ vehicles. Likewise,
608
[20] found that an electric vehicle was considered better suited as a second vehicle for short, local
609
journeys.
610
Table 7. Results for perceived compatibility of the innovation
613
614
Statement Correlation coefficient
Agree with statement
Pearson’s Chi-Square (X2)
df Spearman’s (rs)
Statement 2. An electric vehicle may be suitable as an additional vehicle in your household
Gender N=397
Male
(N=202) 42%
10.144* 1 NS
Female
(N=195) 31%
Age N=392
25-59
(N=189) 41%
15.468** 1 -.199***
60+
(N=203) 33%
Qualifications N=396 NS N/A .204***
Socioeconomic status N=374 NS N/A .142**
Note: *p < .05, ** p < .01, *** p < .001 NS = not significant. N/A = not applicable.
615
616
Significant correlation (Table 7) between perceived suitability of an electric vehicle as an
617
additional household vehicle (Statement 2) with gender, age, qualifications and socio-economic
618
status, whereby those who are male, under the age of 60, have higher level qualifications and a
619
higher socio-economic status were more likely to consider an electric vehicle as suitable for this
620
purpose.
621
622
The associated complexity of use (the third characteristic within Stage II) with alternative fuel
623
vehicles is not well evidenced in the literature. Survey results show that perceived confidence when
624
driving and recharging an electric vehicle does not appear to be problematic to most respondents. In
625
both cases over half of respondents stated that they would be very confident that they would know
626
how to drive and recharge an electric vehicle. Approximately a fifth of all respondents state that they
627
would not be confident with knowing how to undertake these activities.
628
Table 8. Results for perceived complexity of the innovation
631
632
Statement Correlation coefficient
Agree with statement
Pearson's Chi-Square (X2 )
df Spearman's (rs)
Statement 3.You are confident you would know how to drive an EV
Gender N=388 Male (N=197) 73% 35.223*** 4 NS
Female (N=191) 47%
Age N=383 25-59 (N=185) 64% 15.761** 4 -.180***
60+ (N=198) 56%
Qualifications N=372 Higher (N=217) 68% 12.103* 4 .207***
Lower (N=155) 50%
Socioeconomic status N=365 Higher (N=172) 72% 22.313*** 4 .204***
Lower (N=193) 49%
4. You are confident you would know how to recharge an EV
Gender N=389 Male (N=198) 66% 37.812*** 4 NS
Female (N=191) 36%
Age N=384 25-59 (N=185) 56% 11.41* 4 -.175***
60+ (N=199) 46%
Qualifications N=374 Higher (N=219) 59% 14.109** 4 .192***
Lower (N=155) 40%
Socioeconomic status N=366 Higher (N=172) 63% 21.516*** 4 .167***
Lower (N=194) 41%
Note: *p < .05, ** p < .01, *** p < .001 NS = not significant. N/A = not applicable.
633
634
As shown in Table 8, those who state lower levels of confidence are females, those who are from
635
an older age group (>60), those with lower level qualifications and those of a lower socio-economic
636
status. Confidence is found to reduce as age increases. In the open-format question, several
637
individuals remark that they are too old to learn how to use an alternative fuel vehicle, which also
638
reinforces the need to target a younger audience.
639
640
Relatively few respondents have had exposure to alternative fuel vehicles (trialability, the
641
fourth characteristic within Stage II). Only 6% have previously travelled in an electric vehicle, while
642
13% have travelled in a hybrid vehicle. Only 11 of the respondents have actually test driven an
643
electric vehicle, and of the 25 individuals who have travelled in an electric vehicle, only 6 of these
644
have test driven one. [5] found that being able to trial an innovation played a significant role in its
645
adoption and, in the case of hydrogen vehicles [38] confirmed that direct contact with the vehicles
646
had a positive influence on acceptance.
647
648
It is interesting then that only 6 out of 25 individuals who have travelled in an electric vehicle
649
have also test driven one, perhaps suggesting that the initial exposure was sufficient in influencing
650
the decision of the majority that an electric vehicle is not suitable for them.
651
Less than 5% of respondents know somebody who uses an electric vehicle and only 10% had
654
seen an electric vehicle being used (observability, the fifth characteristic within Stage II). The latter
655
may be affected by an inability to recognise an electric vehicle but may also be affected by the
656
inability to distinguish between an all-electric vehicle and a hybrid vehicle. Considerably more
657
males than females have seen somebody using an electric vehicle, an incidence that may be
658
influenced by males having expressed a greater interest than females in electric vehicles and
659
therefore are more likely to recognise one. Charging points in Birmingham and Sutton Coldfield
660
have been seen by just over 10% of people. Public charging points in this area were limited at the
661
time of survey, which will certainly have influenced the likelihood of respondents having seen any.
662
However, there are a number of limited access points (i.e. not public charging points) that may have
663
been observed by respondents.
664
665
The visibility of electric vehicles is likely to be one of the current major barriers to their adoption
666
and affecting perceptions of these vehicles. Without being able to observe their use by others in
667
society sends messages of uncertainty about whether or not to adopt them. Equally, observing that
668
there is supporting infrastructure for electric vehicle recharging will be important in reducing
669
uncertainty, as is recommended by [39]. The more charging infrastructure that is visible to the
670
public, the less uncertainty there will be associated with running out of power (i.e. range anxiety)
671
and not having anywhere to recharge the vehicle’s battery.
672
673
4. Discussion and conclusions
674
675
The research presented in this paper demonstrates that Rogers’ Diffusion of Innovations theory
676
provides a useful framework in the examination of decision-making for adoption or rejection of
677
alternative fuel vehicles. There are some interesting insights that emerge from the analysis of the
678
survey data of potential early adopter Sutton Coldfield residents. A sample size of 413 respondents
679
enabled the analysis to focus on subsamples based on socioeconomic variables, although it is
680
acknowledged that there is an over-representation of older respondents within the survey dataset.
681
682
The large proportion of respondents who have not given consideration to an electric vehicle
683
confirms that these individuals are passively rejecting electric vehicles. The confirmed low levels of
684
knowledge about electric vehicles are likely to be responsible for the low level of consideration given
685
to the purchase of an electric vehicle (passive rejection). Equally, the largely poor perceptions of
686
electric vehicles in addition to their technological inferiority (relative to conventional vehicles) is
687
creating substantial barriers for consumers and leading to active rejection. Therefore, major barriers
688
need to be overcome in order to enhance perceptions of electric vehicles that will lead to faster
689
diffusion.
690
691
The findings, therefore, confirm that there is misalignment between consumers’ vehicle (and
692
use) preferences and the characteristics offered by alternative fuel vehicles, which leads to their
693
non-adoption. However, some of this misalignment is shaped by misperceptions and a lack of
694
information rather than incompatibility. While previous research focused on purchase intentions
695
with respect to alternative fuel vehicles, this research considered choices that have already been
696
made with respect to current household vehicle characteristics, in addition to the preferences for a
697
future alternative vehicle purchase.
698
An important contribution has been made through the application of Rogers’ theory to an
701
‘eco-innovation’. There are few applications of Rogers’ theory for such innovations, particularly in
702
the case of the Innovation-Decision Process being applied holistically. Through the incorporation of
703
need-recognition and broader context-knowledge related attributes, innovation-specific concerns
704
were overcome and the theory was successful in identifying those who are most likely to consider an
705
alternative fuel vehicle, such that five of the most innovative respondents indicated that their next
706
household vehicle purchase will be an alternative fuel vehicle.
707
708
A further contribution overcomes the gap in contributions to Rogers’ theory with regard to the
709
rejection of innovations and, in particular, whether the rejection is active or passive. Findings have
710
highlighted how it is largely passive rejection that is inhibiting the diffusion of alternative fuel
711
vehicles. Low levels of knowledge and understanding of alternative fuel vehicles were found to
![Figure 2. Normal adoption distribution curve [5]](https://thumb-us.123doks.com/thumbv2/123dok_us/1023638.1602441/3.595.82.482.100.285/figure-normal-adoption-distribution-curve.webp)