Syngnathids in the East Coast Trawl
Fishery: a review and trawl survey
No
vember 2005
Queensland
the Smart State
Information Series ISSN 0727-6273
Fisheries
Long Term
Natalie Dodt
No
vember 2005
Fisheries
Long Term
Monitoring Program
Department of Primary Industries and Fisheries Queensland
ISSN 0727-6273 QI05091
This document may be cited as:
Dodt, N. (2005). ‘Fisheries Long Term Monitoring Program: Syngnathids in the East Coast Trawl Fishery: a review and trawl survey’. Department of Primary Industries and Fisheries, Queensland.
Acknowledgments:
Thanks are due to the commercial fishermen John and Gavin McIlwain for their willingness to undertake the survey work. I would like to acknowledge the Long Term Monitoring Program team members and fisheries observers for collecting the samples at sea and processing them in the laboratory. I am grateful to Malcolm Dunning, Eddie Jebreen and Olivia Whybird, all of whom reviewed previous versions of this report.
Thanks also to the Assessment and Monitoring staff, especially Len Olyott for help with data retrievals, mapping and database design. I am very grateful to David Mayer for his assistance and advice with the data analysis. I would also like to acknowledge Jeff Johnson from the Queensland Museum for his assistance in identification of syngnathids.
Particular thanks must go to Jonathan Staunton Smith for his support and assistance in every facet of this project.
General disclaimer:
This publication has been prepared with care. DPI&F:
(a) takes no responsibility for any errors, omissions or inaccuracies contained in this publication;
(b) does not warrant that the information contained in this publication is current or that there is not more recent or more relevant information available;
(c) does not accept any liability for any decisions or actions taken on the basis of this publication; and (d) does not accept any liability for any loss or damage suffered directly or indirectly from the use of the
information contained in this publication.
© The State of Queensland, Department of Primary Industries and Fisheries 2005
Copyright protects this publication. Except for purposes permitted by the Copyright Act 1968, reproduction by whatever means is prohibited without prior written permission of the Department of Primary Industries and Fisheries, Queensland. Inquiries should be addressed to:
Manager, DPI&F Publications
Department of Primary Industries and Fisheries GPO Box 46
Contents
Figures iv
Tables v
Acronyms vi
Summary vii
LTMP Background 1
Introduction 2
Objectives 2
Background 4
Queensland Fisheries 4 Queensland East Coast Trawl Fishery 4 Marine Aquarium Fish Fishery 5 Export and trade of syngnathids 5 Biology and ecology of syngnathids 6
Methodology 8
Survey design 8
Field survey protocols 11 Laboratory protocols 14
Data analysis 12
Results 13
Syngnathid distribution and abundance 13 Basic biological information 17 Comparison of commercial catch data (CFISH) and survey data 18
Discussion 20
Syngnathid distribution and abundance 20 Basic biological information 21 Survey limitations 22
Conclusions and recommendations 23
References 24
Appendix 1–The species on the International Union for
Conservation of Nature and Natural Resources (IUCN) Red List 26
Appendix 2–A combined annual estimate of the retained syngnathids as reported in CFISH (1 January 2000 to 31 December 2004) for the
East Coast Trawl Fishery and Marine Aquarium Fish Fishery (CFISH February 2005) 27 Appendix 3–The Department of the Environment and Heritage’s declaration
of an Approved Wildlife Trade Operation for Syngnathids 28
Figures
Figure 1. Historical catch (numbers) data for syngnathids along the Queensland coast (2000–2004) (CFISH database February 2005) 3
Figure 2. The defined sampling area with the historical data for each six minute by six minute grid showing the trawl effort (average boat days per year) (2002–2004) and syngnathid catch per unit effort (CPUE) (number of syngnathids caught per
10 boat days) (2000–2004) (CFISH February 2005). 9
Figure 3. The location of the survey shots (mid-point of trawl) and the stratified grids sampled for the syngnathid survey (April–May 2005). HH = high trawl effort, high syngnathid CPUE, HL = high trawl effort, low syngnathid CPUE, HZ = high trawl effort, zero syngnathid CPUE, LH = low trawl effort, high syngnathid CPUE, LL = low trawl effort, low syngnathid CPUE, LZ = low trawl effort, zero syngnathid CPUE (CFISH February 2005). 10
Figure 4. The distribution and abundance of syngnathids within the areas trawled in the survey (April–May 2005). 14
Figure 5. The distribution and abundance of Solegnathus dunckeri and Solegnathus
hardwickii within the areas trawled in the survey (April–May 2005). 15
Figure 6. Frequency of Solegnathus spp. and Hippocampus spp. in 5 m depth classes (April–May 2005). The number of trawls in each depth class is shown above the bars. 16
Figure 7. The size (mm) of Solegnathus spp. as trawl depth (m) increases. 16
Figure 8. The percent of each gender (male, female, unknown) of Solegnathus spp. as size increases. The number of individuals measured in each size class is shown
in the bars. 17
Figure 9. The total length (mm) and weight (g) relationship of male, female and
unknown sex Solegnathus spp. 18
Tables
Table 1. Summary table indicating the number of syngnathids, trawls and depth range of each stratum for the survey based on trawl effort and reported
syngnathid catch. 13
Table 2. The reproductive status of male syngnathid caught in the trawl survey
Acronyms
BRD Bycatch Reduction Device
CFISH Commercial Fisheries Information System, DPI&F
CITES Convention on International Trade in Endangered Species CPUE Catch Per Unit Effort
DEH Department of the Environment and Heritage
DPI&F Department of Primary Industries and Fisheries, Queensland ECOTF East Coast Otter Trawl Fishery
ECTF East Coast Trawl Fishery EKP Eastern King Prawn
EPBC Environment Protection and Biodiversity Conservation
IUCN International Union for Conservation of Nature and Natural Resources LTMP Long Term Monitoring Program, DPI&F
Summary
The Department of Primary Industries and Fisheries (DPI&F), Queensland, manages the state’s fish, mollusc and crustacean species and the habitats in which they live. Inherent in this responsibility is a commitment to monitor the condition of, and trends in, fish populations and their associated habitats. This information is used to assess the effectiveness of fisheries management strategies and contributes to ensuring that the fisheries remain ecologically sustainable.
The family Syngnathidae (seahorses, seadragons, pipefish and pipehorses) are harvested incidentally in the Queensland East Coast Trawl Fishery (ECTF) and as a target species in the Marine Aquarium Fish Fishery (MAFF), due to their value as curios, aquarium fish and traditional Asian medicines (Dunning et al., 2001; Vincent, 1996). There is very little information available on the biology or ecology of syngnathid species and as such many are listed as a worldwide conservation concern.
The objectives of this project were to carry out a fishery-independent trawl survey to: • improve our understanding of the distribution and abundance of syngnathids in
shallow water eastern king prawn (EKP) trawl grounds
• collect basic biological information on the syngnathid species within the shallow water EKP trawl grounds
• compare the patterns of syngnathid distribution and abundance using the fishery-independent data collected from the trawl survey to the patterns using fishery-dependent commercial logbook data from the Commerical Fisheries Information System (CFISH) • investigate the relationship between syngnathid distribution and abundance, and
assemblages and habitat characteristics.
During this fishery-independent assessment, 87 trawl shots were undertaken over a 10 night stratified survey in the shallow water EKP trawl grounds. Information was collected on the syngnathids and the entire community composition collected from the trawls. The information collected was statistically compared against the current syngnathid monitoring information.
Over 90% of the total syngnathid catch comprised of pipehorses, S. dunckeri and
S. hardwickii. In addition, there were two species of seahorse and one pipefish collected in the survey area. The highest density of all syngnathids was collected in the ‘low effort, zero reported catch’ grid east of Noosa. The shallowest depth where pipehorses were caught in the survey area was 50 m, however no trawls were conducted deeper than 85 m and therefore no maximum depth limit was indicated.
There was little correlation in terms of syngnathid abundance between the information gathered from the survey and the daily commercial fishery logbook data used to currently monitor syngnathids. This result indicates that the logbook data alone is not an accurate or comprehensive monitoring tool for fine scale areas of syngnathid distribution and abundance along the Queensland coast. The survey showed that the highest mean abundance of syngnathids occurs in the low trawl effort grids, signifying that syngnathids either prefer habitats not targeted by trawlers or that syngnathid populations in high effort trawl grounds have been reduced due to fishing mortality. Further investigation is required on the biology and preferred habitat of syngnathids to further support either of these potential causal mechanisms.
LTMP Background
The Department of Primary Industries and Fisheries (DPI&F), Queensland, manages the State’s fish, mollusc and crustacean species and their habitats. As part of this commitment, DPI&F monitors the condition of, and trends in, fish populations and their associated habitats. This information is used to assess the effectiveness of fisheries management strategies and helps ensure that the fisheries remain ecologically
sustainable. DPI&F also uses the information to demonstrate that Queensland’s fisheries continue to comply with national sustainability guidelines, so that they may remain exempt from export restrictions under the Australian Government’s Environment Protection and Biodiversity Conservation Act 1999.
DPI&F initiated a statewide Long Term Monitoring Program (LTMP) in 1999, in response to a need to collect enhanced data for the assessment of Queensland’s fisheries resources. The LTMP is managed centrally by a steering committee with operational aspects of the program managed regionally from the Southern and Northern Fisheries Centres located at Deception Bay and Cairns respectively. The regional teams are responsible for organising and undertaking the collection of data to be used for monitoring key
commercial and recreational species, and for preparing data summaries and preliminary resource assessments.
A series of stock assessment workshops in 1998 identified the species to include in the LTMP. The workshops used several criteria to evaluate suitability including:
• the need for stock assessment based on fishery-independent data • the suitability of existing datasets
• the existence of agreed indicators of resource status • the practical capacity to collect suitable data.
Species currently monitored in the LTMP include saucer scallops, spanner crabs, stout whiting, mullet and tailor in southern Queensland, and tiger prawns and reef fish in northern Queensland. Species with statewide monitoring programs include mud crabs, barramundi, spotted and Spanish mackerel and freshwater fish. Various sampling methodologies are used to study each species. The incorporation of fishery-independent techniques is preferred, with combinations of fishery-dependent and independent techniques being used where appropriate. Data collected in the monitoring program are maintained in a central database in Brisbane.
The primary aim of the LTMP is to collect data for resource assessment (ranging from analyses of trends in stock abundance indices to more complex, quantitative stock assessments) and management strategy evaluations. The greatest value of the growing datasets for each of the species and associated habitats is in the long time series generated by continued sampling, something that is usually required for accurate assessments but is rarely available.
Stock assessment models have already been developed for saucer scallops, spanner crabs, stout whiting, mullet, tailor, barramundi, tiger and endeavour prawns, and spotted and Spanish mackerel. In some cases management strategy evaluations have also been carried out. The data collected in the LTMP have been integral to these activities. The assessments and evaluations have, in turn, allowed options for improvements to the management of Queensland’s fisheries resources to be considered. Enhancements to ongoing monitoring have also been identified, particularly to address the increasing demand for high quality data for dynamic fish population models.
Introduction
The family Syngnathidae (seahorses, seadragons, pipefish and pipehorses) creates much interest throughout the world due to their value as curios, aquarium fish and as an ingredient in traditional Asian medicines (Dunning et al., 2001; Vincent, 1996). It is for these trades that syngnathids are harvested in the Queensland ECTF and MAFF. The high demand for syngnathids in the traditional Chinese medicine trade has lead to increased fishing pressure and population declines in some areas of the world (Pogonoski
et al., 2002; Vincent, 1996). While Australian waters contain approximately half of the world’s syngnathid species (Vincent, 1996), there is currently little quantitative evidence of any serious population declines (Pogonoski et al., 2002). However, there is the potential risk that if stocks are depleted in other south-east Asian regions the traditional Chinese medicine trade could focus on Australian species, raising further conservation interest for these syngnathids (Pogonoski et al., 2002).
Objectives
This study was initiated to address requirements of the Commonwealth Department of the Environment and Heritage’s (DEH) declaration of an approved Wildlife Trade Operation (WTO) for syngnathids (Appendix 3). The study was specifically concerned with condition 7 of the declaration, which requires DPI&F to design and implement fishery-independent surveys of bycatch in the ECTF in order to improve understanding of syngnathids and their preferred habitats.
To fulfil condition 7 of the WTO declaration it was necessary to carry out research specifically targeting syngnathids. The objectives of this project were to carry out a fishery-independent trawl survey to:
• improve our understanding of the distribution and abundance of syngnathids in shallow water EKP trawl grounds
• collect basic biological information on the syngnathid species within the shallow water EKP trawl grounds
• compare the patterns of syngnathid distribution and abundance using the independent data collected from the trawl survey to the patterns using fishery-dependent commercial logbook data from CFISH
• investigate the relationship between syngnathid distribution and abundance and assemblages and habitat characteristics.
Figure 1. Historical catch (numbers) data for syngnathids along the Queensland coast (2000–2004) (CFISH database February 2005)
This study evaluated the current knowledge of syngnathids within the ECTF. By reviewing the available information it is evident that there is a distinct lack of knowledge about the family and the role it plays in the ECTF. Very little is known of the biology and ecology of syngnathids, their population dynamics and how their populations are potentially affected by the fishery. Surveys such as the one reported in this study provide new information to assist in the sustainable management of syngnathids within Queensland fisheries.
Queensland
NOOSA MACKAY
CAIRNS COOKTOWN
BRISBANE SOUTHPORT GLADSTONE
BUNDABERG TOWNSVILLE
MOOLOOLABA
142°0’0"E 144°0’0"E 146°0’0"E 148°0’0"E 150°0’0"E 152°0’0"E 154°0’0"E 28°0’0"S 26°0’0"S 24°0’0"S 22°0’0"S 20°0’0"S 18°0’0"S 16°0’0"S 14°0’0"S 12°0’0"S 10°0’0"S
0 75 150 300
Nautical Miles
Legend
Syngnathids (2000-2004) (catch numbers)
0 - 27
28 - 98
99 - 250
251 - 560
Background
Queensland fisheries
All syngnathid species in Australian waters are protected by Commonwealth legislation under the Environment Protection and Biodiversity Conservation Act 1999, where they are listed marine species. It is an offence to take, trade, keep, move, injure or kill a listed marine species without a permit issued by the Commonwealth Minister for the Environment and Heritage. In Queensland, syngnathids are currently permitted to be harvested and exported from both the ECTF and the MAFF. Both of these fisheries are managed by DPI&F under the Queensland Fisheries Act 1994 and its subordinate legislation the Fisheries Regulation 1995 and the Fisheries (East Coast Trawl) Management Plan 1999.
In order for Queensland fisheries to export syngnathids from Australia, each fishery must undergo an assessment under the EPBC Act 1999 to ensure that it is being managed sustainably. These assessments are carried out by the Commonwealth DEH, resulting in one of three outcomes—exempt, WTO or prohibition (DEH website, June 2005,
www.deh.gov.au/coasts/fisheries/index.html). The export of syngnathids in the ECTF has been assessed as a WTO (Appendix 3), whereas the MAFF is currently under assessment by DEH (August 2005).
In Queensland, all commercial fishers record their daily catch of target and other permitted species in fishery-specific logbooks. They are also required to report any species
incidentally collected or interacted with that are listed as species of conservation interest (SOCI) in a separate logbook. The logbook data management system is called CFISH and is managed by DPI&F. The information provided is used to help monitor the status of species and of fisheries along the Queensland coast. The current monitoring of syngnathid catch along the Queensland coast is through CFISH, although there is some variation in the detail of the information recorded on syngnathids between the different Queensland fishery sectors (see www.dpi.qld.gov.au/fishweb/2984.html).
There is currently no routine process in place to validate logbook records of the capture of syngnathids. However, an observer program is being developed by DPI&F which will provide independent validation of the bycatch species (including syngnathids) caught in the trawl fishery (Zeller, 2002). Data collected by the observer program will be used to assess the effectiveness of current management measures aimed at minimising capture of protected species, and for verification of fishery-dependent (logbook) data on protected species, such as syngnathids (McGilvray, 2004).
Queensland East Coast Trawl Fishery
Queensland’s ECTF is the largest fishery within the state (Fishweb, April 2005,
www.dpi.qld.gov.au/fishweb/12545.html). The fishery consists of two sectors—the East Coast Otter Trawl Fishery (ECOTF) and the River and Inshore Beam Trawl Fishery (RIBTF). The ECOTF is the larger of the two sectors, which in 2004 comprised approximately 480 fishing boats and 61 800 boat days of fishing effort (Gaddesand Bibby, 2005), with the remainder of the ECTF fleet made up of approximately 155 beam trawl operators (CFISH, August 2005). Syngnathids are only harvested from the ECOTF, with no reported catch of syngnathids in the RIBTF to date (Stobutzki et al., 2000).
The main target species for the ECOTF are prawns, scallops and stout whiting
(Williams, 2002). Target species vary in their distribution and seasonality and as such most commercial operators in the ECTF travel great distances to target various species along the Queensland coast (Lightowler, 1998; Williams, 2002). Other species that are permitted to be retained as incidental catch, yet are not to be specifically targeted by trawling operations, include Moreton Bay bugs, squid, blue swimmer crabs, red spot crabs, Balmain bugs, barking crayfish, cuttlefish, mantis shrimp, octopuses, pinkies and pipefish1 (Fisheries (East Coast Trawl) Management Plan 1999).
1 ‘pipefish’ used in legislation refers to the two syngnathid species of the pipehorses, S. hardwickii and S. dunckeri. For the
remainder of the document these two species will be referred to as ‘pipehorses’, as this is the accepted common name for
The ECTF is further managed by a range of input and output controls stipulated in the Queensland Fisheries (East Coast Trawl) Management Plan 1999. These input and output controls include management arrangements such as temporal and spatial closures, gear restrictions, excluder devices, compulsory boat and gear upgrades, effort capping, reduction of fishing days, daily catch limit and a yearly total allowable commercial catch for some species.
The ECTF is currently permitted to retain only two species of Syngnathidae, the pipehorses
Solegnathus hardwickii (pallid pipehorse) and Solegnathus dunckeri (Duncker’s pipehorse), with a possession limit of 50 pipehorses in total. The pipehorse catch for the ECTF was not reported as a separate group from other permitted species until 2000 (logbook ‘OT07’) and was further reported as two separate species from 2003 (logbook ‘OT08’) (see Fishweb, April 2005, www.dpi.qld.gov.au/fishweb/2984.html).
Marine Aquarium Fish Fishery
Queensland’s MAFF occurs in tidal waters south of 10°41’ latitude and east of 142°31’49”
longitude (Lightowler, 1998). The fishery consists of both commercial and recreational fishers that collect marine fish species for display in an aquarium. The fishery is allowed to retain a large variety of fish species from a large number of families, however, approximately 50% of the catch comes from three families—damselfish, wrasses and angelfish (Aquarium Fish and Coral Fisheries Working Group, 1999). The Fisheries Regulation 1995 stipulates the range of collection and gear restrictions on the fishery. The MAFF is currently allowed to harvest all species of syngnathid. However, catches are usually restricted by demand and therefore numbers of syngnathids harvested from this fishery are annually very low (Appendix 2). All syngnathids collected by the commercial fishers are recorded in logbooks (logbook ‘AQ03’) under one category, ‘pipefish/seahorses’ (i.e. there is no provision to record individual species) (see: Fishweb, April 2005, www.dpi.qld.gov.au/fishweb/2984.html).
Export and trade of syngnathids
Syngnathids are highly valuable on the Asian market for use in traditional medicines (Martin-Smith et al., 2003). The lack of data on syngnathid species and the increase in the traditional Chinese medicine trade has lead to much debate and concern in recent years. Much of the volume, value, sources and trade routes of syngnathids are poorly understood (Martin-Smith et al., 2003). Syngnathids are a high-value commodity due to the demand exceeding the supply; for example, pipehorses have been reported at approximately $US1500 per kg dry weight (Vincent, 1996).
It is believed that the majority of syngnathid international trade revolves around the traditional medicine market and therefore most trade involves dried animals. Traditional medicines using syngnathids are believed to treat a range of ailments including
respiratory disorders, sexual dysfunctions, general lethargy and pain (Martin-Smith et al,.
Unlike traditional Chinese medicine very few pipehorses are used in the trade for curios and aquarium fish (Vincent, 1996). Seahorses are popular curios because they retain their shape and morphological characteristics well when dried and are relatively easier to collect than other syngnathid species. Although wild seahorses and other syngnathids are caught for aquaria, very few survive long in captivity. This is mainly due to processes involved with capture and transport of the individuals, which leads to further problems such as disease, stress and malnutrition in captivity (Vincent, 1996).
Biology and ecology of syngnathids
There are several documents that discuss the classification of syngnathids—the two most commonly used are Dawson (1985) and Kuiter (2000) (Appendix 4). Both documents state that the family Syngnathidae is characterised by the presence of lobate gills, a pore-like gill opening located above the opercule, the fins are all soft rayed with all species lacking pelvic fins, the head usually posses a tubular snout with a small mouth at the tip, all without the absence of true jaw-teeth and the body is protected by a ring-like arrangement of dermal plates, rather than scales.
Most syngnathids are characterised by sparse distribution, relatively low mobility, low fecundity and lengthy parental care (Vincent, 1996). Syngnathids are essentially found in coastal marine and estuarine environments. They can occur in depths of a few centimetres up to over 400 m for demersal species (Dawson, 1985). There is a large variation in size of syngnathids, ranging between a few centimetres for the pygmy species to around 650 mm for the pipehorses (Kuiter, 2000). It is generally thought that syngnathids visually feed on zooplankton, preying mainly on small crustaceans that are sucked up whole (Kuiter, 2000; Payne et al., 1998; Woods, 2003).
Due to the lack of information available on the status and biology of Australian syngnathid species, many are listed as vulnerable or data deficient on the International Union for Conservation of Nature and Natural Resources (IUCN) Red List (Appendix 1)—with many seahorse species (Hippocampus) also listed in the Convention on International Trade in Endangered Species of Wild Flora and Fauna Appendix II.
The majority of syngnathid research has been focused on characteristic breeding biology of syngnathids (Moreau and Vincent, 2004; Sanchez-Camara and Booth, 2004). It has been widely documented that the males of the syngnathid species exclusively brood and care for the offspring. The female deposits her eggs in a pouch or on a special patch of skin of the male where the sperm is waiting to fertilise the eggs (Kuiter, 2000, 2001). The brood area used by the syngnathid males varies from a fully enclosed pouch in seahorses and some pipefish, a pouch of interlocking skin flaps for most pipefish, and fully exposed eggs attached under the tail for pipehorses and seadragons (Kuiter, 2000; Vincent, 1996; Wilson et al., 2003). The mating system is also varied ranging from monogamy, displayed by most seahorse species and some pipefish, to polygamy, displayed by many pipefish and seadragon species.
To help understand the habitats and species associated with pipehorses, Courtney et al.
(2003) undertook a study aimed at determining associations between pipehorses and other species collected within trawl nets. The study was an exploratory investigation and the conclusions it drew should be utilised with caution. The study utilised data from a fishery-independent DPI&F scallop survey in 2000 and a trawl bycatch survey undertaken in October 2001. The analyses did not show the same species correlations for each survey, yet provided insight into the species with which pipehorses may be associated at various depths.
There is very little known on the biology of the two pipehorse species retained in the ECTF. The little information that is available, such as the known distribution, size and
some brooding information is presented in Dawson (1985), Pogonoski (2002) and
Methodology
Survey designThe trawl survey described here was designed using CFISH data to determine areas of reported syngnathid catch and areas of trawl effort in the shallow water EKP trawl grounds. The Queensland EKP trawl grounds extend south from 22°S (Swains Reefs) to the Queensland and New South Wales border. The majority of the effort in this fishery occurs south of Fraser Island targeting eastern king prawns (Williams, 2002). The survey focused on these grounds in depths less than 50 fathoms (90 m) as these are the depths where syngnathids had most frequently been caught in previous surveys (Connolly et al., 2001; Dunning et al., 2003).
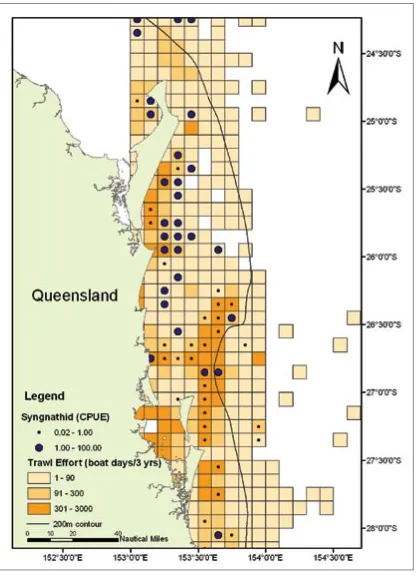
The survey was designed by randomly selecting trawl sites within a stratified sampling area. The historical data reported by commercial fishers (CFISH) at 6 minute by 6 minute grids2 were used to define the strata (Figure 2) (extracted from the CFISH database,
February 2005). Six strata were defined based on the trawl effort (high and low effort) and catch per unit effort (CPUE) of syngnathids (high, low and zero CPUE), as shown below:
• high trawl effort, high syngnathid CPUE • high trawl effort, low syngnathid CPUE • high trawl effort, zero syngnathid CPUE • low trawl effort, high syngnathid CPUE • low trawl effort, low syngnathid CPUE • low trawl effort, zero syngnathid CPUE.
The annual average number of boat days (2002–2004 data)3 in each grid defined as
high trawl effort was >100 boat days and low trawl effort was <30 boat days. The CPUE of syngnathids (2000–2004) in each grid stratified high catch as >1 syngnathid per 10 boat days and low catch as <1 syngnathid per 10 boat days. Zero catch was defined as a grid that had no historical syngnathid reported catch.
2 The commercial trawl fishermen report at a 30 minute by 30 minute grid and a 6 minute by 6 minute site resolution. However, as
there is no reference to 30 minute by 30 minute grids in this document the word ‘grid’ will be used to refer to the 6 minute by 6 minute sites.
3 The effort was based on post 2002 CFISH data because prior to that most of the logbook records were only recorded at the
Figure 2. The defined sampling area with the historical data for each 6 minute by 6 minute grid showing the trawl effort (average boat days per year) (2002–2004) and syngnathid CPUE (number of syngnathids caught per 10 boat days) (2000–2004) (CFISH February 2005).
Modifications to the sample design were made during the survey, due to the difficulty of trawling some predetermined sub-grids. As such there were survey shots conducted along the border of some grids. Additional sub-grids in some grids and additional grids were trawled opportunistically. Figure 3 shows the grids and survey shots inside the selected sub-grids for the entire survey.
Figure 3. The location of the survey shots (mid-point of trawl) and the stratified grids sampled for the syngnathid survey (April–May 2005). HH = high trawl effort, high syngnathid CPUE; HL = high trawl effort, low syngnathid CPUE; HZ = high trawl effort, zero syngnathid CPUE; LH = low trawl effort, high syngnathid CPUE; LL = low trawl effort, low syngnathid CPUE; LZ = low trawl effort, zero syngnathid CPUE (CFISH February 2005).
152°30’0"E 153°0’0"E 153°30’0"E 154°0’0"E
27°30’0"S 27°0’0"S 26°30’0"S 26°0’0"S 25°30’0"S 25°0’0"S
0 10 20 40
Nautical Miles Survey Shots
TREATMENT
HH
HL
HZ
LH
LL
LZ
Legend
200m contour
Field survey protocols
A ten-night survey was undertaken on board a chartered commercial trawler between 26 April and 13 May 2005 in the shallow water EKP trawl grounds. All trawls were undertaken at night (18:00–06:00 hours) with standard commercial prawn gear representative of the shallow water EKP fishery. The configuration of the trawl nets was triple gear (one port, one starboard and one middle net) with 2 inch (51 mm) mesh, 7 fathom (12.8 m) headline length and 1¾ inch (44 mm) cod end mesh. The two outside nets were fitted with turtle excluder devices (TED) and bycatch reduction devices (BRD). The middle net was used to collect a sample of the community composition4 and therefore
did not have any excluder devices fitted.
The trawl shots were approximately 1 nm in the selected sub-grids. Shot details such as depth, latitude, longitude and time were recorded for the start and finish of each shot and the distance trawled recorded at the finish.
When the nets came on board the vessel the middle net, including catch, was weighed using a load cell meter. After spilling the catch, the middle net, without the catch, was weighed again. The middle net was spilled and sorted separately to the outside nets. Once all nets were spilled a photograph of the total catch was taken prior to sorting any of the nets to confirm catch details at a later date. A 10 kg subsample of community composition was collected from the middle net and snap frozen for laboratory analysis. The carton was weighed on the vessel before freezing.
Any large species (sharks, rays, sponges and corals) caught in the middle net that could not be accurately subsampled were identified, photographed and weighed on the vessel. All syngnathids caught in the survey were retained, labelled (shot number and net) and frozen for analysis in the laboratory.
Laboratory protocols
The frozen syngnathid specimens were brought back to the laboratory, where they were defrosted and identified to species. Pipefish and pipehorses were identified using Dawson (1985) and seahorses were identified using Kuiter (2001). When classifying the Solegnathus specimens collected in this survey it became evident that there was a high degree of within species variation in the key characteristic reported by Dawson (1985) for separating Queensland’s S.hardwickii and S. dunckeri. After consultation with the Queensland Museum ichthyologist, a supplementary identification technique was determined, as detailed in Appendix 4.
The wet weight (g), total length (mm), gender and reproductive stage of each specimen were recorded. These measurements were consistent with the techniques used by Kuiter (2001) for seahorses and Connolly (2001) for pipehorses. However, Connolly (2001) measured length with a curled tail, whereas in this survey pipehorse total length was measured, from the tip of the snout to the tip of the tail.
4 Community compositionrefers to all catch (including rubble or sediment, yet excluding syngnathids for this survey) trawled by nets
Data analysis
The distribution and abundance of syngnathids caught within the survey was
displayed by mapping the density (weight (g) per nautical mile) of syngnathids for each sub-grid location.
To search for any depth preference of pipehorses and seahorses the average number was plotted against the depth. To complement this information the size of syngnathids was plotted against depth and a simple linear regression was carried out to test whether there was a relationship between the size of pipehorses and depth trawled.
To test the similarity of patterns of syngnathid abundance between independent and dependent data, general linear modelling (regressions) was performed using Genstat 7 (2003). Data from both sources (CFISH and the survey) were log-transformed to normalise variances and equalise leverage. The mean logged-abundance for each grid was calculated from the survey, and used in the analysis. The CFISH measure of abundance was the total catch of pipehorses for each grid divided by the total trawl effort for the grid using the data between 1 January 2002 and 31 December 2004.
Results
Syngnathid distribution and abundance
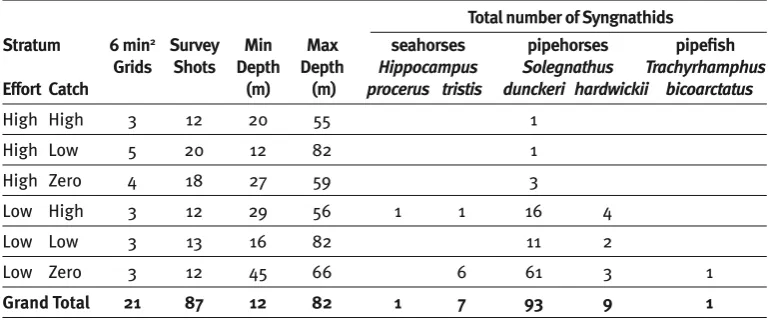
S. dunckeri was the most common syngnathid species caught during the survey and the only species found in every stratum of the survey (Table 1). Most syngnathids (71 in total, which equals 64%) were caught in the ‘low trawl effort, zero reported catch’ stratum. A total of nine
S. hardwickii were caught during the survey, all in low trawl effort strata.
Total number of Syngnathids Stratum 6 min2 Survey Min Max seahorses pipehorses pipefish
Grids Shots Depth Depth Hippocampus Solegnathus Trachyrhamphus
Effort Catch (m) (m) procerus tristis dunckeri hardwickii bicoarctatus
High High 3 12 20 55 1 High Low 5 20 12 82 1 High Zero 4 18 27 59 3
Low High 3 12 29 56 1 1 16 4
Low Low 3 13 16 82 11 2
Low Zero 3 12 45 66 6 61 3 1
Grand Total 21 87 12 82 1 7 93 9 1
Table 1. Summary table indicating the number of syngnathids, trawls and depth range of each stratum for the survey based on trawl effort and reported syngnathid catch.
Figure 4. The distribution and abundance of syngnathids within the areas trawled in the survey (April–May 2005).
Pipehorses were caught in 10 of the 21 grids sampled in the trawl survey. Their distribution was scattered throughout the survey area, with the most northerly catch north-east of Waddy Point, Fraser Island and the most southerly point east of the northern tip of South Stradbroke Island (Figure 4). S. hardwickii was not caught south and east of Noosa, while
S. dunckeri was found from the most northerly grid of the survey to the most southerly grid east of South Stradbroke Island (Figure 5).
152°0’0"E 152°30’0"E 153°0’0"E 153°30’0"E
28°0’0"S 27°30’0"S 27°0’0"S 26°30’0"S 26°0’0"S 25°30’0"S 25°0’0"S
0 10 20 40
Nautical Miles
Queensland
Noosa
Caloundra
Fraser Island Waddy Point
South Stradbroke Island Southport Brisbane
Legend
Survey Shots
CPUE (grams/nautical mile) PIPEHORSE
4 - 50 51 - 100
101 - 500 501 - 1066
SEAHORSE
5 - 50 51 - 100
PIPEFISH
Figure 5. The distribution and abundance of Solegnathus dunckeri and Solegnathus hardwickii
within the areas trawled in the survey (April–May 2005).
Trawls were conducted at depths between 10 m and 84 m but most syngnathids were caught at sites with depths of 60–64 m (Figure 6). Solegnathus spp. were only caught at depths greater than 50 m, however, there were no trawls over 85 m to determine their maximum depth. Hippocampus spp. were caught between 25 m and 65 m, however the
Hippocampus species caught at 25 m was a single H. procerus whereas several H. tristis
were caught between 50 m and 65 m. There was only one pipefish, T. bicoarctatus caught at a depth of 63 m.
0 10 20 40 Nautical Miles
Queensland
Legend
Solegnathus dunckeri (Grams/Nautical Mile)
4 - 50 51 - 100 101 - 500 501 - 1100 Survey Shots
200m contour
0 10 20 40 Nautical Miles
Queensland
Legend
Solegnathus hardwickii (Grams/Nautical Mile)
Survey Shots
Figure 6. Frequency of Solegnathus spp. and Hippocampus spp. in 5 m depth classes (April–May 2005). The number of trawls in each depth class is shown above the bars.
There is a very weak correlation between the size of Solegnathus spp. and depth (P = 0.034). The relationship only explains 3.8% of the variation and is too weak to predict reliable data on the length to depth relationship of Solegnathus spp. The scatter-plot below (Figure 7) shows a full range of lengths across depth.
Hippocampus spp. and the one T. bicoarctatus were not shown on the depth length relationship due to the low number of data points.
Figure 7. The size (mm) of Solegnathus spp. as trawl depth (m) increases.
Frequency
Depth Class (m)
Syngnathid Length (mm)
Basic biological information
Basic biological information was collected from the syngnathids caught in the survey. It was difficult to determine the gender of specimens under 300 mm. For specimens between 300 mm and 399 mm there was a higher percentage of female Solegnathus spp. caught in the survey than males (Figure 8). Only two specimens over 400 mm were caught which were both male (Figure 8).
Figure 8. The percent of each gender (male, female, unknown) of Solegnathus spp. as size increases. The number of individuals measured in each size class is shown in the bars.
Of the S. dunckeri specimens, less than half of the males possessed egg scars (Table 2) and none had eggs or egg membrane still attached. The average number of individually distinguishable egg scars per male was approximately 52. However, some specimens only had visibly distinguishable egg scars over a small section of the tail. The lowest number of egg scars recorded for S. dunckeri was 18 and the maximum was 85.
There was only one specimen of S. hardwickii that possessed visible egg scars (41 in total). There were six male Hippocampus tristis caught during the survey, however, it was difficult to determine the brooding stage by simply viewing the brood pouch. Further internal investigation would be required to determine if there were young within the brood pouch.
No scars Pouch Scars
Species name No. of No. of No. of Average Min no. Max no. animals animals animals no. of scars of scars of scars
Hippocampus tristis 6
Solegnathus dunckeri 11 9 52.2 18 85
Solegnathus hardwickii 3 1 41 41 41
Grand total 14 6 10 51.1 18 85
Table 2. The reproductive status of male syngnathid caught in the trawl survey (April –May 2005).
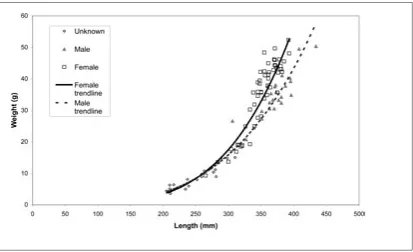
The female, male and unknown Solegnathus spp. specimens have been separated and the length and weights plotted against each other on the scatter-plot below (Figure 9). The female pipehorses were generally heavier than the males of a similar size.
Solegnathus
spp.
Figure 9. The total length (mm) and weight (g) relationship of male, female and unknown sex
Solegnathus spp.
Comparison of commercial catch data (CFISH) and survey data
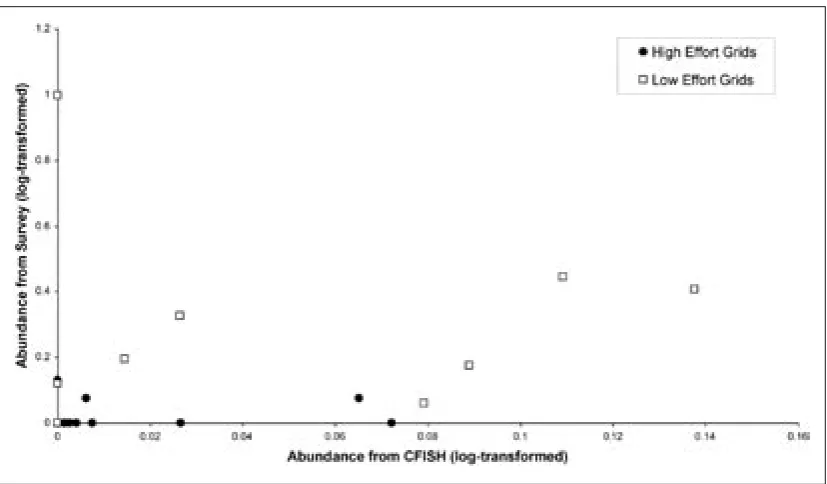
The general linear modelling found that there was no significant relationship between the CPUE of pipehorses from commercial catch data (CFISH) and the survey (P = 0.290, df = 19) (Figure 10).
The highest mean abundance of pipehorses during the survey occurred in a grid with low trawl effort and no reported commercial catches of pipehorses (i.e. low effort, zero catch stratum). The survey pipehorse abundance was consistently and significantly different between high and low trawl effort grids (P = 0.021, df = 18). The mean abundance of pipehorses during the survey was greater in grids with historically low trawl effort (2.72 pipehorses nm-1) compared with those with historically high trawl effort (0.10 pipehorses
nm-1) (Figure 10).
Discussion
Syngnathid distribution and abundance
The survey used commercial prawn trawl equipment in the shallow water EKP trawl grounds to map the distribution and abundance of syngnathid species. The majority (90%) of the syngnathids caught in the survey were Solegnathus spp. Other fishery-independent surveys using prawn trawl gear conducted by DPI&F in other areas of the state have also reported that approximately 85% of the syngnathids caught in trawling operations are Solegnathus
spp. (Courtney et al., 2003). This suggests that the majority of syngnathids caught in prawn trawling operations by commercial fishermen are likely to be Solegnathus spp.
The distribution of pipehorses in the survey supports previously documented information, showing that S. dunckeri’s Queensland distribution extends south from Waddy Point, Fraser Island and S. hardwickii is found as far south as Noosa (Connolly et al., 2001; Pogonoski et al., 2002). S. hardwickii has been previously documented as far south as the Tweed River mouth (28oS) (Dawson, 1985), although it is generally believed to be
more a northern species with its most southerly distribution around Fraser Island (Jeff Johnson, Queensland Museum, pers. comm. May 2005). The survey showed that the more abundant pipehorse species in the shallow water EKP trawl grounds is S. dunckeri. This is supported by Connolly et al. (2001) who found that while there is overlap in the two species’ distribution in the Mooloolaba region, approximately 71% of the specimens they collected from that region were S. dunckeri. However, another fishery-independent survey conducted in October 2001 by Courtney et al. (2003) between Caloundra and Southport, caught 69 S. hardwickii from 15 of the 60 trawled locations as far south as Southport, with most of the individuals caught in the survey shots off the coast of Caloundra. The survey only caught two S. dunckeri from one trawl location off the coast of Caloundra. This difference may be attributable to the seasonal variation of the survey or fine scale spatial differences in distribution. Repetition of the current survey in other areas of the state that are identified as ‘hot-spots’ by historical catch data may increase the current knowledge of pipehorse distribution and abundance in other Queensland trawl grounds.
The distributions of S. hardwickii and S. dunckeri previously documented by various sources (Dawson, 1985; Kuiter, 2000) and supported by the current survey results are inconsistent with the distributions shown by the commercial fishing logbook data. The current logbook data indicate high catches of S. dunckeri as far north as Townsville, whereas the fishery-independent information only records S. dunckeri as far north as Fraser Island. This difference could be due to incorrect identification of the Solegnathus
spp. caught. The current survey supported this possibility by the high degree of difficulty at identifying between the Solegnathus spp. This difference could be addressed by validation of the Solegnathus spp. being commercially caught, or an education program on identification for the trawl fishermen. Another option is to not distinguish between the two species when reporting in the commercial catch logbook and rely on the previously documented distribution from fishery-independent sources to determine which species was mostly likely caught.
This survey indicates that Solegnathus spp. south of Fraser Island (25oS) were most
abundant at depths of 60–64 m, and only found deeper than 50 m. This result differs to a fishery-independent survey conducted in scallop fishing grounds, between 22oS and 25oS
The two species of Hippocampus that were caught in the trawls were collected from distinctly different areas and depths. Kuiter (2001) found that H. procerus is commonly found between Hervey Bay and Moreton Bay in depths around 20 m, whereas H. tristis is common between southern Queensland waters to northern New South Wales in depths between 18–53 m. The results from the current survey support these earlier observations by Kuiter (2001).
There was no significant relationship between the abundance of pipehorses in the grids surveyed and commercial pipehorse CPUE for the same grids from logbook data.
The lack of a significant relationship may be attributed to the recording of the commercial pipehorse catch. Pipehorses may not always be kept and recorded and therefore logbook records may not be truly indicative of catch (retained plus discarded). Another possibility is the measure used for effort (boat days) in the analyses may not be appropriate for non-target species such as pipehorses. This is because the number of days a boat fishes is a better indication of the effort it is directing towards target species.
Another reason for the lack of relationship may be due to different habitats surveyed because of small-scale differences in the areas trawled in each grid by this survey and the commercial fishery. The current survey may have sampled different parts of the grid to the parts that are commercially fished. To help overcome such problems Vessel Monitoring System (VMS) data could be used to map trawl effort with greater resolution as a basis for any future surveys.
The survey also only sampled a three week period and therefore could not assess any local seasonal variability in distribution and abundance that may occur. However, seasonal variability in distribution seems unlikely due to the limited swimming ability of the species, which would most likely rely on currents to move large distances (Ashley-Ross, 2002; Kendrick et al., 2003). The commercial fishery logbook data may also not display seasonal variation in pipehorse abundance for one location. This may be due to the movement of the fishery to other areas of the state throughout the year, thereby providing limited data for non-target species in specific areas at particular times of the year.
The lack of relationship and the variability between the two data sources indicate that the commercial fishery logbook data alone are probably not an appropriate way to identify fine scale areas of high and low abundance of syngnathids. However, these data remain useful for identifying larger scale areas within the state where most syngnathids are caught. The results of the survey also show that highest captures of syngnathids in shallow water EKP trawl grounds were in areas of low historical trawl effort. This result could infer that high syngnathid abundances may occur in habitats not targeted by trawlers or that abundances in high effort trawl grounds have been reduced substantially due to fishing mortality. Anecdotal evidence in previous reports have supported the hypothesis that syngnathids generally do not occur in sandy seabed areas commonly targeted by trawlers (Bowles, 2001; Kendrick et al., 2003; Martin-Smith et al., 2003; Zeller, 2002).
Basic biological information
The biological information collected in this study was mainly from Solegnathus spp. as they constituted 90% of the syngnathids caught. The information was consistent with the findings of Connolly et al. (2001), who sampled approximately 2500 S. hardwickii
Survey limitations
The syngnathid distribution and abundance data from this survey are limited by the ability to collect information on the physical features of the environment surveyed. The only abiotic information recorded at each trawl site included depth and position (latitude and longitude). Other abiotic factors that may have affected the catches of syngnathids could include bottom temperature, bottom salinity, wave height, tide, moon phase and sediment composition. Most of these factors were not recorded due to the difficulty of doing so accurately on a trawler.
Conclusions and recommendations
The first objective of the study was to map the distribution and abundance of syngnathids within the shallow water EKP trawl grounds. The distribution and abundance were displayed by location and depth, and the results supported previous information on each species. The survey found that other habitat characteristics may be more important than depth to explain variation in pipehorse abundance.
The distribution range of the two pipehorse species, as shown by logbook data, is different to the information from this and other research surveys. Further work that could address this difference includes validating the species that are being recorded, further education programs on species identification for all commercial trawl fishermen or change the reporting process to record pipehorses as a group. Species validation is currently being addressed by the DPI&F observer program. A protected species education program is also currently being developed by DPI&F and will address such issues as pipehorse species identification.
When the current survey was being designed, two hot-spots along the Queensland
coastline were identified as high historical syngnathid catch—shallow water EKP (southern Queensland) and the inshore tiger/red spot king (northern Queensland) trawl grounds. A survey collecting information on syngnathids and other bycatch species was undertaken in the northern trawl grounds prior to the shallow water EKP trawl survey. It was hoped that this survey would provide significant data on pipehorse distribution from the northern survey area, however, only four pipehorses were collected (Clive Turnbull, DPI&F, pers. comm. July 2005). Due to the lack of syngnathid information from the northern survey areas it may be advantageous to conduct a survey similarly designed to the current southern survey, specifically targeting syngnathids in the northern hot-spot area. The second objective was to gather information on the basic biology of the syngnathid species collected from the survey. Most syngnathids caught in the trawl survey were
Solegnathus spp. (pipehorses) and length, weight, gender and reproduction information on these species was collected. These results support information that has previously been documented on these species. Further internal investigation of the specimens would need to be undertaken to produce additional biological information (dietary, reproductive or age and growth) and as such the specimens collected from this survey have been retained frozen for further research.
The third objective of the study was to compare the patterns of distribution and abundance of syngnathids shown by the survey results with the patterns displayed by the commercial fishery logbook data. This analysis concluded that there was no significant relationship between the two data sources and that the majority of syngnathids found within the shallow water EKP trawl grounds occurred in low trawl effort areas. The lack of a significant relationship between the two data sources may indicate that commercial fishery logbook data alone are most useful for identifying large scale areas within the state and not fine scale areas of high and low syngnathid abundance.
Further investigations into fine scale distribution and habitat preferences of syngnathids associated with trawl grounds could be addressed by using underwater video apparatus. Further research such as the current Great Barrier Reef Seabed Biodiversity Mapping Project using dredging and towed video may provide information on the habitats and structure preferred by syngnathids.
References
Aquarium Fish and Coral Fisheries Working Group (1999). Discussion Paper No. 10 Queensland marine aquarium fish and coral collecting fisheries. Queensland Fisheries Management Authority, Brisbane, Australia.
Ashley-Ross, M.A. (2002). Mechanical properties of the dorsal fin muscle of seahorse (Hippocampus) and pipefish (Syngnathus). Journal of Experimental Zoology293, 561–577. Bowles, D.R.J. (2001). The nature of the bycatch fishery of Solegnathus spp. (Pipehorses) in NSW demersal trawl fisheries. NSW Fisheries Scientific Committee, Newcastle.
Connolly, R.C., Cronin, E.R. and Thomas, B.E. (2001). Trawl bycatch of syngnathids in Queensland: catch rates, distribution and population biology of Solegnathus pipehorses (seadragons). Project No. 1999/124 Report to Fisheries Research and Development Corporation. Griffith University, Gold Coast, Australia.
Courtney, A.J., Tonks, M., Roy, D., Haddy, J., Jebreen, E. and Campbell, M. (2003). Exploring associations between pipehorse (Solegnathus cf. hardwickii) abundance and bycatch faunal communities in the Queensland trawl fishery. In Incidental pipefish harvest from the Queensland East Coast Trawl Fishery: report to Environment Australia, April 2003. (Eds. M. Dunning, C. Bullock, J. Bibby and A.J. Courtney) Department of Primary Industries, Brisbane, Australia.
Dawson, C.E. (1985). ‘Indo-Pacific pipefishes: (Red Sea to the Americas).’ Gulf Coast Research Laboratory, Ocean Springs, Mississippi.
Dunning, M., Bullock, C., Bibby, J. and Courtney, A.J. (2003). Incidental pipefish harvest from the Queensland East Coast Trawl Fishery. Annual report required as a condition of the Declaration of an Approved Wildlife Trade Operation under the Commonwealth
Environment Protection and Biodiversity Conservation Act 1999, 10 July 2002. Department of Primary Industries, Brisbane, Australia.
Dunning, M., Lightowler, M. and Jones, P. (2001). Syngnathid (pipefish) harvest from the Queensland East Coast Trawl Fishery. Draft statement of management arrangements. Department of Primary Industries, Brisbane, Australia.
Environment Protection and Biodiversity Conservation Act 1999, Act No 91 of 1999, Commonwealth of Australia.
Fisheries Act 1994, Act No. 37 of 1994, Office of the Queensland Parliamentary Council.
Fisheries (East Coast Trawl) Management Plan 1999, subordinate legislation of the
Fisheries Act 1994, Office of the Queensland Parliamentary Council.
Fisheries Regulation 1995 subordinate legislation of the Fisheries Act 1994, Office of the Queensland Parliamentary Council.
Gaddes, S. and Bibby, J. (2005). Status of the Queensland east coast otter trawl fishery: 2004 effort year. Department of Primary Industries and Fisheries, Brisbane, Australia. Genstat (2003). Genstat 7th Edition. Lawes Agricultural Trust.
Jebreen, E., Yeomans, K., Dredge, M., McGilvray, J., Smallwood, D., Bullock, C., Tonks, M. and Dichmont, C. (2003). Fisheries Long Term Monitoring, Scallop Report 1997–2000: abundance estimates and an evaluation of permanent scallop replenishment areas for the saucer scallop (Amusium japonicum balloti) in Queensland, 1997–2000. Department of Primary Industries, Brisbane, Australia.
Jones, C.M. and Derbyshire, K. (1988). Sampling the demersal fauna from a commercial penaeid prawn fishery off the central Queensland coast. Memoirs of the Queensland Museum25, 403–415.
Kendrick, A.J. and Hyndes, G.A. (2003). Patterns in the abundance and size-distribution of syngnathid fishes among habitats in a seagrass-dominated marine environment.
Kuiter, R.H. (2000). ‘Seahorses, Pipefishes and Their Relatives: A Comprehensive Guide to Syngnathiformes.’ TCM Publishing, Chorleywood, UK.
Kuiter, R.H. (2001). Revision of the Australian seahorses of the genus Hippocampus
(Syngnathiformes: Syngnathidae) with descriptions of nine new species. Records of the Australian Museum53, 293–340.
Lightowler, M. (1998). Proposed Managment Arrangements for Syngnathids Taken in Queensland Waters. Report to QDPI. Department of Primary Industries, Brisbane, Australia. Martin-Smith, K.M., Fung-ngai Lam, T. and Kwok-hung Lee, S. (2003). Trade in pipehorses
Solegnathus spp. for traditional medicine in Hong Kong. Traffic Bulletin19, 139–148. McGilvray, J. (2004). A Pilot Observer Program for Queensland’s East Coast Trawl Fishery: a report to the Australian Government Department of the Environment and Heritage. Department of Primary Industries and Fisheries, Brisbane, Australia.
Moreau, M.A. and Vincent, A.C.J. (2004). Social structure and space use in a wild
population of the Australian short-headed seahorse Hippocampus breviceps Peters, 1869.
Marine and Freshwater Research55, 231–239.
Payne, M.F., Rippingale, R.J. and Longmore, R.B. (1998). Growth and survival of juvenile pipefish (Stigmatopora argus) fed live copepods with high and low HUFA content.
Aquaculture 167, 237–245.
Pogonoski, J.J., Pollard, D.A. and Paxton, J.R. (2002). Conservation Overview and Action Plan for Australian Threatened and Potentially Threatened Marine and Estuarine Fishes. Commonwealth of Australia, Environment Australia, Canberra.
Sanchez-Camara, J. and Booth, D.J. (2004). Movement, home range and site fidelity of the weedy seadragon Phyllopteryx taeniolatus (Teleostei: Syngnathidae). Environmental Biology of Fishes70, 31–41.
Stobutzki, I., Blaber, S., Brewer, D., Fry, G.L.A., Heales, D., Jones, P., Miller, M., Milton, D., Salini, J., VanderVelde, T., Wang, Y.G., Wassenberg, T., Dredge, M., Courtney, A., Chilcott, K. and Eayrs, S. (2000). Final Report FRDC 1996/257 Ecological sustainability of bycatch and biodiversity in prawn trawl fisheries. CSIRO, Cleveland, Queensland, Australia. Turnbull, C., Mellors, J. and Atfield, J. (2004). Fisheries Long Term Monitoring Program, A Summary of Tiger and Endeavour Prawn Survey Results: 1998–2002. Department of Primary Industries and Fisheries, Brisbane, Australia.
Vincent, A.C.J. (1996). ‘The International Trade in Seahorses.’ Traffic International, Cambridge, UK.
Williams, L. (2002). Queensland’s Fisheries Resources: current condition and recent trends 1988–2000. Department of Primary Industries, Brisbane, Australia.
Wilson, A.B., Ahnesjo, I., Vincent, A.C.J. and Meyer, A. (2003). The dynamics of male brooding, mating patterns, and sex roles in pipefishes and seahorses (family Syngnathidae). Evolution57, 1374–1386.
Woods, C.M.C. (2003). Effects of varying Artemia enrichment on growth and survival of juvenile seahorses, Hippocampus abdominalis. Aquaculture220, 537–548.
Appendix 1—The species on the International Union for Conservation
of Nature and Natural Resources (IUCN) Red List
Scientific Name Common Name(s) Red List and Criteria
Doryrhamphus dactyliophorus BANDED PIPEFISH DD ver 2.3 (1994)
Hippocampus abdominalis BIG-BELLY SEAHORSE KIORE
POT-BELLIED SEAHORSE VU A2d ver 2.3 (1994)
Hippocampus angustus NARROW-BELLIED SEAHORSE DD ver 3.1 (2001)
Hippocampus bargibanti BARGIBANT’S SEAHORSE
PYGMY SEAHORSE DD ver 3.1 (2001)
Hippocampus breviceps KNOBBY SEAHORSE
SHORT-HEADED SEAHORSE
SHORT-SNOUTED SEAHORSE DD ver 2.3 (1994)
Hippocampus fisheri FISHER’S SEAHORSE DD ver 3.1 (2001)
Hippocampus kelloggi GREAT SEAHORSE
KELLOGG’S SEAHORSE
OFFSHORE SEAHORSE DD ver 3.1 (2001)
Hippocampus kuda COMMON SEAHORSE
ESTUARY SEAHORSE SPOTTED SEAHORSE
YELLOW SEAHORSE VU A4cd ver 3.1 (2001)
Hippocampus minotaur BULLNECK SEAHORSE DD ver 2.3 (1994)
Hippocampus spinosissimus HEDGEHOG SEAHORSE VU A4cd ver 3.1 (2001)
Hippocampus subelongatus TIGER SNOUT SEAHORSE
WEST AUSTRALIAN SEAHORSE DD ver 3.1 (2001)
Hippocampus trimaculatus FLAT-FACED SEAHORSE
LOW-CROWNED SEAHORSE
THREE-SPOT SEAHORSE VU A4cd ver 3.1 (2001)
Hippocampus whitei NEW HOLLAND SEAHORSE
SYDNEY SEAHORSE
WHITE’S SEAHORSE DD ver 3.1 (2001)
Hippocampus zebra ZEBRA SEAHORSE DD ver 3.1 (2001)
Phycodurus eques LEAFY SEADRAGON DD ver 2.3 (1994)
Phyllopteryx taeniolatus WEEDY SEADRAGON DD ver 2.3 (1994)
Solegnathus dunckeri DUNCKER’S PIPEHORSE VU A1d+2d ver 2.3 (1994)
Solegnathus hardwickii HARDWICKE’S PIPEFISH
PALLID SEAHORSE5 VU A1d+2d ver 2.3 (1994)
Solegnathus lettiensis GÜNTHER’S PIPEHORSE VU A2d ver 2.3 (1994)
Solegnathus robustus ROBUST PIPEHORSE VU A2d ver 2.3 (1994)
Solegnathus spinosissimus SPINY PIPEHORSE VU A1d+2d ver 2.3 (1994)
Syngnathoides biaculeatus ALLIGATOR PIPEFISH
DOUBLE-ENDED PIPEFISH DD ver 2.3 (1994) DD = Data Deficient Vu = Vulnerable
Source: IUCN 2004. 2004 IUCN Red List of Threatened Species. <www.redlist.org>. Downloaded on 15 July 2005
These species are listed because they meet certain criteria set by the IUCN. In the case of the vulnerable Australian syngnathid species they have been listed because there has been an observed, estimated, inferred or suspected reduction6 in population size over the last 10 years
or three generations, which ever may be the longest.
5 The above is an extraction from IUCN (2004); however; the ‘pallid seahorse’ is actually a pipehorse and is commonly referred to as
a ‘pallid pipehorse’ in all Queensland legislation.
Appendix 3—The Department of the Environment and Heritage’s
declaration of an Approved Wildlife Trade Operation for Syngnathids
Syngnathid (pipefish) Harvest from the Queensland East Coast Trawl Fishery Declaration of an Approved Wildlife Trade OperationCommonwealth of Australia Gazette No. S261, 11 July 2002
Commonwealth of Australia
Environment Protection and Biodiversity Conservation Act 1999 Declaration of an Approved Wildlife Trade Operation
I, David Kemp, Minister for the Environment and Heritage, have considered in accordance with section 303FN of the Environment Protection and Biodiversity Conservation Act 1999
(the Act) the application from the Queensland Fisheries Service, public comments on the proposal as required under section 303FR, and advice on the ecological sustainability of the operation. I am satisfied on those matters specified in section 303FN of the Act. I hereby declare the operations for the incidental harvesting of Solegnathus dunckeri and
Solegnathus hardwickii by licensed operators under the Queensland Fisheries Act 1994, a commercial fishery in accordance with section 303FN (10)(2), to be an approved Wildlife Trade Operation for the purposes of the Act.
Unless amended or revoked, this declaration:
a) has effect in relation to the regulated native specimens listed in the Schedule and subject to the conditions applied under section 303FT specified in the Schedule, and b) is valid from 1 July 2002 until 1 July 2005.
Dated this 10th day of July 2002 [Signed]
David Kemp
Minister for the Environment and Heritage
Subject to the Administrative Appeals Tribunal Act 1975, a person or persons whose interests are affected by this declaration may, within 28 days, make an application in writing to Department of the Environment and Heritage for the reasons for the decision. An application for independent review of the decision may be made to the Administrative Appeals Tribunal, on payment of the relevant fee, by or on behalf of the person or persons whose interests are affected, either within 28 days of receipt of the reasons for the decision, or within 28 days of this declaration if reasons for the decision are not sought. Further information may be obtained from:
Director, Sustainable Fisheries Section Marine and Water Division
Department of the Environment and Heritage GPO Box 787
Canberra ACT 2601
Schedule
Additional Provision (s303FT)
Declaration of the Harvest Operations for Solegnathus dunckeri and Solegnathus hardwickii in Queensland waters as an approved Wildlife Trade Operation
Regulated native specimens to which the declaration applies
Taxon Common name Product type
Solegnathus dunckeri Duncker’s pipehorse Dried product
Solegnathus hardwickii Pallid pipehorse Dried product
Relating to the harvesting of Solegnathus dunckeri and Solegnathus hardwickii harvested from Queensland waters by licensed operators under the Fisheries Act 1994.
Declaration Conditions
1. Operation of the fishery will be carried out in accordance with the Queensland Fisheries (East Coast Trawl) Management Plan 1999 and the requirements of any permits issued under the Queensland Fisheries Act 1994 or other directions to operators relating to capture and retention of syngnathid fishes (species in the families Syngnathidae and Solenostomidae).
2. The Queensland Fisheries Service shall by May 2003, make the necessary arrangements for the expansion of the current recording of data on catches of syngnathid species in the ECTF (T1) logbooks to include recording by species for retained permitted catch of pipehorses.
3. The Queensland Fisheries Service shall refine and implement programs for the independent validation of catch and bycatch data from the ECT fishery logbook program, including the following:
a) Design, implementation and preliminary assessment of a pilot observer program by May 2004; and
b) using information gained from the pilot study, design and develop for
implementation a long-term observer program capable of providing statistically-robust estimates of bycatch in the East Coast Trawl Fishery and the Stout Whiting Fishery within five years, and provide by April 2005 a report on the proposed program and its implementation.
4. The Queensland Fisheries Service shall identify measures for the progressive reduction and avoidance of catches of syngnathids, particularly in those areas associated with higher rates of syngnathid bycatch. Measures may include gear modification, seasonal or area closures or other operational measures and should be applied progressively as they are identified and can be implemented. The Department of Environment and Heritage shall be notified of any proposed change to management measures to implement such measures.
5. The Queensland Fisheries Service shall develop and implement by May 2003 processes for the routine collection and analysis of information from buyers of pipehorses from the Queensland ECT fishery, including to the extent practicable species composition, quantities and weights of product, size distribution and indicators of reproductive status.