Do Optional Activities Matter in Virtual Learning
Environments?
José A. Ruipérez-Valientea,b, Pedro J. Muñoz-Merinoa , Carlos Delgado Kloosa,
Katja Niemannc, Maren Scheffeld
a
Universidad Carlos III de Madrid, Avenida Universidad 30, 28911 Leganés (Madrid) Spain b
IMDEA Networks Institute, Av. del Mar Mediterráneo 22, 28918 Leganés (Madrid) Spain c
Fraunhofer Institute for Applied Information Technology (FIT), Schloss Birlinghoven, 53754 Sankt Augustin, Germany
d
Open Universiteit Nederland, Valkenburgerweg 177, 6419 AT Heerlen, The Netherlands
{jruipere, pedmume, cdk}@it.uc3m.es,
[email protected], [email protected]
Abstract. Virtual Learning Environments (VLEs) provide students with activi-ties to improve their learning (e.g., reading texts, watching videos or solving exercises). But VLEs usually also provide optional activities (e.g., changing an avatar profile or setting goals). Some of these have a connection with the learn-ing process, but are not directly devoted to learnlearn-ing concepts (e.g., settlearn-ing goals). Few works have dealt with the use of optional activities and the relation-ships between these activities and other metrics in VLEs. This paper analyzes the use of optional activities at different levels in a specific case study with 291 students from three courses (physics, chemistry and mathematics) using the Khan Academy platform. The level of use of the different types of optional ac-tivities is analyzed and compared to that of learning acac-tivities. In addition, the relationship between the usage of optional activities and different student be-haviors and learning metrics is presented.
Keywords: optional activities, Khan Academy, learning analytics, MOOCs
1
Introduction
with the system. Some examples of optional activities are the setting of the students’ own profiles or the setting of their own goals.
Although there are usually many types of optional activities in VLEs, research studies usually focus on the analysis of learning activities but not on the optional ac-tivities. The study reported by Dyckhoff et al. [1] shows a list of learning analytics indicators used in the literature and its categorization. We can see that most of the indicators presented by Dyckhoff et al. [1] are related to learning activities instead of optional activities. The analysis of optional activities enables teachers to know which optional activities are used more, which of them need to be promoted, whether there is a relationship with the use and correct solving of learning activities, or their rela-tionship with other student behaviors.
In this research, we analyze the use of optional activities in a real experiment using the Khan Academy1 platform with 291 students interacting in three different courses. The objectives of this analysis are the following:
Knowing the level of use of the different types of optional activities, giving the percentage distribution between them, but also with respect to the learning activi-ties.
Relating the use of optional activities to the correct solving of learning activities.
Relating the use of optional activities to other student behavior metrics and param-eters such as hint abuse, hint avoidance, total time, progress in the platform, etc.
Checking for categorical associations between the use of the different optional activities and also with other variables such as gender.
2
Related Work
The current common use of VLEs in different learning contexts presents many oppor-tunities to analyze the interaction of students in these environments. These analyses are usually focused on learning activities but not on optional ones. A previous work [2] has analyzed which of the available tools and functionalities are more important than others in Moodle2 and .LRN3. The results of that work indicate that the most-rated functionalities are submission management systems with the teacher’s feedback, visualizations of qualifications, assessments, file downloads, FAQs and forums. How-ever, it has also been shown that students do not always make adequate choices in the learning tools they can use [3]. In addition, the use of tools seems to be influenced by the student’s characteristics, the kind of tool being considered, and the advice students receive.
One of the most widely used learning activities in e-learning environments is the use of forums to support social interaction; this provides a good opportunity to lyze social interactions in e-learning platforms. For instance, Rabbany et al. [4] ana-lyzed the importance of social network analysis for mining structural data and how
1 https://www.khanacademy.org/ 2
https://moodle.org/ 3
this is applicable to the student relationships in e-learning environments. Other works have statistically analyzed forum activity to draw conclusions such as the effect of the teaching staff’s participation or the evolution of forum discussions throughout the duration of the course [5]. Other analyses dealt with the adding of an electronic voting system (EVS) to regular courses [6, 7]. Each type of platform has different types of features to be analyzed. For example the analysis of the use of different types of hints in an Intelligent Tutoring System (ITS) [8]. There are other works that have analyzed the use and outcome of different implementations of gamification in e-learning, e.g., a reward system in the Blackboard platform [9] or a reputation system in an edX Mas-sive Open Online Course (MOOC) [10]. The interaction of students in a Moodle course with wiki articles (where students can peer review each article), discussion forums and also access to optional material such as scientific articles or lecture videos have also been looked at [11]. In addition, many studies inspected the relationship between forum participation and learning outcomes: forum activity, for example, in UNED COMA courses is a useful indicator for success [12]. However, it was also discovered that online participation and interaction does not necessarily translate into higher grades [13].
The use of the different tools commented on in the previous paragraph dealt with learning activities. On the other hand, there are also other works that addressed the use of optional activities. Some studies have dealt with the relationship between stu-dent interactions with a specific e-learning motivation [14]. It was found that interac-tions such as uploading a personal profile photo (an optional activity) and participat-ing in forums are positively correlated to motivation. Moreover, findparticipat-ings suggest that the benefits from optional forum assignments are very low whereas compulsory fo-rum assignments might be related to higher performance [15]. In addition, the work in [16] made an in-depth analysis of the use of video annotation, which can be seen as an optional activity for students.
As a conclusion, there has been extensive work to analyze the use of learning ac-tivities and relate it to different indicators such as learning outcomes. However, there has not been many works focused on optional activities. As a difference of this work with respect to the presented works about optional activities, this paper gives details of the total use distribution of several different optional activities, relates this use to exercise correct solving indicators, as well as to some student behaviors such as some used by researchers in previous works [17].
3
Measuring Optional Activities in VLEs
In this section we propose a simple general measure to take into account the differ-ent optional activities that each studdiffer-ent has used.
∑
is the maximum number of points that can be achieved in the whole course if you have made the maximum use of all the optional activities (taking also into ac-count weights). The points are assigned by researchers but it does not mean that the platform assigns points automatically. We should take into account the following premises in order to adapt it to each context:
This is a general formula that can be configured to each context with a measure ranging from 0 (i.e., a student who has not used any optional activity) to 100 (i.e., a student who has made the maximum use of all the optional activities).
The amount of points that can be achieved by completing each optional activity is a configuration parameter that should be analyzed for each context. A student can either earn several points if he has used the same activity more than once, or just earn one point no matter the number of times the student has used it. The model gives a general way of measuring it in different contexts.
Finally, each activity can have a different weight, taking into account the im-portance within the set of optional activities that are being considered in the case study. For example, it could be regarded as more important to complete learning goals or participate in forum activities than to update your profile avatar, thus the weight should be different for that case.
3.1 The Application to Khan Academy
In this sub-section we analyze a particular platform, i.e., Khan Academy, as it was used for pre-graduate courses at Universidad Carlos III de Madrid. Section 4.1 de-scribes this experiment in more depth, while this section dede-scribes the optional activi-ties we have taken into account in the Khan Academy courses. We have divided these activities in two groups: optional activities that are related to learning and others that are not related to learning. First, the activities that are related to learning include:
Feedback: Comments that students post to videos of the course are considered as feedback.
Votes: Students can vote down (-1), be indifferent to (0) or vote up (+1) the feed-back that other students have posted to videos. Figure 1 shows an example of a comment that has some votes. The name and message of the author have been blurred to preserve anonymity.
Goal: Students can set goals, i.e., they choose a selection of videos or exercises that must be completed, and when they finish the goal they obtain an additional amount of points. Figure 2 shows an example about how to set a custom goal.
On the other hand, we have taken into account other optional activities that are not related to learning. These activities come from social networks and games environ-ments:
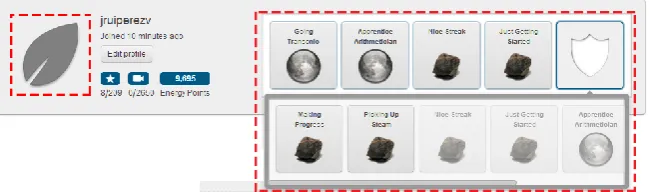
Badge display: Students can personalize a selection of badges to be displayed in their personal profile. The badges that can be displayed are the ones that each stu-dent has earned previously. Figure 3 shows a portion of the personal profile where the profile avatar and the badge display can be observed.
Fig. 1. Students’ feedback and votes in a video example can be observed inside the red dotted line. The authors and comments have been blurred to preserve anonymity.
Fig. 2. Custom goal example. The student has to master chemical bonds exercises and videos.
Fig. 3. Personal profile of a student in our Khan Academy instance. The default avatar image and badge display are pointed out by the red dotted line.
have the same weight (although goals can provide a maximum of two points, as ex-plained later). We do not wish to give more importance to any of the activities in this case study, just to check which of the activities have been used. Specifically, the scor-ing method is designed as follows: A user gets one point whenever he selects an ava-tar image, selects at least one badge to be displayed, writes a feedback about a video, votes for any of the comments of other students or starts at least one goal (an addi-tional point is given when the user finishes at least one started goal).
Consequently, there are five different activities, and students can earn a maximum quantity of six points if they do them all. The general metric to measure the use of optional activities is adapted to this specific case studio in the next line:
∑
4
Case Study
In this section we present the case study about the usage of optional activities. The first sub-section describes the context where the experiment was conducted. The sec-ond sub-section offers an overview of the total use of the optional activities within the setting, as well as a comparison between the optional activities usage and regular courseware. The last sub-section analyzes the relationship between the use of optional activities and other metrics that we have defined in others works.
4.1 Description of the Experiment
Universidad Carlos III de Madrid uses the Khan Academy platform to apply an “in-verted classroom” methodology [18], in which students learn and review concepts by using the provided Khan Academy courses at home and then take the face to face lessons in the university. These courses are for freshmen students who are entering a science degree in order to review the concepts required during theirfirst year of uni-versity. We used the data generated in three courses (physics, chemistry and mathe-matics) that took place in August 2013. These courses are composed of sets of videos and exercises, which have been designed by the instructors. Although it was not man-datory for the students to access these courses, it was strongly recommended; this is an important fact when measuring the use of the platform. It is also noteworthy that students were not informed of the optional activities available.
4.2 Use of Optional Activities
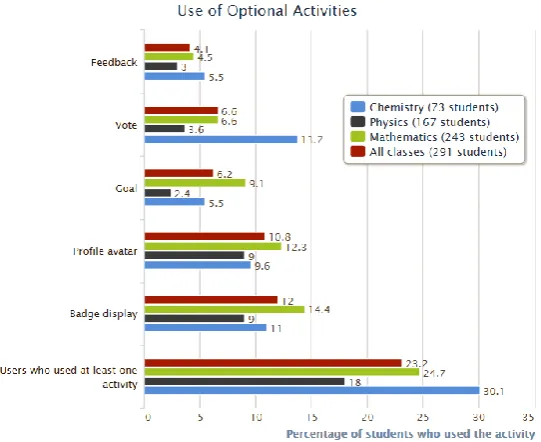
This section includes a quantitative analysis of the use of the optional activities. This usage is also compared to the participation ratios with the regular items (such as exer-cises and videos) of the courses. We provide data from each of the courses separately and also for the overall results of all courses. Figure 4 shows results of the optional activities use for each activity and class. Each bar represents the percentage of stu-dents in the class who have used the activity on the left axis. In addition the last met-ric provides the percentage of users who have used at least one of the activities. Each one of the courses is represented by a different color where blue stands for chemistry, dark grey for physics, green for mathematics and red for the students in all classes.
The results shown in figure 4 take into account all the students who logged in at least once to the Khan Academy platform. Consequently, it is certain that many of these students did not interact much with the system, neither with optional activities nor with learning activities. From figure 4 we can extract the following main conclu-sions. The optional activities used the most are the configuration of a profile avatar and the badge display. Although the exact percentage numbers differ from one course to another, on average we can draw the following results; with 10.8% (avatar) and 12% (badges) respectively for all courses, they are by far the most used optional ac-tivities in all courses. A possible reason for this could be that these students, who are aged around 17–19 years, are comfortable using activities originating from a social network or gaming context.
On the other hand, optional activities that are related to learning (feedback, vote and goal) have been used much less (4.1%, 6.6% and 6.2%, respectively) in all cours-es. The activity which has been used the least is feedback. A reasonable argument is that writing a feedback answer about a video generally requires a greater effort than just simply changing an avatar, for example. Furthermore, Moodle forums were also enabled for students during these courses, and they conducted most of their social interaction in these forums.
them was negative (2.5%). These results indicate that most of the users vote for posi-tive reasons given these conditions and it is very unlikely that they vote negaposi-tively on others students.
Fig. 4. This chart represents the percentage of users who have used each of the activities in each course.
Table 1. Comparison between the use of regular learning activities versus the use of optional activities. Each cell represents the percentage of students for each interval.
Type of activity Percentage of activities accessed
0% 1-33 % 34-66% 67-99% 100%
Regular learning
activi-ties 2.48% 51.55% 23.19% 18.84% 3.93%
Optional activities 76.81% 18.43% 4.14% 0.41% 0.21%
4.3 Relationships between Different Metrics
In this sub-section we present different relationships between the usage of the option-al activities (using the metric formula specified in section 3.1.) with other metrics that we have calculated in other works [19]. The metrics are the following: exercise and video access, exercise and video abandonment, total time spent in exercises and vide-os, following of recommendations, hint avoidance (not solving an exercise correctly but not asking for hints), hint abuse (asking for too many hints without reflecting on previous ones), video avoidance (not solving an exercise correctly but not watching a related video) and unreflective user.
and vote (0.205 and 0.243) have been the least. This might be surprising because feedback and vote are supposed to be related to the learning process, thus that might invite to think that they should be more highly correlated with resolving exercises correctly than avatar and display badges which are not related to the learning process.
Table 2. Bivariate Pearson correlation of optional activities with others metrics. (*): Correlation is significant at the 0.01 level (2-tailed).
Optional activities
sig. (2-tailed)
N = 291
Exercises accessed: 0.429* (p=0.000) Videos accessed: 0.419* (p=0.000) Exercise aban-donment: -0.259* (p=0.000) Video abandon-ment: -0.155* (p=0.008) Total time: 0.491* (p=0.000) Hint abuse: 0.089 (p=0.131) Hint avoider: 0.053 (p=0.370) Follow recommenda-tions: -0.002 (p=0.972) Unreflec-tive user: 0.039 (p=0.507) Video avoider: -0.051 (p=0.384)
Table 3. Bivariate Pearson correlation of the percentage of proficient exercises with the different optional activities.
Proficient exercises sig. (2-tailed)
N = 291
Optional activities: 0.553* (p=0.000) Goal: 0.384* (p=0.000) Feedback: 0.205* (p=0.000) Vote: 0.243* (p=0.000) Avatar: 0.415* (p=0.000) Display badges: 0.418* (p=0.000)
We can also make a comparison with other categorical variables by cross-tabulating the different results. The categorical variables we have used in this analy-sis are gender, the course and the separate use of each optional activity defined as ‘yes’ or ‘no’ per each student. We can analyze the relationship between these varia-bles by using cross-tabulation techniques that are also known as contingency tavaria-bles. Whether the established relation is really significant can be calculated by applying the Pearson Chi-Square Test for categorical data. If the expected count assumptions (the expected count of each cell must be above five) of the Pearson Chi-Square are not met, we can apply the Fisher’s Exact Test.
feed-back use. The test indicates (with a value of 2.80, p = 0.048) that it is statistically significant that men use the feedback activity more than women; the minimum ex-pected count in each cell is higher than five, so the Pearson Chi-Square Test assump-tion is fulfilled for this case. The participaassump-tion differences in web-based learning envi-ronments by gender have also been addressed in other works [20].
The second analysis takes the course and the use of the different optional activities into account. The results reveal that chemistry is the course where feedback and votes were used the most whereas mathematics is the course in which goals, avatar and badge display were used the most. Furthermore, as already mentioned in the last sub-section, physics is the course that made the least use of optional activities. In order to know which of the results are significant, we applied the Fisher’s Exact Test whose assumptions are met (as the Pearson Chi-Square Test assumption of a minimum count of five is not given). The test shows (6.58, p = 0.034) that the relationship between course and goal is significant, so it is statistically significant that mathematics is the course where goal-activity is used most. In addition, the relationship between the use of votes and the course is also significant (7.74, p = 0.019), where chemistry is the course that used votes the most.
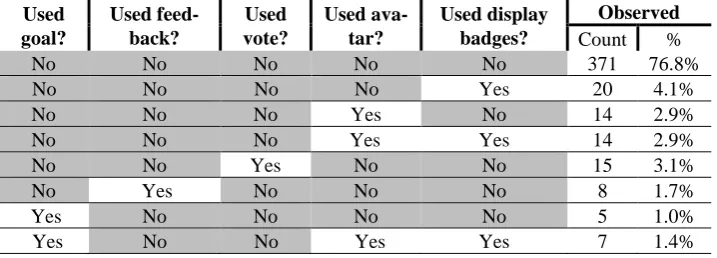
The last analysis carried out is that between all the categorical variables that repre-sent the use of each optional activity. To this end we chose a log linear analysis which allows the comparison of three or more categorical variables in order to determine if there is an association between two or more of them. The factors of the test are the use of each optional activity separately (yes or no) for each student. Table 4 shows the cell count of a log linear analysis of only those associations where the observed count is above or equal to 1% of the cases.
Table 4. Cell count of the most important associations of the log linear analysis between all optional activity categorical variables.
Used goal?
Used feed-back?
Used vote?
Used ava-tar?
Used display badges?
Observed
Count %
No No No No No 371 76.8%
No No No No Yes 20 4.1%
No No No Yes No 14 2.9%
No No No Yes Yes 14 2.9%
No No Yes No No 15 3.1%
No Yes No No No 8 1.7%
Yes No No No No 5 1.0%
Yes No No Yes Yes 7 1.4%
display badges (z = 2.68, p = 0.007), between the use of feedback and votes (z = 2.26, p = 0.008) and also between the use of goal and avatar (z = 2.1, p = 0.036). These results make sense because an association between the use of avatar and display badge is related to activities that come from customizing your personal profile, and the association between the use of feedback and votes are activities related to partici-pation in a forum. In addition, there is a three-way significant relationship between the use of goals, avatar and display badge (z = 1.96, p = 0.05), which is also interest-ing because these three activities are related to gaminterest-ing or social networks environ-ments.
5
Conclusions and Future Work
In this work, we analyze the use of optional activities in a VLE using data from real experiments in the Khan Academy platform with 291 students from three different courses. Results indicate that the use of the optional activities under the conditions of this experiment (the use of the platform was not mandatory and instructors did not inform their students about the optional activities) has been very low. Therefore, we would recommend telling the students about the availability of optional activities or tools for future experiments.
Additionally, results show that the optional activities that were used the most are not related to learning (avatar and display badges), so we would recommend instruc-tors to encourage students to use optional activities related to learning such as feed-back, votes, or goals. Another interesting finding is that more than half of the goals that were started, were finished by the students; we think this type of optional activity is good to improve the engagement of students to the learning process.
We have provided a detailed analysis of the relationship between the use of optional activities and several student behaviors as well as student metrics of use of the platform. This analysis indicates that the use of optional activities is significantly related to the total time spent in the platform and the progress in exercises and videos. Another important result is that none of the behavioral metrics is correlated with the use of optional activities.
However, despite several significant results, this is a preliminary research and we still are not prepared to confirm the causes of some results, and more work is required to answer those questions. An important step for future work would be to understand the relationship between the use of optional activities and learning achievement. This way we could know what optional activities should be reinforced for future experi-ments. Finally, in the future we would like to review the optional activities available in other VLEs and formulate a common framework.
Acknowledgements
Work partially funded by the EEE project, "Plan Nacional de I+D+I TIN2011-28308-C03-01" and the "Emadrid: Investigación y desarrollo de tecnologías para el e-learning en la Comunidad de Madrid" project (S2009/TIC-1650)". Maren Scheffel's contribution is funded by the European Union under FP7 Grant Agreement No 317620 (LinkedUp) and No 619424 (LACE).
References
1. Dyckhoff, A.L., Lukarov, V., Muslim, A., Chatti, M.A., Schroeder, U. Supporting Action Research with Learning Analytics. Proceedings of the Third International Conference on
Learning Analytics and Knowledge, 220-229. ACM, New York (2013)
2. Muñoz-Merino, P. J., Kloos, C. D., Seepold, R., & García, R. M. C. Rating the importance of different LMS functionalities. Frontiers in Education Conference, 36th Annual Confer-ence, 13–18. IEEE, San Diego (2006)
3. Clarebout, G., & Elen, J. Tool use in computer-based learning environments: Towards a research framework. Computers in Human Behavior, 22(3), 389–411 (2006)
4. Rabbany, R., Elatia, S., Takaffoli, M., & Zaïane, O. R. Collaborative learning of students in online discussion forums: A social network analysis perspective. Educational data
min-ing: Applications and Trends (pp. 1–25). Heidelberg, Germany (2014)
5. Brinton, C. G., Lam, H., Ming, F., & Wong, F. M. F. Learning about social learning in MOOCs : From statistical analysis to generative model. CoRR, abs/1312.2159 (2013) 6. Cutrim, E. S. Using a voting system in conjunction with interactive whiteboard technology
to enhance learning in the English language classroom. Computers & Education, 50(1), 338–356 (2008)
7. Kennedy, G. E., & Cutts, Q. I. The association between students’ use of an electronic vot-ing system and their learnvot-ing outcomes. Journal of Computer Assisted Learning, 21(4), 260–268 (2005)
8. Zhou, Y., Freedman, R., Glass, M., Michael, J. A., Rovick, A. A., & Evens, M. W. Deliv-ering hints in a dialogue-based intelligent tutoring system. Proceedings of the Sixteenth
National Conference on Artificial Intelligence (AAAI-99), 1–7. American Association for
Artificial Intelligence, Menlo Park, CA, USA (1998)
10. Coetzee, D., Fox, A., Hearst, M. A., & Hartmann, B. Should your MOOC forum use a reputation system? Proceedings of the 17th ACM Conference on Computer Supported
Co-operative Work & Social Computing (CSCW 2014), 1176–1187. ACM, New York (2014)
11. Hecking, T., Ziebarth, S., & Hoppe, H. U. Analysis of dynamic resource access patterns in a blended learning course. Proceedings of the Fourth International Conference on
Learn-ing Analytics and Knowledge, 173–182. ACM, New York (2014)
12. Santos, J. L., Klerkx, J., Duval, E., Gago, D., & Rodríguez, L. Success, activity and drop-outs in MOOCs an exploratory study on the UNED COMA courses. Proceedings of the
Fourth International Conference on Learning Analytics and Knowledge, 98–102. ACM,
New York (2014)
13. Davies, J., & Graff, M. Performance in e‐learning: Online participation and student grades. British Journal of Educational Technology, 36(4), 657–663 (2005)
14. Munoz-Organero, M., Munoz-Merino, P. J., & Delgado Kloos C. Student behavior and in-teraction patterns with an LMS as motivation predictors in e-learning settings. IEEE Transactions on Education, 53(3), 463–470 (2010)
15. Gafni, R., & Geri, N. The value of collaborative e-learning: Compulsory versus optional online forum assignments. Interdisciplinary Journal of E-Learning and Learning Objects, 6, 335–343 (2010)
16. Gasevic, D., Mirriahi, N., Dawson, S. Analytics of the Effects of Video Use and Instruc-tion to Support Reflective Learning, Proceedings of the Fourth International Conference
on Learning Analytics and Knowledge, 123–132. ACM, New York (2014)
17. Aleven, V., McLaren, B.M., Roll, I., Koedinger, K.R. Toward Meta-cognitive Tutoring: A Model of Help Seeking with a Cognitive Tutor, International Journal of Artificial Intelli-gence in Education, 16, 2, 101–128 (2006)
18. Lage, M. J., Platt, G. J., & Treglia, M. Inverting the classroom: A gateway to creating an inclusive learning environment. The Journal of Economic Education, 3(1), 30–43 (2000) 19. Muñoz-Merino, P. J. Ruipérez, J. A. & Delgado, C. Inferring higher level learning
infor-mation from low level data for the Khan Academy platform. Proceedings of the Third
In-ternational Conference on Learning Analytics and Knowledge, 112–116. ACM, New
York (2013)