CoVID-19: Where We Are, What We Should Do and What We Should Learn
Jörg Eppinger∗,1) Magnus Rueping1,2)
Abstract
There were warnings before; nevertheless the current CoVID-19 pandemic took the world by surprise: within just four month, it conquered the globe and claimed over 200'000 lives. Unprecedented governmental actions put about half of the population under curfew or lock-down. The resulting economic meltdown is expected to eliminate globally 9’000’000’000’000 (9 trillion) USD in 2020 and 2021 alone, a value roughly the size of the yearly GDP of the world’s 150 smallest economies. The resulting crises might cause mass-unemployment and a hunger pandemic later this year. This Essay analyses current statistical data of the CoVID-19 pandemic to develop a guideline for a path through the crisis, minimizing both loss of lives and economic costs. Part 1 details the current situation; part 2 develops a small set of measures, allowing a near normal life until a future vaccination campaign has reached sufficient numbers of people; and part 3 provides some important lessons for the future beyond SARS-CoV-2. The Essay leads to the following key-messages:
1) The CoVID-19 pandemic will stay for at least two more years. This is the minimum time required for a vaccination campaign to reach sufficient numbers of people.
2) The crucial element to control the pandemic is keeping case numbers under the threshold required for a functional tracing, testing & isolation (TTI) strategy. That threshold differs from country to country and strongly depends on culture and the applied tracing technology as well as available testing capacities. 3) The economic burden of a TTI strategy is moderate while fatalities are also reduced. Hence, such an approach is strongly recommended. Its implementation requires a set of simple and cost-effective measures (see figure below), which in combination seem to be sufficient to keep CoVID-2’s reproductive rate at or below 1.
4) Implementing international coordination of actions will be necessary for effective infection-chain tracing
5) If case numbers are above the TTI threshold, shutdown measures remain the only option until tracing of infection chains becomes feasible again.
6) In the future, neglected pandemic-related research requires a funding boost. Just 1% of the bill of the current crisis could support the research of 45’000 scientist for 20 years.
Key-words: SARS-CoV-2, CoVID-19, pandemic control, research policy
∗) Correspondence to: [email protected].
1) Department of Physical Sciences & Engineering, King Abdullah University of Science and Technology (KAUST),
23955 Thuwal, MK, Saudi Arabia.
2) RWTH Aachen University, 52074 Aachen, Germany.
Part I: The Pathogens Strike Back
1) The Warning Bells
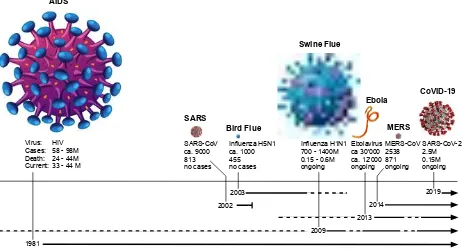
Pandemics have plagued humanity throughout its existence [1]. The discovery of antibiotics appeared to end the battle of man vs. pathogens and enabled our modern societies to concentrate on economic welfare. However, increasing antimicrobial resistance and several outbreaks of viral infections within the last decades were a clear sign that the perceived victory over infectious diseases was nothing but a false sense of security. The regular occurrence of zoonotic diseases demonstrates that pathogens luring in wild animals constitute a nearly unlimited reservoir of potential pandemics. In 2014, a WHO report on zoonotic diseases [2] stated “Over 30 new human pathogens have been detected in the last three decades, 75% of which have originated in animals” and “It is estimated that, globally, about one billion cases of illness and millions of death occur every year from zoonoses”. Among others, HIV, SARS, H1N1 and H5N1 influenza, MERS and Ebola are prominent examples (Figure 1). In February 2019, Dr. Shi Zeng-Li, who due to her research on coronaviruses of bat origin has earned the nick name “bat-woman” published an article warning that SARS-CoV from bats could cause a future epidemic outbreak.[3] In the first days of 2020 a team from the Bill & Melinda Gates Foundation submitted an article to the Lancet urging the world to prepare for a global pandemic threat: “we can hypothesise that the advent of a catastrophic outbreak involving Disease X is likely to result from the zoonotic transmission of a highly virulent RNA virus from an area where a convergence of risk factors and population dynamics will result in sustained person-to-person transmission”.[4] It is tragic that when the article was published a few weeks later, these predictions had already become reality.
Figure 1. Overview of major outbreaks of zoonotic viruses during the last four decades. The virus particle sizes roughly represent the pandemic impact until April 2020.
[1] For a very nice infographic on the history of pandemics and an account on how CoVID-19 relates to previous pandemics, see: www.visualcapitalist.com/history-of-pandemics-deadliest/
[2] http://www.emro.who.int/about-who/rc61/zoonotic-diseases.html
[3] J. Cui, F. Li, Z.-L. Shi. „Origin and evolution of pathogenic coronaviruses“. Nat. Rev. Microbiol. 2019, 17, 181 – 192.
[4] S. Simpson, M. C. Kaufmann, V. Glozman, A. Chakrabarti. „Disease X: accelerating teh development of medical countermeasures fort he next pandemic“. Lancet Infect. Dis 2020, corrected proof online.
https://doi.org/10.1016/S1473-3099(20)30123-7.
SARS
2002 SARS-CoV ca. 9000 813 no cases
Bird Flue
2003 Influenza H5N1 ca. 1000 455 no cases
Swine Flue
2009 Influenza H1N1 700 - 1400M 0.15 - 0.6M ongoing
Ebola
2013 Ebolavirus ca 30'000 ca. 12'000 ongoing
MERS
2014
MERS-CoV 2538 871 ongoing
CoVID-19
2019 SARS-CoV-2 2.5M 0.15M ongoing
AIDS
1981 Virus: Cases: Death: Current:
2) The Drama Unfolds
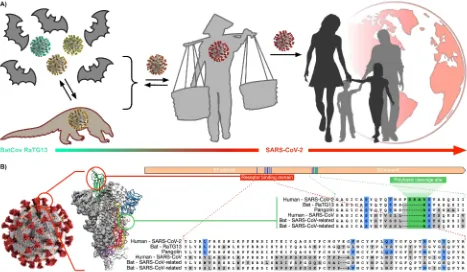
Somewhere in China, presumably in Hubei province, a RNA-polymerase had just made another mistake. Not that this was unexpected: Error-prone replication is the business model of RNA viruses. While most are uneventful, this one was something special. After the newly formed RNA got wrapped up in the growing envelope of the emerging virus particle, this mutation (it might have been the final touch of the newly introduced furin cleavage site or a tuning of the ACE2 binding site) enabled the virus to dramatically expand its realm. For millions of years, such Coronavirues have coexisted with animals, always adapting to the improvements of the immune systems, creating a plethora of genetic variants. Over 6’000 Coronavirus strains might lie dormant in bats alone. [5] And one of them, annotated BatCoV RaTG13, striving in a colony of Chinese Horseshoe Bats living in a cave in the Yunnan province in southern China, had become accustomed to a human host, either directly or via intermediate animal(s). The adaption to the human respiratory system was presumably a long-term on-off relationship, with localized manifestations as a cold, sometimes leading to lung infections. Now, with the finishing touch to its cell-entry machinery, the Coronavirus emerged as SARS-CoV-2 from an individual, somewhere around the Huanan Market in Wuhan on December 2019 (Figure 2).
On December 30th, Dr. Shi Zeng-Li, received a call demanding that she should investigate two pneumonia cases linked to an apparently novel type of coronavirus. On Jan 1st, 2020, just a few hundred meters from Dr. Shi’s laboratory, officials closed the Huanan market as the suspected source of the mysterious disease. On Jan. 9th, the first report linked a death to COVID-19 – the name for the new disease caused by SARS-CoV-2. The WHO confirmed human-to-human transmission on Jan 20th. From then on, humanity had to learn that it still has nothing to put forward, when exponential growth unfolds its power. Just three month after Dr. Shi received the call, the confirmed number of CoVID-19 cases surpassed 1 million – despite the drastic counter measures implemented in the meantime. Today, on April 22nd the pandemic has passed 2.5M confirmed cases, and caused over 180’000 death, while about half of the global population is under curfew, lock-down or similar governmental restrictions.
Figure 2. Illustration of the SARS-CoV-2 human adaptive pathway. A) Originating form the bat coronavirus BatCov RaTG13, adaption over several stations including an intermediate animal host (e.g. pangolin) led to the pandemic SARS-CoV-2. B) Major adaptive mutation in the receptor and polybasic furin cleavage site of the S-protein [6]. Blue: key-adaptions for human cell entry; grey: residues differing from SARS-CoV-2.
[5] S.J. Anthony, et al.“Global Patterns in coronavirus diversity“. Virus Evolution, 3, 2017, vex012. https://doi.org/10.1093/ve/vex012
3) The Pandemic Marathon
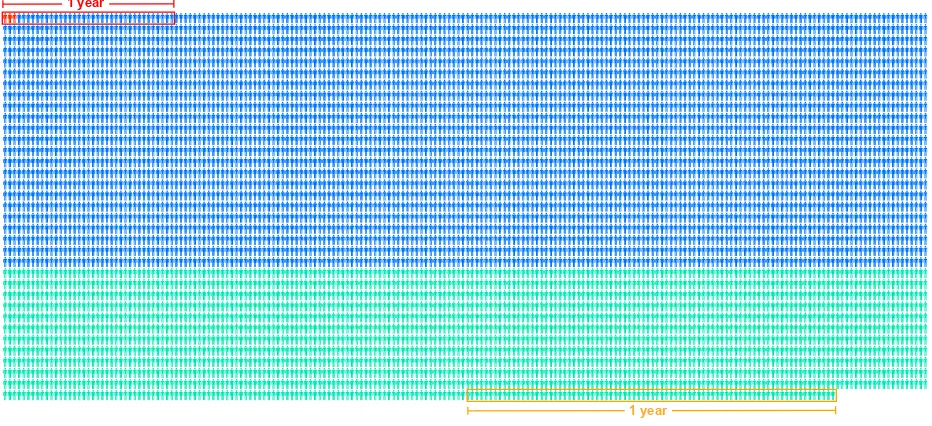
As high as these numbers seem, compared to a human population of nearly 8 billion they are negligible. Nevertheless, if you die of CoVID-19 or suffer from disease inflicted lung damage for the rest of your life, even negligible numbers become significant. However, the important message from the comparison of cases vs. population is that we still are at the very beginning of this pandemic marathon. 2.5M or, if hidden figures [7] are taken into account, even 10M cases are just 0.032 – 0.125 % of the global population (Figure 3).
In contrast, with an estimated reproduction number R0 of 2.24 – 3.58 [8], app. 55 – 75 % of the world’s
population will need to become infected before an acquired “herd immunity” ends the pandemic’s exponential spread without counter measures and before normal social and economic activities can fully return. This means roughly 4.5 – 6 billion infections or about 500 – 1’600 times as many as today. While the current rate of 100’000 daily new confirmed cases imposes a substantial strain on health care systems, we would need to sustain that rate for over 100 years to reach the desired global herd immunity. However, that simple calculation is only valid for a stable population. Currently, the world’s population grows by 220’000 people per day, which is more than double the CoVID-19 infection rate. Correspondingly, this postpones “herd immunity” for at least some 100 years past the point in time the growth in world population has come to a halt.
Development of an effective vaccine provides a welcome shortcut. However many obstacles exist on this path. If everything goes as planned (which is a contradiction in every research endeavor) a realistic earliest date for the introduction of a SARS-CoV-2 vaccine is about nine months away, and a global vaccination campaign might take one or two more years to reach the numbers required. Even elimination of all cases in one country will not help to overcome the pandemic, since any such victory can only be temporary. Like other infections, SARS-CoV-2 will remain in pockets of the population or its animal intermediary host somewhere on the planet and return as soon as countermeasures are relaxed. All factors considered, we should plan on living with CoVID-19 for at least two more years. This does not sound promising, and since our new companion SARS-CoV-2 will stay with us for a while, we better try to learn as much as possible from existing data to plan our future.
Figure 3. Illustration of where the world stands in the CoVID-19 pandemic. One person represents 1M people. Red:
2.5M confirmed cases. Blue: roughly 5 billion more infections are required to reach “herd immunity”. Green: remainder of the global 7.8 billion population. Red box represents yearly pandemic progress at a constant infection rate of 100’000 new cases per day. Orange: current population growth of 80M per year.
[7] Small scale studies from Germany and Austria seem to suggest that only one in five cases might be detected since test capacities are limited. However, the results should be taken with care, at least the German study is currently debated due to methodological concerns. See:
https://www.land.nrw/sites/default/files/asset/document/zwischenergebnis_covid19_case_study_gangelt_0.pdf; https://www.medinlive.at/wissenschaft/stichprobentests-infektionen-bei-vielfachem-der-offiziellen-zahlen
[8]
Zhao, S. et al.”Preliminary estimation of the basic reproduction number of novel coronavirus (2019-nCoV) inChina, from 2019 to 2020: A data-driven analysis in the early phase of the outbreak.“ Int. J. Infect. Diseases 2020, 92, 214 – 217.
1 year
4) Time is Critical
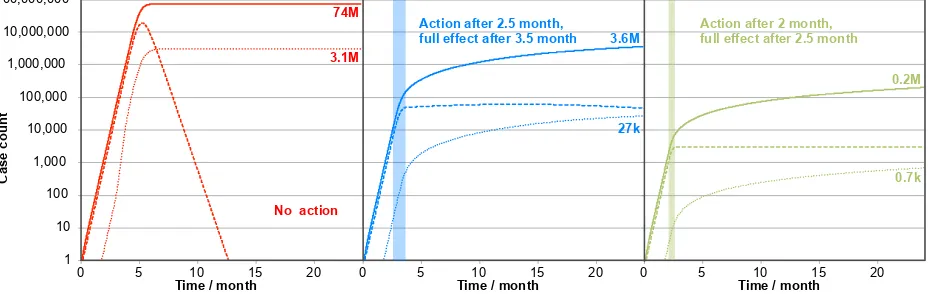
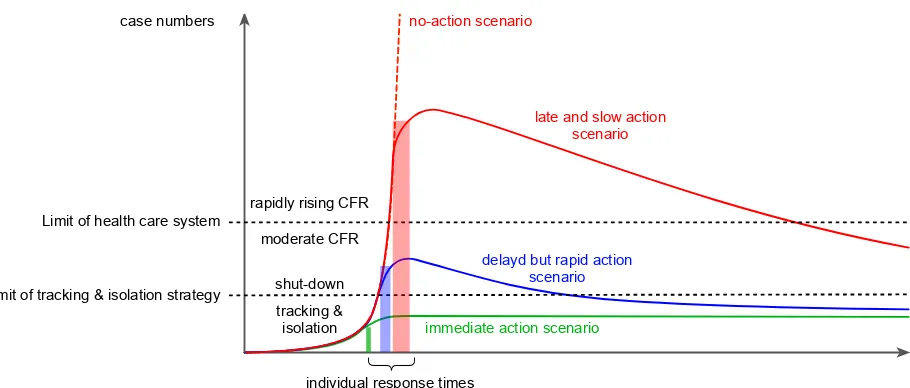
The established time frame of two years is crucial to estimate the impact of the CoVID-19 pandemic under specific conditions. Three scenarios of a simple, yet – for this purpose – sufficient pandemic model [9] provides some important answers to basic questions (Figure 4).
First, what would have happened if no actions were taken? In a country with a population of 80M (we used this number since it resembles Germany and results multiplied by 100 conveniently give a rough estimate for the global scale of the pandemic), the infection wave would be over after roughly one year. While this scenario seems promising at first sight, the inflicted cases and fatalities are not. Up to 19M infections at the peak with 1M cases requiring hospitalization would result in a collapse of the health system, leading to a case fatality rate (CFR) above 4 % and more than 3M fatalities – an obviously undesirable outcome.
The second scenario illustrates the course of events that took place to date in most high-income countries: roughly 2.5 months after the first (for some time undetected) infections occurred, initial measures were put in place, but showed little effect. Within 1 month, the measures were tightened more and more to finally achieve a reproductive rate of R = 1. If that rate is maintained for the reminder of the two-year timeframe, the health system will remain under some stress, but overall the situation is under control. The fatality rate over two year stays around 0.8 % leading to 27’000 fatalities until a vaccination campaign ends the pandemic. This scenario has become publicized as the “flatten the curve” strategy oriented around hospital capacities. When dealing with exponential developments, however, the most crucial factor is time: the third scenario shows that if measures had been taken 2 weeks earlier and implementation was quicker, the same measures as in scenario 2 (or even much easier measures if done correctly, refer to the 2nd part of this CoVID-19 trilogy) would have been sufficient to keep the CFR at 0.35% [10] with less than 700 fatalities within two years.[11]
Figure 4. Three scenarios for the initial 24 months of a SARS-CoV19 pandemic (population: 80M; R0 = 3.3;
incubation time: 4 days; infection duration: 10 days; untreated mortality CFR0 = 4%; treated mortality CFRt = 0.35%;
hospitalization H = 5 %; intensive care capacity: 1 bed / 10’000 people; hospital capacity sensitivity = 2). Red: no counter measures taken; blue: countermeasures to reach R = 1 initiated after 2.5 month, in full effect one month later; green: countermeasures to reach R = 1 initiated after 2 month, in full effect two weeks later. Solid line: total confirmed cases; dashed line: active infections; doted line: total fatalities.
[9] Model based on Tom Fiddaman’s Community Coronavirus Conceptual Model: www.systemdynamics.org/covid-19.
[10] Currently, the CoVID-19 CFR of about 1 % seems the most accurate. See: Rajgor, D. D., Lee, M. H., Archuleta, S., Bagdasarian, N. & Quek, S. C. „The many estimates of the COVID-19 case fatality rate“. The Lancet Infectious Diseases2020, 1; https://doi.org/10.1016/S1473-3099(20)30244-9. However, taking hidden figures and good intensive care into account, a 0.35% mortality rate seems achievable, if the stress on the health care system can be kept low. Compare also the studies cited in footnote 7.
[11] Two factors these models don’t include but which may alter the outcome should be kept in mind. 1) Seasonality: endemic coronaviruses usually vanish during summer and resurge during winter season (Kissler et al., Science
10.1126/science.abb5793 (2020)). However, the quick spread of the SARS-CoV-2 around the globe with infections thriving also in warm climates argue against pronounced seasonal virus dynamics. 2) Viral variability: while the SARS-CoV-2 seems to be genetically relatively stable (P. Foster et al., PNAS,
10.1073/pnas.2004999117 (2020)), some observations suggest that immunity may not be achieved in all cases or may not last long. While unlikely, it would be bad news for the “herd Immunity” target.
0 5 10 15 20
Time / month 0 5 Time / month 10 15 20
1 10 100 1,000 10,000 100,000 1,000,000 10,000,000 100,000,000
0 5 10 15 20
Case
c
oun
t
Time / month
74M
3.1M
3.6M
27k
0.2M
0.7k
No action
Action after 2.5 month,
5) An Economic Crash Kills, too
Actions taken to “flatten the curve” are unprecedented and so are their costs. Around the world, governments have initiated measures to contain or delay the spread but confirmed cases of infections continue to grow at alarming rates. The impact of pandemic containment measures and governmental restrictions on the world’s economy could lead to a loss of 4.5 – 7.7% of global GDP or 3.9 – 6.6 trillion USD in 2020 alone with travel, event and energy related industries being the hardest hit sectors.[12] Even these dire scenarios are based on the hope of a successful SARS-CoV-2 vaccine by the end of 2020. The IMF estimates that the pandemic costs will amount to 9 trillion USD for the 2020/21 two-year period [13]. The current lock-down’s cost to the global economy may exceed 40 billion USD per day or half a million USD per second. To put the numbers into perspective, according to World Bank statistics, in 2018 the combined GDP (nominal) of the smallest 150 economies corresponded to about 4.4 trillion USD per year. And the world median income in 2013 was 2’010 USD. Hence, per day the crisis eliminates more value than the workforce of 150 low to middle income economies generates during the pandemic and every second the yearly income of 250 average people evaporates.
Since governmental actions are focused on a “flatten the curve” strategy, economic consequences are currently not factored in. However, every economic downturn costs lives too, through many contributing factors. Unemployment numbers are rising already. In the US, just last week 5.2 million people filed unemployment claims, wiping out the entire job gains of the last decade. Unemployment is known to be associated with a significantly increased death risk due to heart diseases (+15 – 30%), depressive symptoms (+30%) or stroke (+32%). But not only the unemployed suffer. A good health system, clean water, healthy nutrition and hygiene are costly features of our modern societies, which cannot be sustained at the current level during and after a deep recession. It is obvious that life expectancy increases with GDP, a correlation well established as the Preston-curve [14]. A “just accepted” manuscript correspondingly claims that long-term shutdowns “would cause a loss of life years … that would dwarf the predicted toll” of a no-action scenario [15]. Finally, there is an immediate effect of shutdowns on life particularly in low-income countries where day laborers are at risk of starving, since their survival depends on paying for food with the day’s income. The UN estimates that hundreds of thousands of children might die this year due to the economic downturn, as 369M children in 143 countries do not have access to school lunches anymore. All this evidence suggests that the “flatten the curve” strategy orientated on hospital capacities needs some adjustment. And for later this year, the projections are darkening even more. The latest statement of the Executive director of the UN World Food Program (WFP) warned of a “hunger pandemic”. In the wake of CoVID-19 induced shutdowns, additional 135M people might be pushed to the brink of starvation [16].
Anecdotal evidence indicates that individual views of a right or wrong strategy strongly depend on personal circumstances. Older cohorts of the population lean towards a strict curfew, since the personal risk assessment for CoVID-19 is negative and retirement checks only indirectly dependent on the world’s economy. However, if your economic existence or survival depends on the next month or even day’s pay, your view of governmental actions will be very different. We seem to be stuck between a rock and a hard place with the choice of death by corona or death by poverty.
The good news is that we don’t need to choose. Available data suggest that there is a better option at hand combining both: low death rate and a (nearly) normal life.
[12] COVID-19: Briefing materials, McKinsey & Company, March 25th 2020.
https://www.mckinsey.com/~/media/McKinsey/Business%20Functions/Risk/Our%20Insights/COVID%2019%20I mplications%20for%20business/COVID%2019%20March%2030/COVID-19-Facts-and-Insights-March-25-v4.ashx
[13] www.imf.org/en/News/Articles/2020/04/14/tr041420-transcript-of-april-2020-world-economic-outlook-press-briefing
[14] With GDP also increases the level of education, which in turn also leads to an increased life expectancy: W. Lutz, E. Kebede. „Education and Health: Redrawing the Preston Curve“. Pop. Dev. Review2018, 44, 343 – 361. [15] P. Thomas. „J-value assessment of how best to combat Covid-19“. Nanotech. Perceptions2020, just accepted.
www.jvalue.co.uk/papers/J-value-assessment-of-combating-Covid-19.pdf
Part II: A New Hope
6) The (not so) Hidden Clues
The virus instilled in the world a rare global consensus: the current pandemic requires swift worldwide action. However, due to a lack of preparation for such an event, the best strategy is up for debate. Can we save lives and make sure that the remedy is not worse than the disease? While most country’s focus is currently internal and governments are busy explaining why their strategy is superior, a not so far-fetched approach is to look at all countries and determine which ones are doing best. If one can identify common traits in their strategies, this might lead to a foundation to build on. Learning from the best. But who is that?
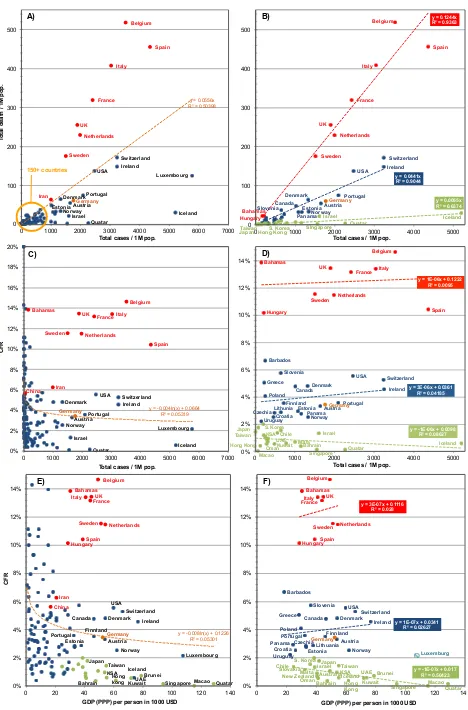
Global statistics on the pandemic are available, e.g. from the John Hopkins University [17] or worldometer.com [18]. Best-performers should be considered to be countries where the fatality and case numbers are lowest [19]. Where both numbers are low, actions taken are working well. To make data comparable, numbers should be normalized to population (e.g. cases per 1M population, Figure 5). A surprisingly high proportion of the world achieves the obvious target of low case and fatality numbers (Figure 5A). For only 20 countries the confirmed cases exceed 0.1 % of their population and generally, fatalities increase with the number of confirmed cases, as expected. From the graph it is obvious that particularly the strong Western economies have not only high case numbers, but also over-proportional fatalities. Particularly hard hit are countries where super-spreading events like soccer games (Italy and Spain) or church meetings (France) aided the virus in conquering territory. They are followed by those countries, where actions came late or slow (Sweden, Netherlands, UK, Belgium with the US catching up). This observation already teaches two important lessons:
1. Super spreading events, where large number of people come into close contact for longer periods of time, exhaling forcefully, singing and possibly sharing food are very high risk events and should be prevented.
2. When dealing with exponential growth, early and swift action is key and even just a few days of decision-making can worsen the situation dramatically. Hence, plans need to be prepared for the future, detailing how to deal with a potential pandemic. These plans should consider various factors including transmission path, reproductive number, case fatality rate and required health system engagement and provide tailored actions, preferably on a global scale.
However, of particular interest are those countries where the numbers are low. A focus on high-income countries (HICs) excludes territories, where either SARS-CoV-2 only recently arrived, or sufficient testing is not available (Figure 5B). Countries with particularly low numbers (except for Iceland, which has low fatalities due to an infected cohort of predominantly young people that returned form skiing holidays) are either in remote locations (Chile, Malta, New Zealand, Australia, Brunei and to some extent Israel), or had prior encounters with SARS and/or MERS (Asian and Middle Eastern countries). While the first group might just be lucky to be geographically privileged, it seems that the latter group used its experience gained through previous pandemics to its advantage. Some Middle Eastern countries also benefited form later arrival of the virus, yet the Asian countries were among the first hit due to their geographical proximity and trading ties to China. Common characteristics shared particularly among the Asian HICs can be identified on the governmental and the social or personal level. Governmental responses were early and implemented quickly. They include clear communication of risk and strategy to its people, fast ramp-up of testing capacity, which together with a tracing & isolation strategy helped to contain the virus efficiently. On a personal level, the Asian population is accustomed to wearing masks even when infected with an ordinary cold (corona) virus as it is considered a social duty to protect others. Correspondingly, after the first warnings, mouth and nose-coverage reached close to 100%. This was supported by stringent hygiene, hand disinfection and social distancing which also is more natural to Asian than to (South-) European cultures. Just compare the greeting ceremonies of French, Spanish or Italians with those of Thai, Japanese or South Koreans.
[17] https://coronavirus.jhu.edu
[18] https://www.worldometers.info/coronavirus/
Figure 5. Representation of statistical data of the CoVID-19 pandemic as of April 22nd 2020. Countries with a population < 250’000, or where no data are available on worldometer.com are excluded. A) Correlation of worldwide
Austria Belgium Denmark Estonia France Germany Iceland Iran Ireland Israel Italy Luxembourg Netherlands Norway Portugal Quatar Spain
Sweden Switzerland UK
USA
y = 0.0556x R² = 0.50398
0 100 200 300 400 500
0 1000 2000 3000 4000 5000 6000 7000
To ta l d ea th / 1M pop.
Total cases / 1M pop.
Bahamas Belgium France Hungary Italy Netherlands Spain Sweden UK Austria Canada Denmark Estonia Germany Ireland Norway Panama Portugal Slovenia Switzerland USA 17.4 3.5 Hong Kong Iceland Israel
Japan S. Korea
Quatar SIngapore
Taiwan
y = 0.1244x R² = 0.9363
y = 0.0441x R² = 0.9044
y = 0.0055x R² = 0.6374
0 100 200 300 400 500
0 1000 2000 3000 4000 5000
Total cases / 1M pop.
Austria Bahamas Belgium China Denmark France Germany Iceland Iran Ireland Israel Italy Luxembourg Netherlands Norway Portugal Quatar Spain Sweden Switzerland UK USA
y = -0.004ln(x) + 0.0664 R² = 0.05319
0% 2% 4% 6% 8% 10% 12% 14% 16% 18% 20%
0 1000 2000 3000 4000 5000 6000 7000
C
FR
Total cases / 1M pop.
Bahamas Belgium France Hungary Italy Netherlands Spain Sweden UK Austria Canada Czechia Denmark Estonia
Finnland Germany Greece Ireland Lithunia Norway Panama Poland Portugal Slovenia Switzerland USA Croatia Barbados Uruguay Bahrain Chile
Hong Kong Iceland
Israel Japan
Kuwait Malta
Oman Quatar
S. Korea KSA Singapore Taiwan UAE Macao
y = 1E-06x + 0.1222 R² = 0.0095
y = 3E-06x + 0.0361 R² = 0.04185
y = -1E-06x + 0.0098 R² = 0.08627
0% 2% 4% 6% 8% 10% 12% 14%
0 1000 2000 3000 4000 5000
Total cases / 1M pop.
Austria Bahamas Bahrain Belgium Brunei Canada China Denmark Estonia Finnland France Germany Hong kong Hungary Iceland Iran Ireland Italy Japan Kuwait Luxembourg Netherlands Norway Portugal Quatar KSA Singapore Spain Sweden Switzerland Taiwan UAE UK USA Macao y = -0.008ln(x) + 0.1226
R² = 0.05301
0% 2% 4% 6% 8% 10% 12% 14%
0 20 40 60 80 100 120 140
C
FR
GDP (PPP) per person in 1000 USD
Bahamas Belgium France Hungary Italy Netherlands Spain Sweden UK Austria Canada Czechia Denmark Estonia Finnland Germany Greece Ireland Lithuania Norway Panama Poland Portugal Slovenia Switzerland USA Croatia Barbados Uruguay Australia Bahrain Brunei Chile Hong Kong Iceland Israel Japan
Kuwait New Zealand Malta
Oman
Quatar S. Korea
KSA
Singapore Slovakia Taiwan UAE
Macao Luxemburg
y = 3E-07x + 0.1116 R² = 0.028
y = 1E-07x + 0.0341 R² = 0.02627
y = -1E-07x + 0.017 R² = 0.50423
0% 2% 4% 6% 8% 10% 12% 14%
0 20 40 60 80 100 120 140
GDP (PPP) per person in 1000 USD
A) B)
C) D)
E) F)
data for total cases and total death for all countries; red dots represent countries with significantly higher case fatality rates, CFR. B) as A, but only for high income countries (HIC) as classified by the world bank; red group: CFR > 6%, blue 2% < CFR < 6%; green group: CFR < 2 %. C) CFR vs. total cases for all countries; Color code as in A). D) CFR vs. total cases for HIC; Color code as in B). E) CFR vs. GDP (PPP) per person for all countries. Color code as in A). F) CFR vs. GDP (PPP) per person for HIC; Color code as in B).
Interestingly, none of the Asian HIC governments ordered a lock-down or curfew of the type most Western countries are facing. Apparently, if case numbers are low enough a technology driven tracing & isolation strategy can prevent the exponential pandemic spread without crippling the economy. South Korea and Taiwan in particular are demonstrating, how well such a tracing & isolation strategy can work, if the necessary technology is implemented and backed up by a convinced and participating population. An excerpt from South Korea’s tracing results including the identification of clusters is impressive to read [20]. In one case, even all the contacts and follow-up clusters of a super spreader could be tracked down and tested. This “patient 31”, while unknowingly being infected, participated in a church service and used public transportation several times. On the other hand, in the last few days, numbers are on the rise again in Japan, which is not tracing as consequently as other Asian countries are.
Learning form the best provides us with further insights:
3. As long as numbers are low, a tracing & isolation strategy is sufficient and may be implemented avoiding extensive economic damage.
4. On a governmental level, efficient measures are:
a. initiate clear communication of threat, counter measures and reasons behind them b. provide sufficient resources to boost testing and hospital capacities
c. follow a technology driven, stringent tracing and isolation strategy
A closer look at the data reveals some checkpoints for anti-virus campaigns. Globally, CFRs fall with reported case numbers, which is indicative of the problems many low and middle-income countries face with their testing capacities (Figure 5C) [21]. If again only HICs are considered, they roughly fall into three groups: those with low CFR (below or at 2%) those with moderate CFR (2 – 6%) and those with high CFR (over 6 %). The low CFR group consists of the “best performing countries”, which reach in average a CFR of only 0.5%. Countries reporting declining infections average just above 1%. These countries have clearly overcome the exponential phase where fatalities necessarily lag behind infections. Apparently, if the stress on the health system is kept low, fatalities might be pushed down well below 1%, e.g. with the help of some in-development anti-viral treatments. The middle CFR group in average reports a CFR of roughly 4 %, which shows a clear rising trend with increasing cases numbers. This points towards stress on the health system and a significant hidden figure. The high CFR group combines countries, where both, health system and testing capacity are not able to combat the pandemic. As a result, the reported average CFR of this group reaches 12%. Reported infections in average increase when going from the low to the middle and the high CFR group, with the notable exception of Iceland (mainly the young are infected) in the low CFR group and Hungary and Bahamas in the high CFR group. Interestingly, some countries in the middle CFR group such as Germany were initially following a tracing & isolation approach, but had to switch to a shutdown when the numbers outran the relatively low-tech approach used (e.g. mobile tracing apps were not implemented due to data protection concerns).
The correlation of CFR with GDP does not provide a clear decrease in mortality with increasing wealth, as is common for many infections. This reflects the higher average age in HIC and the current lack of pharmaceutical weaponry, equalizing to some extent the rich and the poor in this crisis. The rise in confirmed infections and CFR with GDP observed in HICs might result from higher involvement of these nations in trade and travel. Hence, these countries were hit earlier and imported more cases in the beginning, jumping the lag-phase in the early stage of the exponential growth curve.
[20] https://graphics.reuters.com/CHINA-HEALTH-SOUTHKOREA-CLUSTERS/0100B5G33SB/index.html [21] Due to large inconsistencies in reported recovered cases, case fatality rates (CFR) are estimated as the
Finally, we can extract some insights form this examination, which are illustrated in Figure 6:
5. A tracing & isolation strategy is efficient, as long as cases can be kept below a certain threshold. After the threshold is passed, quick implementation of shutdown measures is the only option left. Modern technology including mobile tracing can lift that threshold significantly.
6. As expected, mortality rises dramatically, if case numbers exceed the capacity of the health care system.
7. With low stress on the health system, a CFR below 1% should be realistic.
Figure 6. Illustration of the influence of different scenarios, resulting case numbers and their influence on CFR and strategic options. When the curves start bending down, a reproduction rate of R<1 is achieved. Not, that in the immediate action scenario (green), R = 1 is sufficient (horizontal curve), which in turn means that measures can be less restrictive than in the two other scenarios.
7) How to get along with SARS-CoV-2
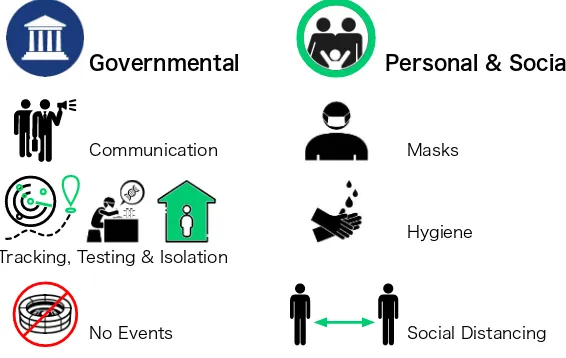
It is obvious that the tracing & isolation strategy is clearly superior to other approaches. It reduces case numbers as well as fatalities, and avoids the economic annihilation associated with a long-term shutdown. To make it work effectively high testing capacities are required. Hence it is best termed a tracing, testing and isolation (TTI) approach, which needs to be supplemented by actions on the social and personal level. In brief, the future strategy for a life with, instead of under, SARS-CoV-2 should combine:
1. on a governmental level, a TTI approach based on: a. clear communication and explanation of measures
b. identification of infected and retrospective tracing of contact population c. fostering testing capacities and supply of required resources
d. isolation of infected persons and all contacts until test results are available e. general restriction of large gatherings
f. where infection chain tracing fails, quick implementation of local shut-down measures.
2. on a personal level:
a. wearing masks whenever in contact with persons outside of the household b. social distancing measures
c. hand washing after outside contacts and frequent disinfections of surfaces
While the pandemic progresses, additional solutions, which make social distancing more natural, might become standard. Examples are an increase in home office time or online grocery shopping. This might boost new industries supporting these trends such as home-learning applications or drone delivery. Overall, as long as infections remain below the limits of the TTI strategy, stress on health care systems is low, and a quasi-normal life including school, work, shopping and even travel can go on. The combined measures only need to reduce the reproduction rate to or below 1. Each of the above measures contributes a varying amount but, for an infection with a natural reproduction rate of R0 = 3, each of the
Limit of tracking & isolation strategy Limit of health care system
tracking & isolation shut-down moderate CFR rapidly rising CFR case numbers
individual response times no-action scenario
late and slow action scenario
delayd but rapid action scenario
seven measures just needs to reduce the transmission risk by a little more than 15% to avoid entering the exponential growth phase again!
However, some restriction will need to remain in place. The super-spreading capacity of events like tournaments, gatherings, happenings or larger party events has proven to be lethal and quickly boost the CoVID-19 reproduction rate. Hence, such events can only take place again after a sufficient level of immunity is reached. Family events, smaller birthday parties and even visits of theaters should be possible, if the measures on the personal level are followed appropriately.
International travel and exchange can resume as soon as tracing beyond borders is possible. While the international exchange of data collected from citizens is always a delicate topic, exchange might just involve the inter-country notification that a recent visitor was found to be infected, or a person had a positive contact while visiting. Further actions can rely on in-country data. When comparing travel options, the personal car and air travel seem to come out best. Available data suggest that the virus needs at least 15 min to enter a cell [22] and a certain load is required to overwhelm the immune system by exponential growth (the same effect that wrecks our health care systems also outruns our immune system). While a car minimizes the contact to other people, an aircraft minimizes exposure. The travel time is very short, and the cabin air of a commercial airliner is exchanged roughly every 2 min., which is much quicker than in most other indoor environments. Also, side-by-side seating has a lower virus transmission risk than opposite seating.
A recommendation for risk groups might be to take extra care regarding social activities. However, as long as the TTI strategy keeps numbers low, the personal risk of infection should be marginal – presumably in the range of 1 in 100’000 every month.
Figure 6. Infographic illustrating the main elements of a TTI-strategy for minimizing fatalities and economic impact of the CoVID-19 pandemic. Assuming that the individual measures act independently, the overall effect of the combined measures can be calculated by the following equation: 𝑡𝑜𝑡𝑎𝑙 𝑒𝑓𝑓𝑒𝑐𝑡= !!!!𝑇𝑅𝐹!, with TRFi being the transmission reduction
factor of measure i. If the total effect is larger than R0, the pandemic is stationary.
For n equally effective measures, the minimal TRF to stop the pandemic form spreading is calculated according to: 𝑇𝑅𝐹!"#=𝑅!
!!/!
8) A Note on Tracing and Testing
A functional tracing system is the key-element of keeping case numbers at bay. It depends on well-equipped testing facilities providing the necessary capacities and should be supplemented with other measures, particularly on a personal level. To ensure that tracing is effective, sharing of mobile positions is indispensable. However, the loss of privacy when sharing location data with governmental agencies seems a small trade of compared to the otherwise drastic restrictions in personal freedom that go along with the alternative of a (partial) lock-down.
The beauty of the TTS strategy is its built-in early alarm system: as long as infection chains are trackable, the pandemic is under control. A loss in trackability of infection chains signals that the pandemic is emerging again, well before the numbers are rising. Tracing also identifies the region of the outbreak and local restrictions may be swiftly implemented until control is regained. Tracing will further facilitate notification of changes in regulations when crossing into another jurisdiction. Taken together, mobile tracing enables a finer granularity of measures reducing the economic impact. As stated above, a cross-border tracing is necessary to allow free travel without cross-border quarantine.
What make a TTS strategy even more appealing are its costs. The low level of infrastructural requirements makes implementation feasible even in middle- and low-income countries, so long as a mobile network is available. The costs and logistics of the accompanying test systems are presumably prohibitive for many poorer countries. However, the TTS strategy also takes a lot of stress from the testing infrastructure, since as long as infection chains can be tracked, testing resources can be focused. And the richer economies should come to the conclusion that installing and maintaining CoVID-19 testing facilities in poor countries is cheaper than a constant spillback of infections or other measures to avoid them, e.g. travel restrictions.
Generally new approaches for testing should be available soon and these should decrease costs as well as turnaround time. Approaches include installation of tests on existing high throughput platforms or integration of the process as lab-on-a-chip technology. Particularly the later approach reduces times, since the small masses allow much faster heating and consequently shorter PCR cycle times. Sufficient test capacities should be used for daily testing of highly exposed clinic and nursing staff. This not only helps maintain the health of this valuable group, it particularly reduces viral transmissions rates in clinics and retirement homes and thus protects high-risk groups. For daily routine test of health personnel, pooling test set-up can further enhance the capacities. While antibody tests might help in the future to get a better knowledge of the hidden figures and pandemic dynamics, or provide valuable information about the immunization status of clinic personnel, currently available test systems are still relatively unreliable. Particularly false positive results due to crossover reactivity with immunization reactions caused by exposure to other coronaviruses endemic to humans present the major challenge here.
Equipped with a plan of how to master the corona crisis, we should ask what we could learn from this epochal event for our future.
Part III: The Return of Pathogen Research
9) The Message is: More research!
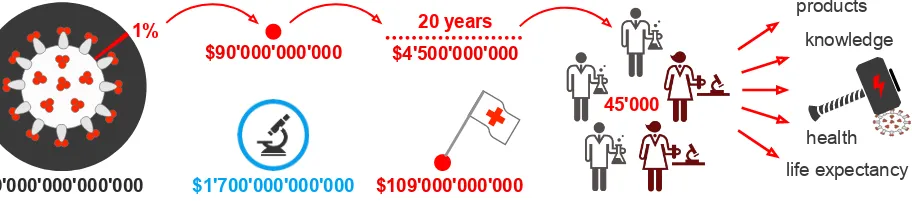
As outlined in Part I of this trilogy, too many warning bells were ignored before SARS-CoV-2 became a message too loud to be overheard. That message clearly states: do more research! Here are once more numbers to put this message into perspective: the total research budget of the entire planet amounts to $1.7T per year [23], which is about one fifth of the $9T this crisis will cost us during the next two years. The $109 billion yearly global R&D budget spent on health is dwarfed by the cost of the pandemic. 84 full years of health related research and development, at the current spending level, could be supported by the cost of the crisis. These costs don’t even factor in the fact that money spent on research usually brings (i) an economic return from the products developed; (ii) better health; and (iii) greater life expectancy to name a few. And these benefits often create a value surpassing the initial R&D costs.
However, the major tranche of R&D budgets is spent by companies, which must make profit to survive. And here is the catch: research into pandemic related problems most of the time cannot generate a product that pays for its development cost. Why? Because pandemics are mostly unpredictable one-time events – which is relieving to hear in the current situation. Exceptions are the yearly flu waves resulting from the sickeningly high error-rate of the influenza virus’ reverse transcriptase, among other factors [24].
[23] uis.unesco.org/apps/visualisations/research-and-development-spending/
[24] The mutation-induced change of viral surface proteins is known as antigen drift. Particularly influenza A virus also show an antigen shift on top, which basically means that two viruses infecting the same cell simultaneously may exchange some of their genes, leading to new combinations oft the two hull proteins. For more information, see Arbeitskreis Blut, Untergruppe «Bewertung Blutassoziierter Krankheitserreger». “Influenza
Since companies cannot sustain pandemic related research, others must step in. An outstanding role-models in that respect is the Bill & Melinda Gates foundation, which has not only urged us not to close our eyes before the looming threat of a pandemic but also allocated significant amounts of money for related research. However, considering the bill this pandemic presents to the global society, private foundations can provide valuable impulses but in the end tax-payers money has to be allocated.
Here is a non-complete list of “neglected” research areas, where increased research budgets could have given us a head-start:
1) vaccination
2) pharmaceutical targets in zoonotic viruses (other than influenza and HIV) 3) cheap and adaptable viral exposure test
4) emergence of zoonotic viral diseases 5) global pandemic plans and models
6) antibiotics (not for now, but a sure threat in the near future)
7) infrastructural requirements, e.g. GMP manufacturing processes and cold chain tracing [25]
It might sound surprising that such areas were neglected. But the industrial focus on non-communicable diseases (NCDs) like cancer, diabetes, cardiovascular, stroke, Alzheimer’s disease or even obesity also funnels a lot of public research funding in that direction. The reasons are plausible: in normal times, more than 70% of the world population die of NCDs [26], and even CoVID-19 will not change that figure significantly – if the containment measures are effective. Because most research is done in the areas of NCDs, publications with another focus are not well cited and hence do not accelerate but rather prevent the career of a scientist who is living under a publish (high impact) or perish regime. In the times before SARS-CoV-2 I talked to many collages about this issue. Nobody was willing to do much research in these neglected areas, including us. Such research endeavors seemed unsexy and not rewarding enough. A vaccination-related project only got initiated, because the methodology was in line with a running project and accidentally had ties to vaccine design. It did lay nearly dormant until February this year – and suddenly like many related projects around the world, it started to flourish. However, it cannot be expected that the current excitement for these research topics will outlast the pandemic for long. The ‘low hanging fruits’ in the area will all be collected, and the pharmaceutical industry will return to its high-value proposition projects.
A substantial increase in governmental funding is required to sustainably change the situation. People follow the money; this is particularly true for scientists. Without funding, no publications, hence scientists perish. Available funding attracts scientist to work in an area, even if publications are not among the most highly cited. Larger numbers of active researchers will slowly but steadily increases the appeal of the field for others since the growing community guaranties higher impact. Just imagine, if only 1 % of the estimated costs of the corona crises were spent on these seven neglected research topics, distributed over the last 20 years. The 4.5 billion USD increase in research money could have funded the research of 45’000 scientists generating basic knowledge and developing solutions (figure 8).
Figure 8. Comparison of CoVID-19 cost with global annual R&D spending and the amount of that spent on health R&D. Just 1% of the bill of the current crisis could support the research of 45’000 scientist for 20 years.
Let’s have a look what actually is missing in the neglected pandemic research areas.
[25] For WHO recommendations on vaccine management, see:
www.who.int/immunization/programmes_systems/supply_chain/evm/en/index1.html. For cold chain requirements in vaccination campaigns, see: www.who.int/immunization/documents/IIP2015_Module2.pdf [26] www.who.int/news-room/fact-sheets/detail/noncommunicable-diseases
$9'000'000'000'000
1% 20 years
$109'000'000'000
$90'000'000'000 $4'500'000'000
$1'700'000'000'000
45'000
products knowledge
10) A Note on Vaccination Development
While vaccines are among the most cost-effective and beneficial developments for public health [27], for a long time vaccines development has not been high on the priority list of pharmaceutical companies. Only recent outbreaks of infectious diseases, like influenza, swine flu, hepatitis, tuberculosis, diphtheria, Ebola, and meningococcal and pneumococcal diseases, have led to more activity beyond established processes. The market has nearly doubled since 2014 generating a respectable 55 billion revenue in 2019. However, development costs involving clinical trials are extremely high and the major markets are in low-income countries. Hence, companies still have little incentive to develop vaccines for most diseases because there is little revenue potential. Even in HICs, financial returns are usually minimal and the economic and research risks are great [28].
This research hibernation has changed substantially within just a few weeks. The CoVID-19 crisis conjured a market of 8 billion potential customers making vaccine development attractive but not a winner takes it all situation. The projected demand of the vaccine vastly exceeds any existing production capacity. Previous large mass vaccination campaigns have reached around 10 million people, requiring several suppliers to be able to provide the shots. The CoVID-19 scale is at least 500 times bigger – a lot of room for many companies, even if they were not among the first to successfully develop a vaccine. And there is another component to it. If 100’000 doctors and nurses were doing vaccinations for 1 year, they would need to administer a shot every 4 minutes during a 10 hr. workday on a seven day per week schedule. We can conclude that GMP manufacturing and administration capacities will need to be stocked up in parallel to research progress.
Vaccines are sensitive biological products. Therefore, an effective vaccine storage and transportation management needs to in place as poorly developed transportation networks may cause exposure to heat and light and thereby inactivation of the vaccines. As such the vaccine potency can diminish or be lost when the vaccine is exposed to inappropriate temperatures. It is therefore of importance that the cold chain (the temperature-controlled supply chain) is uninterrupted and fully monitored during storage and distribution from the manufacturer to the vaccine recipients. While the vaccine supply chain and logistics are more or less established in HICs, it can be a considerable challenge to guarantee the appropriate cold chain in middle- and low-income countries with poor infrastructure.
Due to a lack of knowledge, a lot of research is currently needed to bring a vaccine to the market. The combined efforts of scientists around the world have already generated over 160 drug and vaccine candidates [29]. However, from candidate to market is a very long way. Many substances are added to a vaccine formulation, and each one needs to undergo lengthy authorization procedures. Not only the substance but also the whole production process needs approval by the agencies in charge. That’s another area where the lack of research bites back. Several substances for vaccine formulations were approved back in the first part of the last century. However, new promising methods like mRNA vaccination rely on new ingredients e.g. to facilitate delivery of the immunogenic polynucleotide. Unfortunately, most of these chemicals are not yet approved, as lack of money prevented them from entering the necessary clinical trials.
An additional complication arises from a strong publication bias in academic research. This is a general problem but it is particularly wide spread in medical-related fields. The full development of a functioning vaccine reaches far beyond the capacity of academic research groups as a complex mix of interdisciplinary expertise is needed; a plethora of testing methods and regulations are required; and finally costs rise exponentially during the progressive stages of such a project. As a result, many available studies suffer from a low reproducibility, superficiality or even data fabrication. A recent review summarized the situation as follows: “low reproducibility of the currently published outcomes, especially, in drug development field, resulted from the inappropriate designs with little practical rationality combined with the positive result-oriented publishing bias and the misconception of “research for publication”, sets up also a huge barrier to translation of bench work to bed therapy” [30]. Another investigation of the
[27] O. F. Olesen, A. Lonnroth, B.Mulligan. “Human vaccine research in the European Union”. Vaccine. 2009, 27, 640 – 645. doi:10.1016/j.vaccine.2008.11.064
[28] S. Hussain. „Immunization and Vaccination“, pg. 153-177. In: D. Huremović (Ed.) “Psychiatry of Pandemics. A Mental Health Response to Infection Outbreak”. Springer, Heidelberg 2019.
[29] www.genengnews.com/a-lists/vanquishing-the-virus-160-covid-19-drug-and-vaccine-candidates-in-development.
publication system in the medical field concludes: “The production of systematic reviews and meta-analyses has reached epidemic proportions. Possibly, the large majority of produced systematic reviews and meta-analyses are unnecessary, misleading, and/or conflicted.” [31] Clearly, publication bias is a result of the current funding system and is detrimental to the field. More available recourse, allowing academic researchers to focus on long-term high quality dissemination rather than on high quantities might reduce the problem.
11) A Brief Note on Emerging Models and Pandemic Plans
What took most people by surprise is the apparent lack of pandemic plans everyone assumed to be ready in the drawers of governments. Again: warning bells were ignored. Sure enough, virologists have developed some models in recent years and have written plans that were sent to ministries where they no doubt ended up collecting dust. However, since fast reaction times make all the difference in the outcome of pandemics, a more systematic and global approach should be undertaken. Such plans should include model predictions detailing the reduction of transmission rates through individual measures for a given transmission path and taking the cultural background of the population into account. Also, the technologies for all potential actions need to be available, or even better in place, and their use should be in agreement with governing laws. If actions were globally coordinated, swift and tailored implementation of selective measures could prevent the world from slipping into the next pandemic. Global coordination based on a pre-established plan would circumvent unproductive finger-pointing and egoistic actions in the future. On a side note, it is absolutely depressing, how little trans-national organizations like the EU or WHO were able to provide solutions to this global shock that needs an international strategy like no other crises within at least the last half century.
12) Of Pathogens and Antibiotics
If you had asked us three months ago, we would have considered the greatest pandemic threat to be the emergence of multidrug resistant bacterial strains flourishing in our hospitals. Apparently, We were wrong for now. However, the threat is real and it is growing every day. According to a recent CDC report, more than 2.8 million antibiotic-resistant infections occur in the U.S. alone each year, and more than 35,000 people die as a result [32]. The situation is hardly better in other countries. Mortality and morbidity from resistant infections is on the rise globally, since our sharpest weaponry against bacterial infections is slowly becoming blunt. Hardly anyone is developing new antibiotics, as there is no business case for it and, for a scientist working in a university lab, antibiotic development is a particularly unrewarding topic. The pipeline for new antibiotics is running dry. But what makes antibiotic development so unattractive, that the vast majority of the large pharmaceutical companies have exited the field of antibiotic R&D and startup companies in the field struggle to attract capital? In short: economics. A new antibiotic has a hard time generating any revenues. To cite a recent review on the topic: “Sales volumes are limited by the short treatment duration inherent in antibiotic therapy, and local antimicrobial stewardship programs are increasingly restricting the use of antibiotics. A truly novel antibiotic would likely be reserved for rare infections caused by the most highly resistant strains of bacteria” [33]. And a myriad of other economic, regulatory, and scientific barriers exists, too.
Hence, governmental and privately funded projects are currently our best hope we have to avoid pandemics caused by multidrug resistant versions of bacteria that previously we had believed to never become a threat again. If governments don’t step forward with heavy investments into R&D targeting pandemic threats, the current CoVID-19 episode might just be the prelude to a much worse global era. While we do not know, if another zoonotic RNA virus will adapt to flourish in our bodies; a multidrug resistant bacteria will expand its territory from a dark hospital emergency room into the shiny world outside; or another microbe will emerge from a natural habitat, which was newly invaded by humans, we definitely know that money spent on science-based preparation and prevention will be our best defense. Because one thing is for sure: pandemic pathogens will strike again!
[31] J. P. A. Ioannidis. „The MASS Production of Redundant, Misleading, and Conflicting Systematic reviews and Meta-analysis“. The Millbank Quarterly2016, 94, 485-514.
[32] Antibiotics Resistance Threats in the US. CDC, 2019. www.cdc.gov/drugresistance/pdf/threats-report/2019-ar-threats-report-508.pdf
[33] M. Renwick, E. Mossialos. “What are the economic barriers of antibiotic R&D and how can we overcome them?”