http://www.sciencepublishinggroup.com/j/eas doi: 10.11648/j.eas.20190406.16
ISSN: 2575-2022 (Print); ISSN: 2575-1468 (Online)
Aircraft Cost Modelling, Integrated in a Multidisciplinary
Design Context
Davide Di Pasquale
1, *, David Gore
2, Mark Savill
1, Timoleon Kipouros
1, Carren Holden
2 1Centre for Aeronautics, School of Aerospace Transport and Manufacturing, Cranfield University, Cranfield, United Kingdom 2
Airbus Operation Ltd., Bristol, United Kingdom
Email address:
*
Corresponding author
To cite this article:
Davide Di Pasquale, David Gore, Mark Savill, Timoleon Kipouros, Carren Holden. Aircraft Cost Modelling, Integrated in a Multidisciplinary Design Context. Engineering and Applied Sciences. Vol. 4, No. 6, 2019, pp. 169-189. doi: 10.11648/j.eas.20190406.16
Received: September 18, 2019; Accepted: September 26, 2019; Published: December 17, 2019
Abstract:
Most of the current cost models focus on a particular manufacturing process or a specific maintenance aspect, therefore not providing the whole picture. The main challenge in modelling the manufacturing cost, associated to a new aircraft at the initial design stage, is to examine all the cost features and the way to link them into the decision making process. It is important to understand the cost related to different competing designs, and this can be tackled by including cost estimation in the design process. Estimating the cost at the early design stage is paramount to reduce the life cycle cost of the aircraft. This paper presents the development of a new methodology for the generation of a cost estimation approach for preliminary aircraft design in a multidisciplinary environment. The framework is able to capture the design attributes that drive the cost allowing a designer to assess cost changes with respect to different design configurations. The cost model is built in Excel using a Visual Basic interface and it is integrated within Model Centre platform, where it can be treated as a component of a computational design process. The paper concludes by presenting the results from a real wing trade-off study that includes all the components of a complete design system.Keywords:
Cost Engineering, Multidisciplinary Design, Design Integration1. Introduction
Cost is a factor of success in the product/service of many industries. Reducing cost may be essential for survival in today's competitive aircraft market. Companies are more frequently required to improve their quality, while maintaining or reducing their costs. Companies that do not provide cost estimates at the initial development phases have a higher probability for programs to fall behind schedule, which implies higher development costs [1].
Understanding the cost of a new project development before it actually starts, can make the difference between success and failure. Commonly, cost regards the amount of money expended with delivery of products and it should cover any expenditure of time, human, material and tooling resources, from a total cost management perspective [2].
Cost Engineering is related with cost estimation and cost control, and supports companies in decision making. Cost
estimators need companywide cooperation and support. Concurrent engineering can assist this process. A concurrent engineering environment has been recently widely adopted and gives a chance to lessen the total cost of a project. A fully integrated product development cycle, with multidisciplinary teams working together, increases the probability of a reduced life cycle cost by avoiding costly modifications late in the design process.
2. Context
17%, making it the largest in Europe and second only to the US internationally. Aircraft manufacturer has now realized that this demand to reduce cost and lead-time needs to be addressed at the conceptual and preliminary engineering design stage. It is widely agreed that 65–80% of the total avoidable cost is controllable at the early design stage and indeed many authors agree that conceptual and preliminary design have in hand the largest cost influence [4], see Figure 1.
Figure 1.The overall aircraft design development process phases related to product life-cycle cost, design knowledge and freedom [5].
A substantial part of the cost of a new product is therefore committed in the early design phase, before the actual cost of product development takes place. That means that although the design process accounts for only 10% of the overall product cost, it has an influence up to the 80%. Consequently, it is important that all the factors that influence the total cost of a product are taken into account at the initial design stage [6].
It is clear that the accuracy of a cost estimate increases with the number of information at disposal. In fact, a cost estimation is more precise as the project moves forward. On the other hand, cost is not really known upfront and a cost estimation method is needed. Nevertheless, during the design process, the full specifications of a product are not known, and hence, it is challenging to produce an accurate estimate. This occurrence is known as the paradox of cost estimation and illustrated in Figure 2.
Figure 2. The cost estimation paradox [7].
As the design process evolves, projects cumulate
man-hours and gain momentum and this makes it quite difficult to abort it despite a later detailed cost estimation exhibits an over-budget figure. Even during these later stages of design, designers typically optimize the functionality and then determine what the cost is, rather than performing a full optimization study including costs. If, after the detailed design stage, it is found that the design is too expensive, many companies try to reduce the cost, changing, for instance, materials or manufacturing process instead of re-designing for avoidable costs.
Consequently, a bad decision at early design stage could be greatly costly further down the development process, given that production modifications and process alterations are more expensive the later they occur. All these indicate that a more rigorous methodology is necessary in tackling the cost issue. Even if in other aspects of aerospace engineering, there has been a continually improving in data management and in computational modelling, primarily in Computational Fluid Dynamics (CFD) and Finite Element Modelling (FEM), still there is a lack of costing tools capable to better support designers in making reasonable decisions that are cost effective. While technology, in aerospace industry was the main driver in the past, nowadays there is demand of cost reduction to satisfy customers’ needs.
Recently, there has been expanding focus on the need to provide transparency in the costs of engineering programs, leading to increasing emphasis on whole-life cost modelling techniques. This is mainly due to the increased interest in longer-timescale projects and programs [8].
The main challenges faced by Airlines is to keep low the operating cost, providing high level of service, more frequency of flights to destinations and cheap air fares. Airline companies have to consider many actions, such as reducing the operating cost of their fleets and increasing the dispatch reliability in order to stay and make money from the business. All these depend upon how the aircraft are designed.
3. Cost in Aircraft Design
Costs are becoming an important factor and aerospace companies are looking forward to reduce the cost without compromising on performance [9]. As a consequence, engineering costing in the context of aircraft design must have a more important and influential role, for instance, as part of an integrated multidisciplinary process. The final aim is that aircraft design has to be driven by a well-balance trade-off between performance and cost that leads to an affordable and suitable product life cycle for the operators. The main challenge is to adapt and to take advantage of the tendency towards greater multidisciplinary focus in research and technology, especially utilizing cost as a metric in the overall process. The aim of the cost estimation methodology is to provide a basis for making a rough cost estimate based on low detail at the initial design stage of product design that can later be refined based on greater detail as it becomes available.
minimize the Gross Take-Off Weight (GTOW) in order to improve performance and consequently lowering operating cost, mainly through reduction of fuel burn. But this kind of approach does not assure the profitability of a given aircraft design, according to the aircraft manufacturer’s perspective [10]. In fact cost estimation based on weight does not rigorously represent the actual manufacturing cost and therefore it might not provide accurate sensitivity data as required in a multidisciplinary optimization process. In contrast, a weight reduction often results in cost increase, due to for instance to a requirement for additional machining time and finer tolerances as illustrated inFigure 3.
Figure 3. Example of the trade-off between cost and weight as a function of the performance of the structural part [10].
Indeed, manufacturing costs are much better related to structural layout and complexity than weight.
The cost of an airplane is the total amount of expenditure of resources, usually measured in dollars, necessary to manufacture that airplane.
The PRICE of an airplane is the amount of dollars paid for the airplane by airlines. PROFIT: PRICE – COST. The development of an airplane from design to manufacturing, operational and finally, disposal is regarded as airplane programme. It can be divided in six phases, as given in Roskam [11].
1. Planning and Conceptual design. Planning phase consists essentially of mission requirements research, which ultimately leads to a mission specification. Conceptual design here consists of the design activities related to preliminary design (preliminary sizing and preliminary configuration layout and propulsion system integration). Some very preliminary cost studies are also performed during this stage.
2. Preliminary Design and System Integration. Refinement of preliminary configuration (layout of wing, fuselage and empennage, weight, drag, polars, flap effects, stability and control, performance verification, Landing Gear (LG) disposition, propulsion system integration, cost calculations. Design studies are conducted to search out that combination of technology and cost that could lead to a practicable aircraft program.
3. Detail Design and Development. During this phase the airplane and system integration design is finalized for certification flight-testing and production.
4. Manufacturing and Acquisition. During this phase the airplane is manufactured and delivered to (or acquired
by) the customer.
5. Operation and Support. During this phase the airplane is being acquired by the user and is being operated with the accompanying support activities. (Phase 4 and 5 generally overlap), as it possible to see from Figure 4. It contributes largely at the total cost of aircraft life. 6. Disposal. This phase marks the end of the operational
life of the airplane. This activity can include destruction of airplane and disposal of the remaining material. Disposal becomes necessary when airplane has reached the limit of its technological or economical life. The time elapsed during the six phases of an airplane program is called Airplane Life Cycle (ALC). The total cost of an airplane program incurred during the airplane life cycle is called the Life Cycle Cost (LCC), in other words, the overall cost from its conception up to and including its disposal.
Figure 4. Variation of Life Cycle cost over time [12].
For preliminary cost estimating purposes the LCC of an airplane program is breakdown into four cost categories:
a) Research and development costs; (Phase 1, 2 3) b) Production and construction costs; (Phase 4) c) Operation and maintenance costs; (Phase 5) d) Retirement and disposal costs. (Phase 6)
Contingent upon the situation in the economic process, an alternate perspective is taken. A part provider, for example, may offer its item at the most reduced conceivable cost to remain competitive. Hence his goal is to limit the fabrication cost. The aircraft producer, at the same time, needs to give his client an aircraft that has low manufacturing and design cost, and competitive in term of operating cost. The airline in turn is interested in cost saving all through the aircraft lifetime, therefore looking at low acquisition, low operating and disposable costs.
4. Cost Definition
that ease this process are: (1) direct or indirect costs, (2) non-recurring or recurring.
4.1. Direct and Indirect Costs
A direct cost is an expenditure, which can be identified and specifically allocated to a product or service. Thereafter, they are more easily identified and associated with a product, or project. These costs are normally charged directly to a given contract in the way that procured items can be readily associated with the bill of material (BOM) for a specific aircraft unit. Direct costs can be allocated directly as the allocation base is known, the allocation base for indirect cost, which are the opposite of the direct, has to be determined. These costs may be difficult either to identify in the first instance or to be associated with a given operation or outcome. Conversely the indirect cost cannot be classified with a specific objective [15]. This implies that direct cost can be allocated directly as the allocation base is known, whilst the allocation base for the indirect cost has to be established. This makes identification and relationship of indirect cost with a specific objective troublesome in the first place. Still, indirect costs are required for undertaking an activity and are labelled as overheads or burdens and examples of these are cost of electric power, building works, cleaning, etc.
4.2. Recurring and Non-Recurring Costs
Recurring costs (RC) are expected to be incurred in a repeating fashion, whereas non-recurring costs are expected to
be incurred only once or only at certain intervals. Recurring costs are repetitive elements of development costs that may differ with the quantity produced. Examples of recurring costs include cost of raw material, engineering efforts required for re-design, alterations, rework, and replacement; tool maintenance; labor costs and training. It must be pointed out that the recurring costs per product unit should reduce with the production quantity increasing [16].
Non-recurring costs (NRC) are those elements of development and investment costs that normally occur one time in the life cycle of a product. A non-recurring cost is generally a capital expenditure, which occurs before the production takes place. Examples of non-recurring costs can include system test, pre-production activities, tool development, engineering models built for test purposes, and specialized training to the employees.
Estimating accuracy is normally improved when repetitive costs are estimated separately from the non-repetitive elements. Costs that have already been incurred and that are not likely to be necessary for the remainder of production, therefore, should be excluded from the estimated cost for the next unit to be produced. If the recurring and non-recurring costs are not properly segregated, then the estimate is likely to be over or understated.
4.3. Operating Cost of Airlines
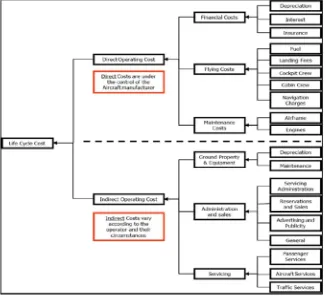
The operating costs of airlines are generally classified into Direct Operating Costs (DOC) and Indirect Operating Costs (IOC), see Figure 5.
The direct operating costs are commonly defined as the costs related with flying operations, and the maintenance and depreciation of the flying material. The indirect operating costs contain other operator costs such as maintenance and depreciation of ground properties and equipment, servicing, administration and sales. Operating cost consists of Financial, Flying and the Maintenance cost. The Financial cost is further decomposed to Depreciation, Insurance and Interest whereas Maintenance cost is decomposed to Airframe and Engine maintenance. The Flying cost includes Fuel, Landing Fees, Cockpit crew, Cabin crew and Navigation charges.
The depreciation, insurance and interest are financially orientated and are then in the cost model generated from the total aircraft price, which is in turn based on the aircraft production cost. The production cost includes the part manufacturing and assembly process cost, inclusive of labour and material cost. For assembly process, materials relate to additional parts or miscellaneous like fasteners. The element of crew, fees, and maintenance cost are operating oriented and are consequentially assessed based on the Airframe weight (AFW). Although the DOC constitute only one aspect of the economic profitability of an airliner, most attention is generally paid to this aspect, given that several factors contributing to the DOC are directly associated to the technical design and operational attributes of the airplane and therefore are partially under the direct control of the design team [17]. The objectives of a standardized method for the estimation of aircraft operating costs are:
1. to provide a way for comparing the operating economics of competitive aircraft and/or aircraft designs under a standard set of conditions.
2. to assist aircraft operators and aircraft manufacturer in evaluating the economic suitability of an airplane for operation on a specified flight path.
Crew costs is a considerable part of the DOC, but are in effect outside the control of the designer. Fuel is strictly linked to the aircraft engine performance and plane aerodynamic characteristics, yet additionally by the fuel price, which can differ significantly both with time and location. Maintenance cost is an important part of Aircraft Life cycle cost which can reach five times of the ownership cost and accounts for 10-20% of the Direct Operating cost which makes both the Aircraft manufacturers and Operators to control it. The Airplane Life cycle should summarize the Life cycle cost in Net Present Value (NPV) considering depreciation, taxes and time value of money. The most common element of the life cycle cost, which is used to compare aircraft performance in terms of economic performance, is Direct Operating Cost (DOC) that reflects profit and loss including aircraft depreciation.
In finance, the Net Present Value (NPV) of a time series of cash flows, both inflows and outflows. It is defined as the sum of the present values (PVs) of the individual cash flows of the same entity. Net Present Value is the most regularly used metrics in engineering program valuation. Net Present Value can be simply described as the difference between cash inflows and cash outflows. It compares the present value of
money today to the present value of money in future, taking into consideration inflation and returns. In general, a positive NPV indicates a good investment, and a negative NPV means that a program should not proceed. The Internal Rate of Return (IRR) is a rate of return used in capital budgeting in order to measuring and comparing the investment profitability. The term internal relates to the fact that its calculation does not take into account environmental factors such as the inflation or interest rate. The net present value is calculated as follows:
= ∗ (1)
In other words, IRR is the discount rate, which balances the present value of the future cash flows of an investment with the initial investment. Return On Investment (ROI) is related to profits in relation to capital invested and Cash Operating Cost (COC) refers to the amount of cash that a company generates from the revenues it brings in, not considering costs related with long-term investment on capital items.
5. Overview of Different Cost Modelling
Approaches
Cost estimation is the method of creating a relationship between a cost object and its cost driver to predict the cost of a work activity. According to Niazi et al. [18], the first distinction in cost estimation is between qualitative and quantitative cost estimation techniques. Qualitative techniques estimate the cost based on earlier manufactured products, and scale the manufacturing cost based on similarities, conversely quantitative techniques depend on design features, material and manufacturing processes.
Traditionally, two main estimates exist: a “first-sight” estimate, which is done early in the cost phase, and a detailed or bottom-up estimate, to calculate cost more exactly later on. The first-sight estimate is largely based on similar project or simply on experience in costing.
To achieve a good level of experience takes years and significant amount of input from senior estimators. Even though useful for a crude estimate, it is quite subjective; hence more quantified and justified estimates are what is needed.
For detailed estimates, cost depend on several factors such as the number of operations, time per operations, labor, material and overheads cost. To generate these estimates an understanding of the product, the manufacturing processes and the relation between processes is required.
Detailed cost estimation has to go through an iterative loop because feedback from the relevant departments allows the estimates to be explored and improved over a certain timeframe.
However the most fundamental approaches used in aerospace industry to model cost are the followings:
1. Parametric Cost estimation
2. Generative or analytical Cost Estimation 3. Analogy based Cost estimation
4. Neural-Network-Based Cost estimation
5.1. Parametric Cost Estimating
Parametric cost models are normally related with cost techniques, which generate ‘Cost Estimating Relationships’ (CERs) together with mathematical algorithms or logics to build up cost estimates [21]. This methodology presumes that parametric cost modelling is based on data acquisition. This requires developing templates and identifying data sources. Most data for parametric cost modelling are obtained from engineers, process managers or other experts in companies. After gathering the data, there is the need to evaluate variables and respective data attached. By doing this, a choice is taken to identify variables, which change or are probable to change with time. This approach deals with identifying high-level relationships between the cost and the design parameters. The high-level design parameters are usually volume and mass. This approach has positive results towards well-defined class of components. This technique is used to estimate the cost associated with development, manufacture or modification of a final product. This approach has some limitations, the main drawbacks are:
1. A considerable amount of data is needed to identify parametric relationships. Another difficulty is the availability of adequate data.
2. The cost data should be filtered to remove the effects of inflation, exchange rate etc.
3. New manufacturing processes and changes to methods will results in an invalid the parametric relationships. 4. Limited resolution and cannot be applicable beyond
narrow class of components.
Nevertheless the above limitations, the parametric estimation approach has been adopted by many industries as method for costing estimation for their design, development and production of engineering projects. In the aerospace industry, parametric cost estimates play an important role in bidding and target cost estimation, whereas for most component manufacturing industries; parametric cost estimates are used to determine the cost of components [10]. To make a useful use of parametric models is important highlight that they should not be used outside their database range and should be used only after they have been checked. In addition they should not be used if a realistic data corresponding to cost drivers can be attained.
5.2. Generative Cost Estimating
This cost estimating techniques use the product definition to get the manufacturing sequence and to estimate the process times. During each phase of the development process, cost associated to resource and material consumption are determined, based on technical data.
This approach is further divided into feature recognition and feature based approach. The feature recognition approach is required when the product model is expressed in terms of design features whereas the feature based approach requires product definition to be constructed using a pre-defined set of features that have a direct mapping to manufacturing process. The feature-based cost estimation methodology deals with the identification of a product’s cost associated aspects and the determination of the related costs [22].
The main disadvantages of this approach are:
1. This approach depends on the details of design definition.
2. The algorithms used are time consuming and might have narrow capability.
3. This method does not allow the cost to be computed at very early stages of design.
In addition, the approach can have limitations for quite complex or really small geometric features, particularly if machining processes are used to produce these features.
5.3. Analogy Based Cost Estimating
The analogy based cost modelling method identifies a similar product or project and reuses cost information related with this entity to predict the cost of the new entity, considering readjustments for the differences between the two [23]. To be valid a sensible correlation between the proposed and the past product must exist, and the cost estimator makes a subjective evaluation of the differences between the new system of interest and the historical system. The analogy method is typically performed early in the cost estimating process, when there may be a limited number of historical data points and the cost estimator may be dealing with technology experiencing rapid technical change. The analogy method is also used for cross checking more detailed estimates. In preparing a cost estimate based on the analogy method, start by obtaining a technical evaluation of the differences between the systems from engineers or other experts. Afterwards, evaluate the cost impact of these technical differences and any other factors that might have changed since the existing model was designed and produced. Anyhow, the efficacy strongly depends on how accurate the historic data is and how accurate the difference between the two cases is established [24]. A main disadvantage of the analogy method is the subjectivity in quantifying the cost of the technical and other differences between the historical item and the new item. Nevertheless, the analogy method performs reasonable fast and it is a cheap way of estimating program costs and can be done at a high level of the Work Breakdown Structure (WBS) with relatively few technical detail of the new system.
5.4. Neural Network Cost Estimating
more influence to the final cost [25]. This is accomplished by training the system with data from past case scenarios. The software thereupon approximates the functional logical connections between the attribute values and the cost during the training. As soon as it is trained, the attribute values of a product under development are provided to the network, which applies the training data and computes a prospective cost. These systems can produce better cost estimates than conventional regression costing approaches. Nevertheless, in cases where a pertinent cost-estimating relationship can be identified, there are notable advantages in terms of accuracy, variability and model creation. If there are data available for training the system, models can be developed and used for estimating all phases of a product life cycle. A key advantage that a neural network has compared to parametric costing is that it is able to uncover relationships not easily identifiable among data. However, neural networks need a large case base to be useful, therefore they are not well suited to industries that produce limited product ranges. They do not cope easily
with novelty or innovation. In fact, the case base needs to be comprised of similar products, and new products need at least to be of a similar nature for the cost prediction to be effective.
6. Cost Requirements in a MDO Context
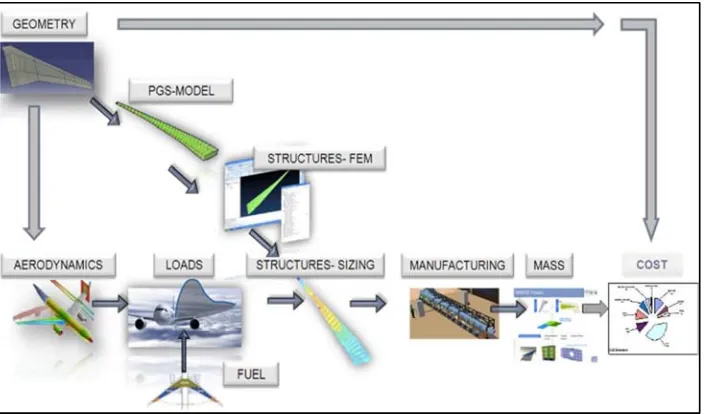
Most of the current cost models focus on a particular manufacturing process or a specific maintenance aspect, therefore not providing the whole picture. The main challenge in modelling the manufacturing cost associate to a new aircraft at initial design stage, is to investigate all the cost features and the way to link them into a decision making process. A design-oriented capability can be used to implement product changes that may reduce cost [26]. Cost modeling should be therefore integrated into the multidisciplinary design process together with other analyses to attain economic and efficient aircrafts [27]. Figure 6 shows an overview of the main disciplines involved in a preliminary design stage.
Figure 6. Overview of a multi-disciplinary process.
Multidisciplinary Design Optimization is a tool used in the design process to improve aircraft performance. It considers concurrently different disciplines such as Structures, Aerodynamics, Hydraulics, Propulsion, Weight etc. to achieve substantial benefits. Costs are becoming an important factor and aerospace companies are looking forward to reduce the cost without compromising on performance. Traditionally, multidisciplinary design analysis and optimisation methodologies have been applied at preliminary design mostly trading weight versus drag. The goal was to enhance direct operating cost, payload or speed by reducing structural mass without compromising performance. Even if lower aircraft weight is important, the process must take into consideration all the development phases including manufacturing processes and their related costs. It is critical that manufacturing costs are counted in any MDO process that is intended for serious use in the aircraft design. MDO has to enable the trade-off between the cost and performance, given
that is important to understand the cost associate with different competing concepts. In order to achieve it is necessary having product definition as an input to the cost model in order that any change in the design is reflected in the estimated cost.
The manufacturing cost should be broken down to Raw Material costs, Labor costs, Bought out items cost and Profit and Levies. The Flying cost should be broken down to Fuel, Landing fees, Cockpit crew, Cabin crew and Navigation charges. The cost model should be capable to calculate all the above-mentioned flying costs. Moreover, it needs to include recurring and non-recurring costs – e.g. fuel consumption and cost to build first aircraft – including development, tooling, design and production.
7. Description of the Cost Suite
The analysis of the available cost models showed that none is suitable for providing a MDO cost model. The current models have neither the flexibility nor the level of detailed required for dealing with the complex wing design problem. The main feature of the cost suite is that is able to capture the features of a design that drive the manufacturing cost, which generally is not only weight, but also the physical geometry of the aircraft. This enables the assembly and detailed manufacturing costs, to be established by means of a relatively detailed component layout by the use of Knowledge Based manufacturing rules. In addition, the parameters from one area have an impact on other areas e.g. the configuration of the
Aircraft has a direct influence on the required Design and Production Engineering Effort, as well as the costs required for Tooling. The Model Suite also takes into account the impact of a design on the Operational cost (particularly Maintenance) by taking into account the major features of the design generated as part of this process. Different types of flaps have been also implemented, (single slotted, fixed vain flap and double slotted flap), and several stringer types, to give better clarity to the impact of cost on competing design solutions.
The cost model is built in Excel using a Visual Basic interface [28]. The tool is designed and intended for use, early in the Design phase of an Aircraft, to estimate the change in cost when different design decisions are made. It is not designed to accurately predict the absolute cost, which is clearly down to the Finance office. Moreover, the cost suite does not take into account any disposal related cost.
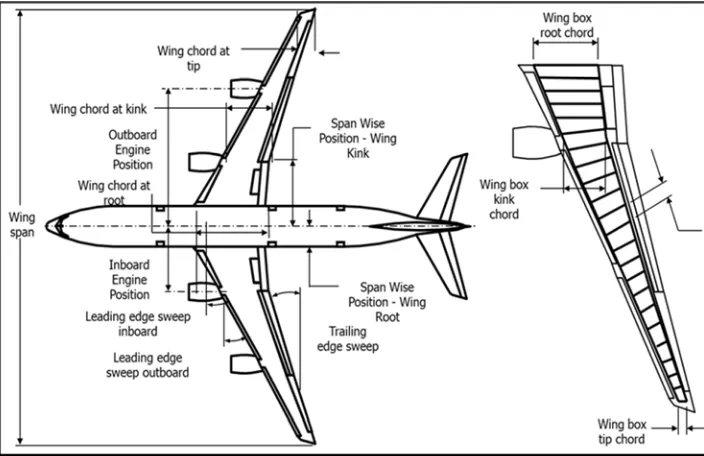
The starting point of any trade is a collection of parameters provided from an external data source. Firstly, a set of parameters is extracted from geometric models that are coupled with the cost model spreadsheets. The list of the inputs parameters is reported in Table 1 and schematically reported in Figure 7.
Figure 7. Schematic of wing geometry inputs.
Table 1. List of Top-level inputs. Wing span
Wing Root Chord Wing Kink Chord Wing Tip Chord LE sweep inboard LE sweep outboard Trailing edge sweep
Span-wise position of wing root Span-wise position of wing kink Position of engines
Wing Box chord at root Wing Box chord at kink
Wing Box chord at tip Inter spar rib pitch Kink / Span ratio
Wing root thickness / Chord ratio Wing kink thickness / Chord ratio Wing tip thickness / Chord ratio Leading edge chord ratio Wing, slat and flap area Ailerons and spoilers area
Diameter, length and height of the fuselage Distance between ground and CL of fuselage Distance between main legs
The minimum requirement for the cost model to run is the High Level description. The geometric parameters are then divided with or multiplied by applicable constants or rates. This is followed by a significant number of calculations to reach a cost estimates. These calculations make use of assumed definitions, user-defined definitions and predefined formulas. The user-defined definitions are the values that the user of the cost model can modify to drive the cost model. They are usually choices that modify the behavior of the cost model formulas through the use of ‘IF-THEN’ rules. The cost suite is made up of eight modules as shown in Figure 8.
Figurer 8. Cost model architecture.
It is made of two manufacturing modules for Wing and Landing Gear (LG), a design, a production, a maintenance, an operational and an airline finance module, and all these feed the DOC cost modules. All models contain two key
sheets:
“EXTERNAL – INPUTS”: Inputs from other models in the framework. The individual models will make their own assumptions if an external input is not provided to enable them to be run stand-alone.
“OUTPUTS”: Outputs to other models in the framework, and the values required by the DOC model to enable the final outcome of a trade to be generated. The modules take outputs from a variety of domains, to enable the effects of a physical design change to be estimated. All costs are time based to enable cash flows for both Manufacturer & Airline to be evaluated. This model accounts for only Wing and LG but not consider the fuel and Hydraulics systems in detail.
The manufacturing processes are derived by Knowledge Elicitation/Benchmarking interviews with Production Engineers – Industrial from a wide range of companies, supplying components & assemblies to identify the best assumptions. The process involves the identification of the main features that drive the manufacturing process. Create a simplified manufacturing process, create the basic manufacturing process models and create the database of assumptions. These assumptions, around 3250, are single values associated to parameters such as time to perform operations based on the features of a part / assembly, machine costs per hour, labor cost per hour, inflation applied to labor cost, assumed percentage procurement levy charged by external supplier etc.
While there are many sections in the Wing and LG modules the core “Estimating” sections are illustrated in Figure 9.
7.1. Modules Dataflow
Manufacturing modules: These modules enable to consider the cost impact of a number of technologies/design solutions for the structural elements of Wing and Landing gear. Both modules take inputs from geometry, primarily high-level parameters to define the basic airframe, and from other domains to define the physical product such as number of parts, weights and etc. Moreover, they as input require shared project, program & financial assumptions. They output
manufacturing costs for the 100th & development aircraft to DOC model, part count to define physical design task to Design NRC model, parts lists, part count & process type to define physical production engineering task to Production NRC model. Major structural type (Metallic/Composite) and landing gear configuration (number of legs/wheels) to the maintenance cost model for the wing and landing gear module respectively. The data flow for the Manufacturing Wing module is shown in Figure 10.
Figure 10. Wing RC Data flow.
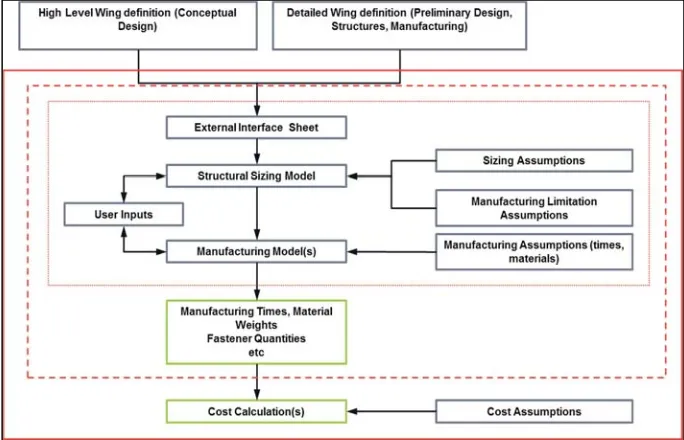
The wing module can be broken down into six basic components, as shown in Figure 11.
1. An external interface module – Sheet that takes data from a variety of different data sources.
2. A database of sizing assumptions and manufacturing constraints.
3. A structural sizing module that determines configuration
of Wing.
4. A series of manufacturing models compiled in the form of a Work Breakdown Structure (WBS)
5. A database of manufacturing times & material conditions used by the manufacturing processes. 6. A database of cost assumptions built on a single Excel
Spreadsheet.
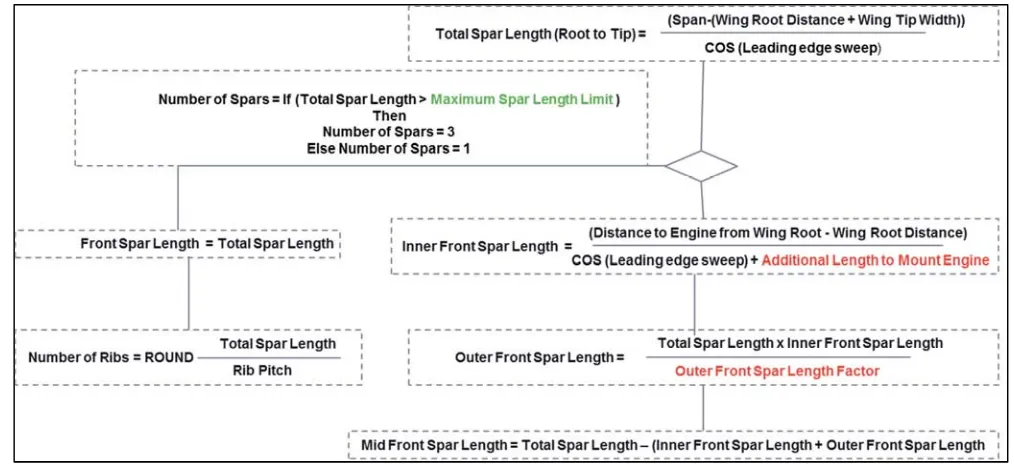
The main key element and largest part of the wing module is the structural sizing routines where the configuration of the wing is determined, a sample of which is shown below, this is typical of both the logic flow and level of math. Tool uses the concept of features to drive manufacturing processes. The features may be geometrical, quantity, volume (component,
component feature, and raw material), material density, etc. Features derived using Simple Rules of Thumb Heuristics, originally compiled from Knowledge Elicitation Interviews with Functional Design Experts in the areas of leading edge, trailing edge, and wing architects. In Figure 12 is reported just as an example of wing sizing routine.
Figure 12. Example of Wing module sizing routine.
The data flow for the Manufacturing LG module is shown in Figure13.
Figure 13. Landing Gear RC Data flow.
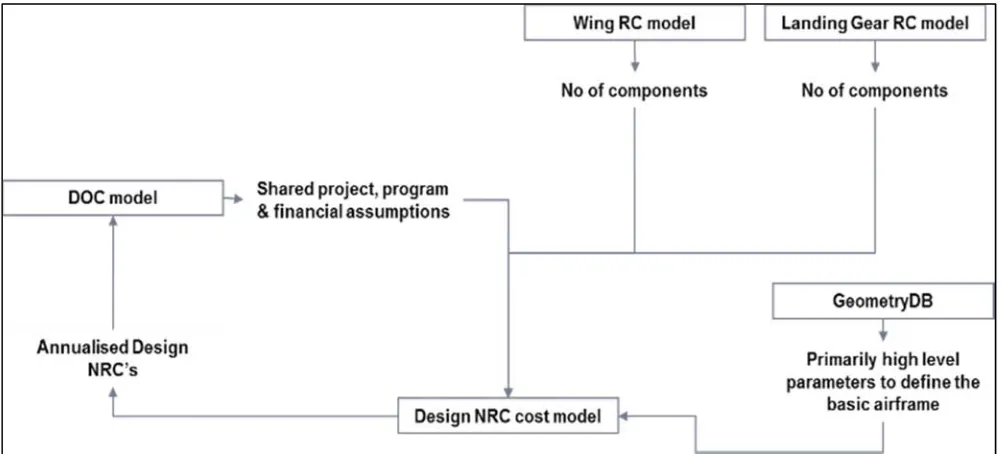
Design NRC: This module enables to calculate the cost related to non-recurring design activities. The inputs required
shared project, program and financial assumption. It outputs the annualized non-recurring cost for all the design activities.
Its data flow is shown in Figure 14.
Figure 14. Design NRC Data flow.
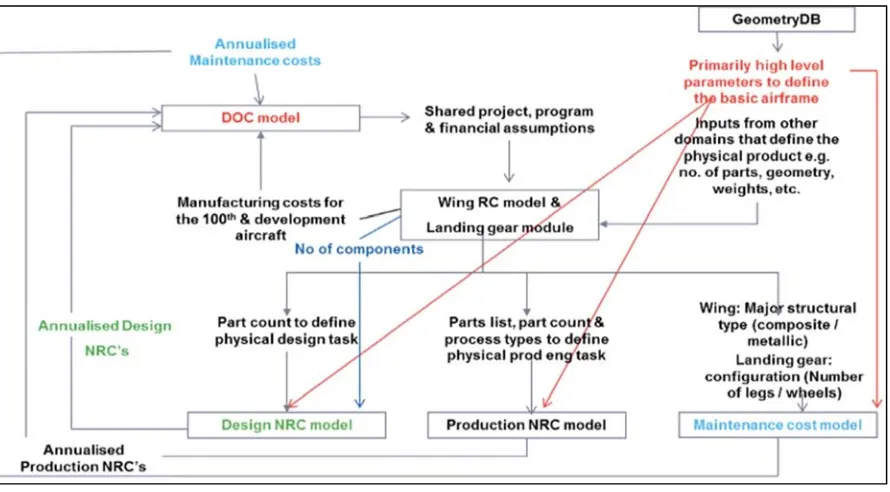
Production NRC: This module enables to calculate the cost related to non-recurring production activities. The inputs required are high-level geometric parameters to define basic airframe, information about wing part quantities, components, process types and manufacturing location to define physical
production engineering task. As the other modules it needs shared project, program and financial assumption. It outputs the annualized non-recurring cost for the production activities. Its data flow is shown in Figure 15.
Figure 15. Production NRC Data flow.
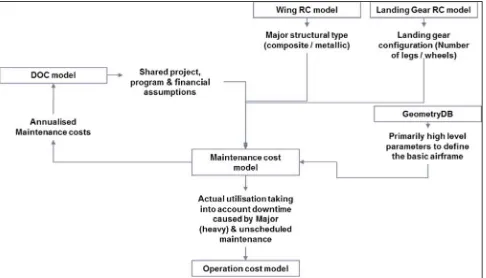
Maintenance: This module enables to calculate the cost related to scheduled and unscheduled maintenance. The inputs required are high-level geometric parameters to define basic airframe, information about wing part quantities, and structure
Figure 16. Maintenance Data flow.
The maintenance cost is broken down into Scheduled and Unscheduled maintenance. The scheduled maintenance cost includes the cost incurred after each transit, daily and weekly maintenance and heavy maintenance whereas unscheduled maintenance includes the maintenance cost for sub systems like APU, Fuselage, Hydraulic etc.
Operational: This module enables to calculate the
operational cost. The inputs required are high level geometric parameters to define basic airframe shared project, program and financial assumption and info from the maintenance module such as actual aircraft utilization taking into account downtime caused by scheduled and unscheduled. It outputs the annualized operational cost. Its data flow is shown in Figure17.
Figure 17. Operational Data flow.
Figure 18. DOC Data flow.
To summarize, the model is capable of calculating the Direct Operating Cost and provides the output in terms of both net present value and the absolute cost. Direct operating cost is the summation of Depreciation, Flying cost and Maintenance cost. The depreciation is calculated for only wing and landing
gear and does not account for Fuel systems and Hydraulic systems. DOC framework considers the cost of development aircraft to calculate DOC. It also accounts Non-recurring cost limited to design, production engineering and tooling cost, but it does not consider facilities cost. See Figure 19.
Figure 19. Cost breakdown structure (depreciation).
The cost model is also partly capable of doing the risk assessments like sensitivity analysis, uncertainty, and probability. It is capable to make a robust Trade-Off between Performance, Weight, Structure Layout, Manufacturing and
Figure 20. Example of output produced by the cost suite from an airline perspective.
Figure 22. Top 30 Component costs.
7.2. Capability Limitations
The Cost suite should not be used to provide a commercial estimate, as it does not take account actual commercial considerations such as specific supplier conditions (Location, Charge Rates etc.). Costing tool is partially decomposed to micro level of components for Wing and Landing gear whereas for Fuel and Hydraulics it does not goes to depth.
It does not provide a cost for the whole Wing and excludes components that are unlikely to be affected by relatively small changes in configuration and components that where considered unrealistic to model, either because they were too specific to a particular Design/Project or that their contribution has such a small impact to the overall cost.
The types of fastener for this specific study are limited to around 30 different generic functional types, identified as typical for a wing. The manufacturing processes limited to 7 types and treatments only covered at a very high level. The
technologies covered (but not exhaustive) are:
1. A Composite Wing (Spars & Wing Skins) using different types of Lay Up (ATL v AFP).
2. Conventional Metallic Wing, with provision to configure and compare different methods of Panel Manufacture.
3. Advanced Materials for Major Components, Alternative LG Mounting Options.
4. The financial and economic assumptions are based on 2016 data.
7.3. Model Center Version
and does not necessary handle the domain specific data transfer between applications, but can be used for this. As such, the tool does not replace the existing data management capabilities within individual domains, but rather acting to enable domain collaboration of data. This is shown in Figure 23 along with actual tooling user interface in Figure 24. The other software tool is Model Center. This is integration/process building environment. It allows other programs and components to be ‘wrapped’ into a generic workflow within it. One of its attributes is that components residing on any connected computer system can be used, including those using different operating systems. Also a designed component only exposes the data, which will be frequently changed by the users. The Cost suite has been integrated in Model Centre integration framework, see Figure 25, and automatically can take the input from external domain giving capability to link to other Domains Tool Sets. Changes in one cost model that impact on another model are passed automatically. The Outer Wing Module is the wing manufacturing cost calculations. The Landing Gear Module is the Landing Gear manufacturing cost calculations. The Design NRC Module calculates non-recurring costs for the design process. The Production NRC Module calculates non-recurring costs for the production process. The Maintenance module calculates both scheduled and non-scheduled for maintenance. The Operation module estimates operating costs, throughout the life of the aircraft, except disposal cost.
Figure 23. Collaboration framework within data management tool.
Figure 24. User work area of data management tool.
Figure 25. Model Center view of the cost suite.
The Operation module appears twice to resolve circular dependencies between the modules. The first instance is a limited calculation and only provides the variables and calculations required by the Maintenance module. The second instance does the full calculations, using the final results from the Maintenance module. The DOC module combines the results from the other modules to provide total costs. Like the Operations module it appears multiple times to resolve circular dependencies between the modules. The first instance only generates the variables and calculations required by the other modules. The second instance does calculations required to get the aircraft price, required by the Airline Finance module. The final instance does the full calculations, using the final results from all the other modules. The Airline Finance module calculates insurance, depreciation, and financing costs for the operator. In Figure 25, is possible to see that two converger components are used, they are called manufacturer driver and airline driver. The converger component provides an easy way to add feedback loops to a Model. The converger component in Model Center employs a fixed point iteration scheme meaning that computed values are directly linked back, unmodified, to guessed values. The analysis is then repeatedly run until the guessed and computed values differ by less than some error tolerance or a maximum number of iterations is reached. In these cases the internal loops run until the desired IRR is reached from both Manufacturer and airline. In other terms the driver modules are used to iterate the DOC module calculations. This allows profit margin to be set to obtain a targeted internal rate of return for the manufacturer, and ticket price to be set to achieve a desired internal rate of return for the operator. When a comparison between a reference aircraft and a concept one is desired to understand if there is any benefit in term of economic profitability, on the second run, using concept aircraft input, the ticket price is kept constant and the IRR left varying.
geometric features such as the fabrication areas of skin, spars and ribs, and the assembling perimeter of the wing are needed, as well as, mission information, see Table 2.
Table 2. Mission information. Number of Flight crew (if specified)
Number of Cabin crew (if specified) Number of passengers
Mission (block) time Mission fuel burn Mission Distance Mission fuel burn
The extraction of these parameters has been implemented in an automatic fashion using again the Model Center integration/process building environments. Figure 26 shows the Model Center process for the cost suite input generation.
The first component generates a password string to access the data management tool. The second component consists of a python script developed to extract those geometric features of the wing box from the 3D CAD model of the wing structure to enhance the product structure and improve the validity of the cost evaluation. In Table 3 there is a list of features extracted from the CAD wing model.
The third component is used to extract mass data to enable cost to reflect the actual design. Weight provided from Wing Weight Breakdown, including wing skins, stringers, spars and ribs, as reported in Table 4.
The fourth one extracts info on the Manufacturing complexity including process type, process time and raw material weight.
The last one generates the input file that will be used on the cost suite. Figure 27 shows all the integrated process.
Figure 26. Model Center view of the input generation.
Table 3. Wing Box geometry information. Spars
The depth of the leading edge spar at the tip Single piece spar length
Single or Inner Spar maximum spar depth Top and Bottom panels
Surface area of wing skin
Leading edge length of panel (inc. growuots) Trailing edge length of panel (inc. growuots) Width of panel at the wing root
Width of panel at the wing tip
Table 4. Mass Information. Spars Weight
Spars Spars Weight Ribs Wight
Top and Bottom Wing Skin Panels: Skin Weight
Stringers Weights
Figure 27. Integrated Cost Suite.
8. Results
Several trade studies have been performed and cost results produced for different real case configurations. They are not fully reported in this paper for confidentiality reasons. In order to show the capability of the cost model a trade study has been performed on the same aircraft using different wing material, composite versus metallic. The main goal of the cost model is to clearly intoduce to a designer the cost changes with respect to design changes. In this particular case the ticket price has been kept fixed and the Direct Operating Cost results compared. Figure 28 and Figure 29 show the DOCs for both configurations, metallic and composite wing respectively.
Figure 28. DOC metallic wing.
by fuel cost consumption. Moreover there is also a benefit in manufacturer profit of nearly 1%. Another example of study is here reported. In this case starting with a reference wing, the trade study consists to evaluate the effect of span and leading edge sweep angle changes against the economic profitability in term of both manufacturer and airline point of view. Specifically, three alternatives geometries are considered versus the reference one.
Figure 29. DOC composite wing.
The first case considers an increase in span, keeping wing area and sweep angle constant, as shown in the followings Figure 30.
Figure 30. Wing geometry comparison.
In the second case the leading edge sweep angle has been reduced keeping constant span and wing area, in the third case keeping constant only the wing area the span has been increased and the sweep angle reduced as it is shown in Figure 31.
After evaluating the reference and all the wing variants it has been found that none of the variants are superiors in term
of economic profitability compared to the reference wing both for the airline and the manufacturer, as can be seen in Figure 32 where the Net present Value (NPV) is plotted in percentage terms.
Figure 31. Sweep Changed (left), Span and sweep changed (right).
Figure 32. Net Present Value comparison.
9. Conclusions
It also accounts for the Non-recurring cost limited to design, production engineering and tooling cost, but it does not consider facilities cost. Afterwards, the cost suite has been integrated using an integration framework and automatically linked with other external domains giving capability to take input from other Domains Tool Sets. Therefore, changes in one model that impact on another model are passed automatically. In this way, the cost model is implemented in a multidisciplinary process allowing a trade-off between weight, structure layout, manufacturing process, aero performance and cost.
Different trade studies have been performed and cost results produced for different real case configurations, but not fully reported in this paper for confidentiality reasons. In addition, the integration of the cost suite in Model Center can consent to perform cost optimisation studies making use of the built-in design optimisation capability offered by the integration framework that allows automatic search for improved designs. To conclude, the importance of engineering costing within aircraft design should have a more directly influential role. A new methodology for the generation of a Multidisciplinary Cost framework for preliminary aircraft design has been proposed that allows to rapidly predict and visualize cost changes and trends when different design decisions are made.
Acknowledgements
This work has been supported by Airbus Operations Ltd, which is here gratefully acknowledged. Additional the authors want to acknowledge the Higher Education and Innovation Fund (HEIF) for the funds received for publishing it.
Due to confidentiality agreements with research collaborators, supporting data can only be made available to bona fide researchers subject to a non-disclosure agreement with Airbus Ltd.
References
[1] Xu, Y. et Al., Cost Engineering for manufacturing: Current and future research, Int. J. of Computer Integrated Manufacturing, Issue 4-5: Special Issue: Through Life Cost Estimating, 2012, Volume 25.
[2] Humphreys, K. K., Project and Cost Engineer’s Handbook, 4th ed., Marcel Dekker, New York, 2005.
[3] The aerospace industry: statistics and policy, Report 2017, House of Common Library.
[4] Di Pasquale D., Gore D., Savill M., Kipouros T. & Holden C., Cost modelling for aircraft in a multi-disciplinary design context. In: Advances in Manufacturing Technology XXX: IOS Press, 2016, p. 471-476.
[5] Sirirojvisuth, A., Development of a Hybrid Lifecycle cost estimating tool (HLCET) for manufacturing influenced design trade off, PhD thesis, Georgia Institute of Technology, 2012.
[6] Gantois, K., and Morris A. J., Incorporation of manufacturing information into an MDO environment, The Aeronautical Journal, 1999, Volume 23, pp. 383-388.
[7] Bode, J., Decision support with neural networks in the management of research and development: concepts and application to cost estimation, J. Information & Management 34, pp. 33-40.
[8] Early J. M. and Price, M. A., Whole-Life Costing for Capability, J. of Aircraft, 2012, Vol. 49, No. 3.
[9] Narasimha, L. Development of appropriate solutions using current costing tools to support Multidisciplinary Design Optimisation (MDO), Master thesis, Cranfield University, Cranfield, UK, 2009.
[10] Peoples, R. and Willcox, K., Value-Based Multidisciplinary Optimization for Commercial Aircraft Design and Business Risk Assessment, J. of Aircraft 2006 Vol. 43, No. 4, pp. 913-921.
[11] Roskam, J., Airplane Design: Part VIII, Airplane Cost Estimation: Design, Development, Manufacturing and Operating, Roskam Aviation and Engineering Corporation, 1990.
[12] Btissame, Towards a whole Life Cycle Cost Model for ERP projects, Master thesis Cranfield University, 2006 pp. 9-11.
[13] Ostwald, P., Engineering cost estimating, Englewood Cliffs, NJ: Prentice -Hall; 576pp, ISBN 0-13-276627-2. 1992.
[14] Stewart, R. Wyskidsa, R., Johannes, J, Cost estimator’s reference manual, 2nd ed. New York: Wiley Interscience,1995.
[15] Shuford, R. H., Activity-based costing and traditional cost allocation structures. In: Stewart RD, Wyskida RM, Johannes JD, editors. Cost estimator’s reference manual, 2nd ed. New York: Wiley, 1995, p. 41–94.
[16] Curran, R., Raghunathan, S. and Price, M., “Review of Aerospace Engineering Cost Modelling: The Genetic Causal Approach, Progress in Aerospace Sciences 2004, Vol. 40, pp. 487-534.
[17] Torenbeek E., Synthesis of Subsonic Airplane Design, Delft University Press, Martinus Nijhoff Publishers, 1982.
[18] Niazi, A., Dai J. S., Balabani S., and Seneviratne L. Product cost estimation: Technique classification and methodology review. J. of Manuf Science and Eng, Transactions of the ASME, 128 (2): 563-575, 2006.
[19] Roy, R., 2003. Cost Engineering: Why, What and How? Decision Engineering Report Series, Cranfield University, ISBN 1-861940-96-3.
[20] Roy, R. and Cheruvu, K. S, A competitive framework for industrial product service systems, Int. J. Internet Manufacturing and Services, 2009, 2 (1), pp. 4–29.
[21] DoD, Parametric estimating handbook, Department of Defence, 1999.
[22] Weirda, L. S.,"Linking Design, Process Planning and Cost Information by Feature-based Modelling, J. of Engineering Design Vol. 2 No. 1, 1991.
[23] Agyapong-Kodua, K., Wahid B. M. and Weston R. H., Towards the derivation of an integrated process cost modelling technique for complex manufacturing systems, Int. J. of Production Research, 2012.
[25] Harding A, Lowe D, Hickson A, Emsley M, Duff R. The cost of procurement: a neural network approach, International conference in construction information technology. Reykjavik, Iceland; 28–30 June 2000.
[26] Thokala P., Scanlan J. and Chipperfield A., Framework for Aircraft Cost Optimization Using Multidisciplinary Analysis, J. of Aircraft, 2012,Vol. 49, No. 2.
[27] Curran, R., Price, M., Raghunathan, S., Benard, E., Crosby, S.,
Castagne, S., Mawhinney, P., Integrating Aircraft Cost Modeling into Conceptual Design, Concurrent Engineering: Research and Applications, Vol. 13, No. 4, Dec. 2005, pp. 321– 330.
![Figure 2. The cost estimation paradox [7].](https://thumb-us.123doks.com/thumbv2/123dok_us/1017446.1601720/2.595.46.287.185.347/figure-the-cost-estimation-paradox.webp)
![Figure 3. Example of the trade-off between cost and weight as a function of the performance of the structural part [10]](https://thumb-us.123doks.com/thumbv2/123dok_us/1017446.1601720/3.595.92.239.229.332/figure-example-trade-cost-weight-function-performance-structural.webp)